OVERVIEW OF COFACE

1. PRESENTATION OF THE COFACE GROUP

1.1History of the Group

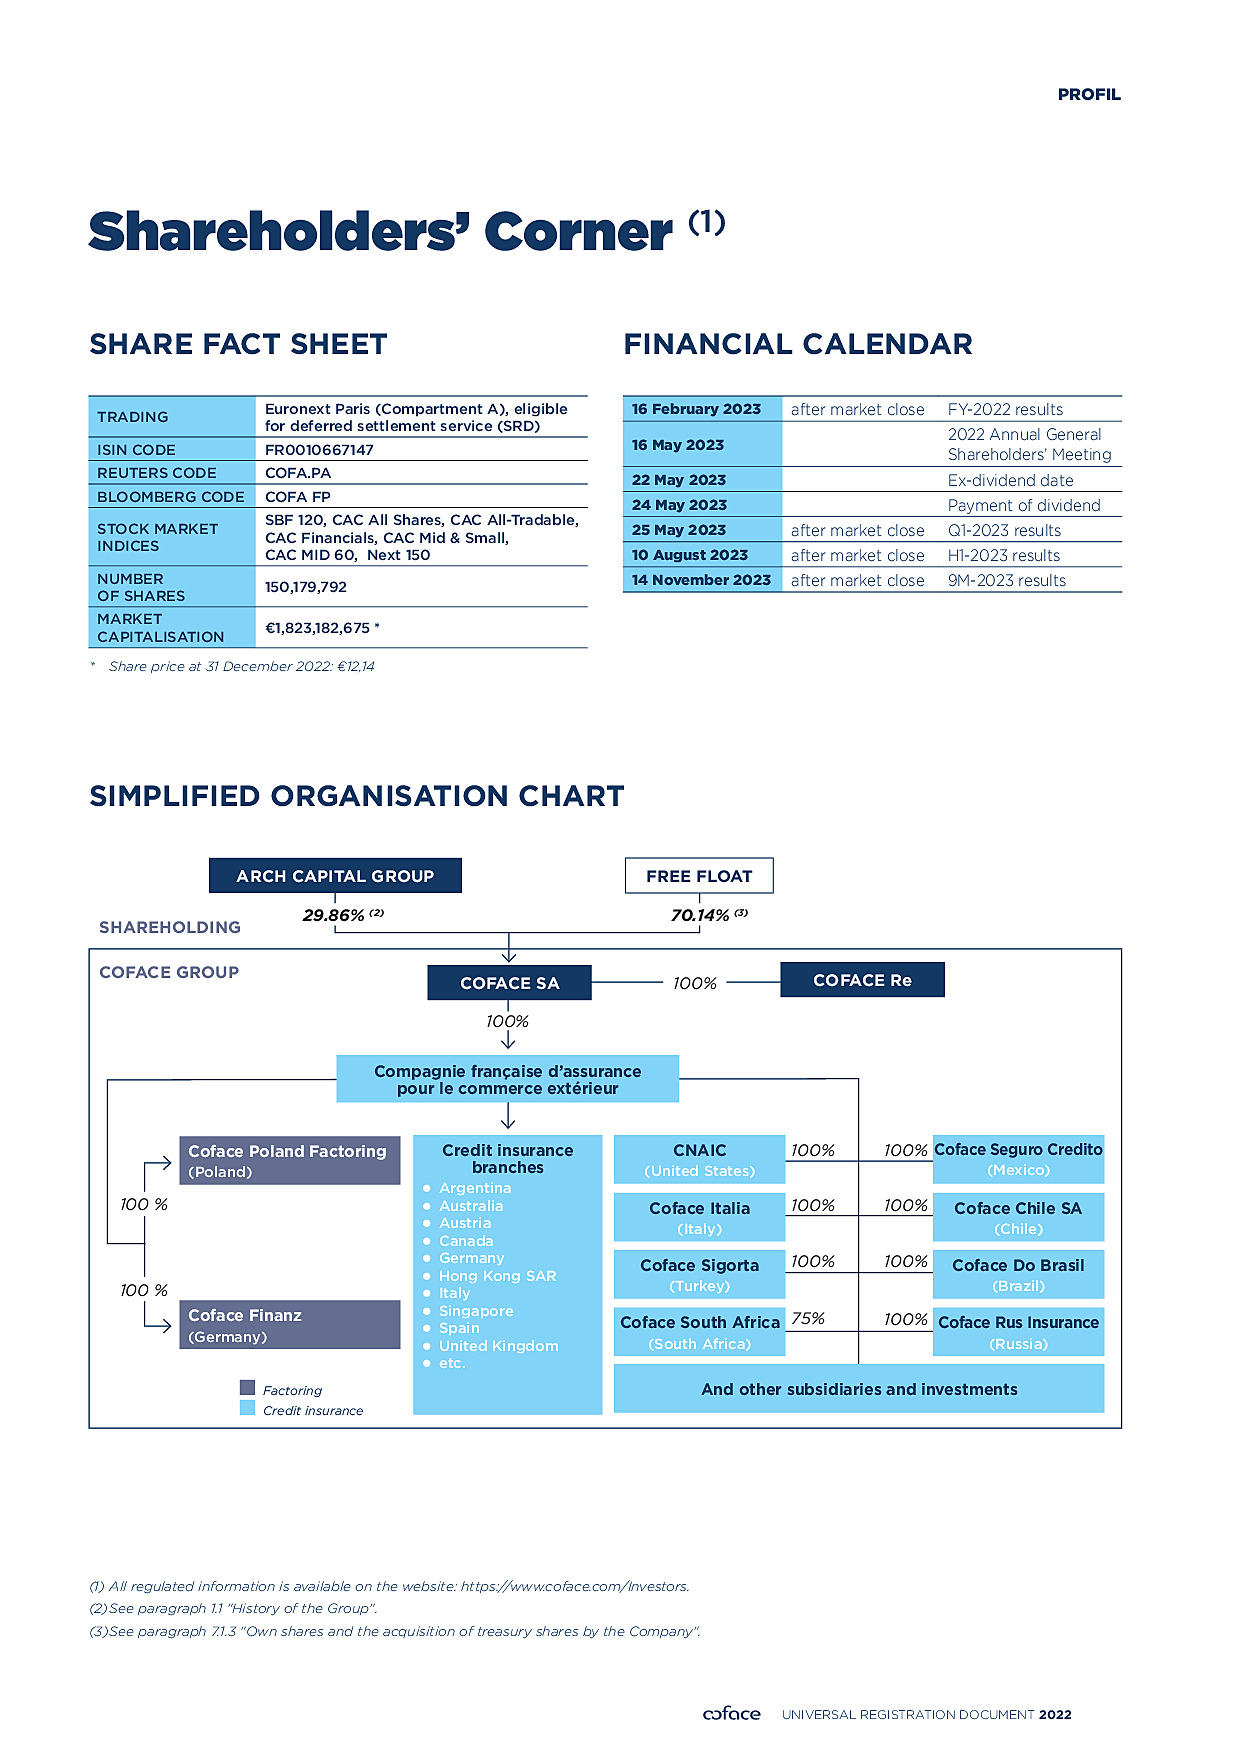
COFACE SA (“the Company”) is the holding company of the Coface Group (“the Group”). It performs its activities through its primary operating subsidiary, Compagnie française d’assurance pour le commerce extérieur, and its subsidiaries. The key dates in its history are described below.

1.1.1Creation and changes to shareholding structure

1946

Compagnie française d’assurance pour le commerce extérieur was created by decree in 1946 and established in 1948 to support French foreign trade. It is the source of the Group as it exists today. Its first shareholders – insurance companies, banks and other financial establishments – were primarily controlled by the French State. Following the privatisation of a large number of these companies in the 1980s, the French government’s indirect holdings gradually decreased.

1994

With the privatisation of SCOR (a result of the privatisation of UAP), its major shareholder, most of the capital of Compagnie française d’assurance pour le commerce extérieur became private, but Coface continued to manage State guarantees on behalf of the French State.

2000

Compagnie française d’assurance pour le commerce extérieur was listed on the primary market of the Paris Stock Exchange by its shareholders.

2002

Natexis Banques Populaires, established through the acquisition by the Caisse centrale des banques populaires of Natexis, which resulted from the merger of the Group’s two original shareholders (Banque française du commerce extérieur and Crédit national), acquired 35.26% of the Compagnie française d’assurance pour le commerce extérieur share capital from SCOR and became its majority shareholder, owning 54.4% of the share capital.

2006

After Compagnie française d’assurance pour le commerce extérieur was delisted from the Paris Stock Exchange in 2004, it became a wholly owned subsidiary of Natixis, the entity born out of the merger between Natexis Banques Populaires and Ixis CIB. Natixis is the financing, asset management and financial services bank of Groupe BPCE, one of the leading French banking groups, which was created by the merger of the Banques Populaires and Caisses d’Epargne in 2009.

2009 and 2010

The Company strengthened its equity through two capital increases, fully subscribed by Natixis, for €50 million and €175 million respectively, in view of maintaining the Group’s solvency margin in the sharp economic slowdown at that time.

2014

On June 27, the Company launched an initial public offering (IPO) on Compartment A of the Euronext Paris regulated market. The offering concerned a total of 91,987,426 shares, representing 58.65% of its capital and voting rights.

2018

The Company proceeded with two share buyback programmes, of €30 million and €15 million respectively, under the second pillar of the Fit to Win strategic plan, with the aim of improving the capital efficiency of its business model.

2019

On June 24, the Euronext Expert Indices Committee included COFACE SA in the SBF120, the flagship index of the Paris Stock Exchange. This was thanks to the improved liquidity of Coface securities and an increase in its market capitalisation.

2020

On February 25, Natixis announced the sale of 29.5% of the capital of COFACE SA to Arch Capital Group Ltd (“Arch”). Completion of the transaction was subject to obtaining all the required regulatory authorisations. At December 31, Natixis’ stake in the Company’s capital remained at 42.20% pending the completion of the transaction.

On October 26, the company launched a €15 million share buyback programme. Through the Build to Lead strategic plan, Coface continues to improve the capital efficiency of its business model.

2021

On February 10, Natixis and Arch Capital Group announced that the sale of 29.5% of COFACE SA’s shares had obtained all the necessary approvals. Following this transaction, Natixis’ stake in the Company’s capital stood at 12.7%.

2022

On January 6, Natixis announced the sale of its remaining stake in COFACE SA. This disposal represented approximately 10.04% of COFACE SA’s share capital, or 15,078,095 shares. It was carried out by means of an accelerated bookbuild (ABB) at an average price of €11.55. As a result of this transaction, Natixis no longer holds any shares in COFACE SA.

Its average market capitalisation in 2022 was €1,645,669,576.

1.1.2The Group’s international expansion

1992

  • The Group adopted an international growth policy, acquiring various credit insurance companies and establishing new subsidiaries or branches. It started with the acquisition of an equity interest in La Viscontea, an Italian surety bond insurance and credit insurance company.
  • This international growth policy was also based on the creation of the CreditAlliance network, in order to enter into various strategic partnerships, especially in emerging countries (located in Latin America, Asia and Africa).

1993

The Group acquired a stake in London Bridge Finance, a UK financial company providing credit insurance services. The Company’s local branch, Coface LBF, has since taken over this business.

1996

The Group acquires an initial stake (later fully acquired by Coface) in Allgemeine Kredit, a German company providing domestic and export credit insurance solutions.

1997

The Group acquires an initial stake (later fully acquired by Coface) in Österreichische Kreditversicherung, the leading Austrian credit insurer.

2002

The Group took an equity interest in the portfolio of Continental in the United States.

2014

As part of its sales development, Coface reorganised its international network of partners, CreditAlliance, and renamed it Coface Partner, to draw on the strength of networks of larger scale than the Group’s own commercial network.

2019

With the aim of achieving growth in new high-potential markets, Coface finalised the acquisition of PKZ, the leading provider of credit insurance in Slovenia, and created the Coface entity in Greece. In this way, Coface extended its business and strengthened its presence in key geographic regions For Trade.

2020

With the acquisition of GIEK Kredittforsikring AS, Coface strengthened its position in the Nordic market. This will increase services available to Norwegian exporters, allowing them to contribute more to the country’s economic development.

2023

The Group acquires Rel8ed, a North American data analytics boutique. The acquisition brings new, rich data sets and analytics capabilities.

1.1.3Strategy

2002

Until 2010, the Group was positioned as a multi-service player specialised in trade receivables management for companies.

2011-2013

In 2011, as part of the refocusing of its activities on its core business – credit insurance – the Group launched the Strong Commitment strategic plan and took around 80 far-reaching measures to clarify and optimise its business model around credit insurance. The implementation of this plan addressed three essential concerns:

  • focusing on the fundamentals of credit insurance, its core business;
  • establishing the conditions for sustainable and profitable growth; and
  • implementing structured, flexible governance focused on innovation.

2015

  • On July 29, 2015, the French State announced its decision to transfer the State guarantees management activity carried out by Coface to the Bpifrance group, and that it had reached an agreement with Compagnie française d’assurance pour le commerce extérieur on the financial terms of such transfer. The management of State export guarantees was a services business that Coface carried out on behalf of the French State.
  • The amended French Finance Act of December 29, 2015 (No. 2015-1786) provided for the transfer of this activity no later than December 31, 2016. The December 29, 2016 Finance Act (No. 2016-1917, Articles 47 and 127) set the effective date of the transfer at January 1, 2017.

2016-2019

In the first half of 2016, the Group was faced with declining profitability. To respond to this volatile environment, Coface’s management developed a three-year strategic plan, Fit to Win, with two ambitions:

  • to become the most agile international credit insurer in the sector, and
  • to move its business model towards greater capital efficiency.

The strategic plan was completed successfully in 2019. Coface exceeded all the objectives set in the Fit to Win plan. The decline in the combined ratio to 77.7% for the 2019 financial year (better than the target of 83% through the cycle) was a perfect illustration of this.

In three years, turnover increased by 9% at constant FX and perimeter, to reach €1,481 million in 2019. Net income amounted to €146.7 million, with an annualised return on average tangible equity (RoATE) of 8.9% (9.1% excluding non-recurring items).

Coface improved its capital efficiency, obtaining approval of its partial internal model by the regulator, the ACPR.

In three years, €48 million in savings were achieved, surpassing the objective set in the strategic plan.

2020-2023

In 2020, Coface began a decisive step in its development by launching a new four-year strategic plan, “Build to Lead”.

Built on two pillars, it plans to strengthen the Group’s leadership in the credit insurance market by standing out with its expertise in risk and information services, while simplifying its operating model. The plan also aims to seize growth opportunities by developing adjacent activities that complement Coface’s long-standing credit insurance business, for example information services, surety bonds, Single Risk coverage and factoring.

Despite a highly volatile economic environment during 2020, 2021 and 2022, the Group continued to implement this strategic plan, investing in operational efficiency, service quality, technological resources and sales efficiency. These investments are bearing fruit as evidenced by the resilience of its core credit insurance business and growth in adjacent businesses such as information services and factoring.

Although Coface’s turnover declined slightly in 2020, the year of the global crisis caused by Covid-19, it achieved an excellent operating performance in 2021 and 2022. Throughout the period, and in challenging circumstances with a downturn followed by a sharp recovery in economic activity and the emergence of new risks (inflation, rising interest rates, international conflicts, etc.), Coface’s teams worked hard to continue supporting their clients and help them navigate this uncertain environment.

Coface’s commitment to supporting the economy is reflected in a significant increase in commitments (€666.9 billion at the end of 2022 versus €537.2 billion at end-2019) and the relevance of its services, which is illustrated in particular by a record level of customer retention (92.9 at end-2022).

1.2Presentation of the credit insurance market and the competitive environment

1.2.1Credit insurance market

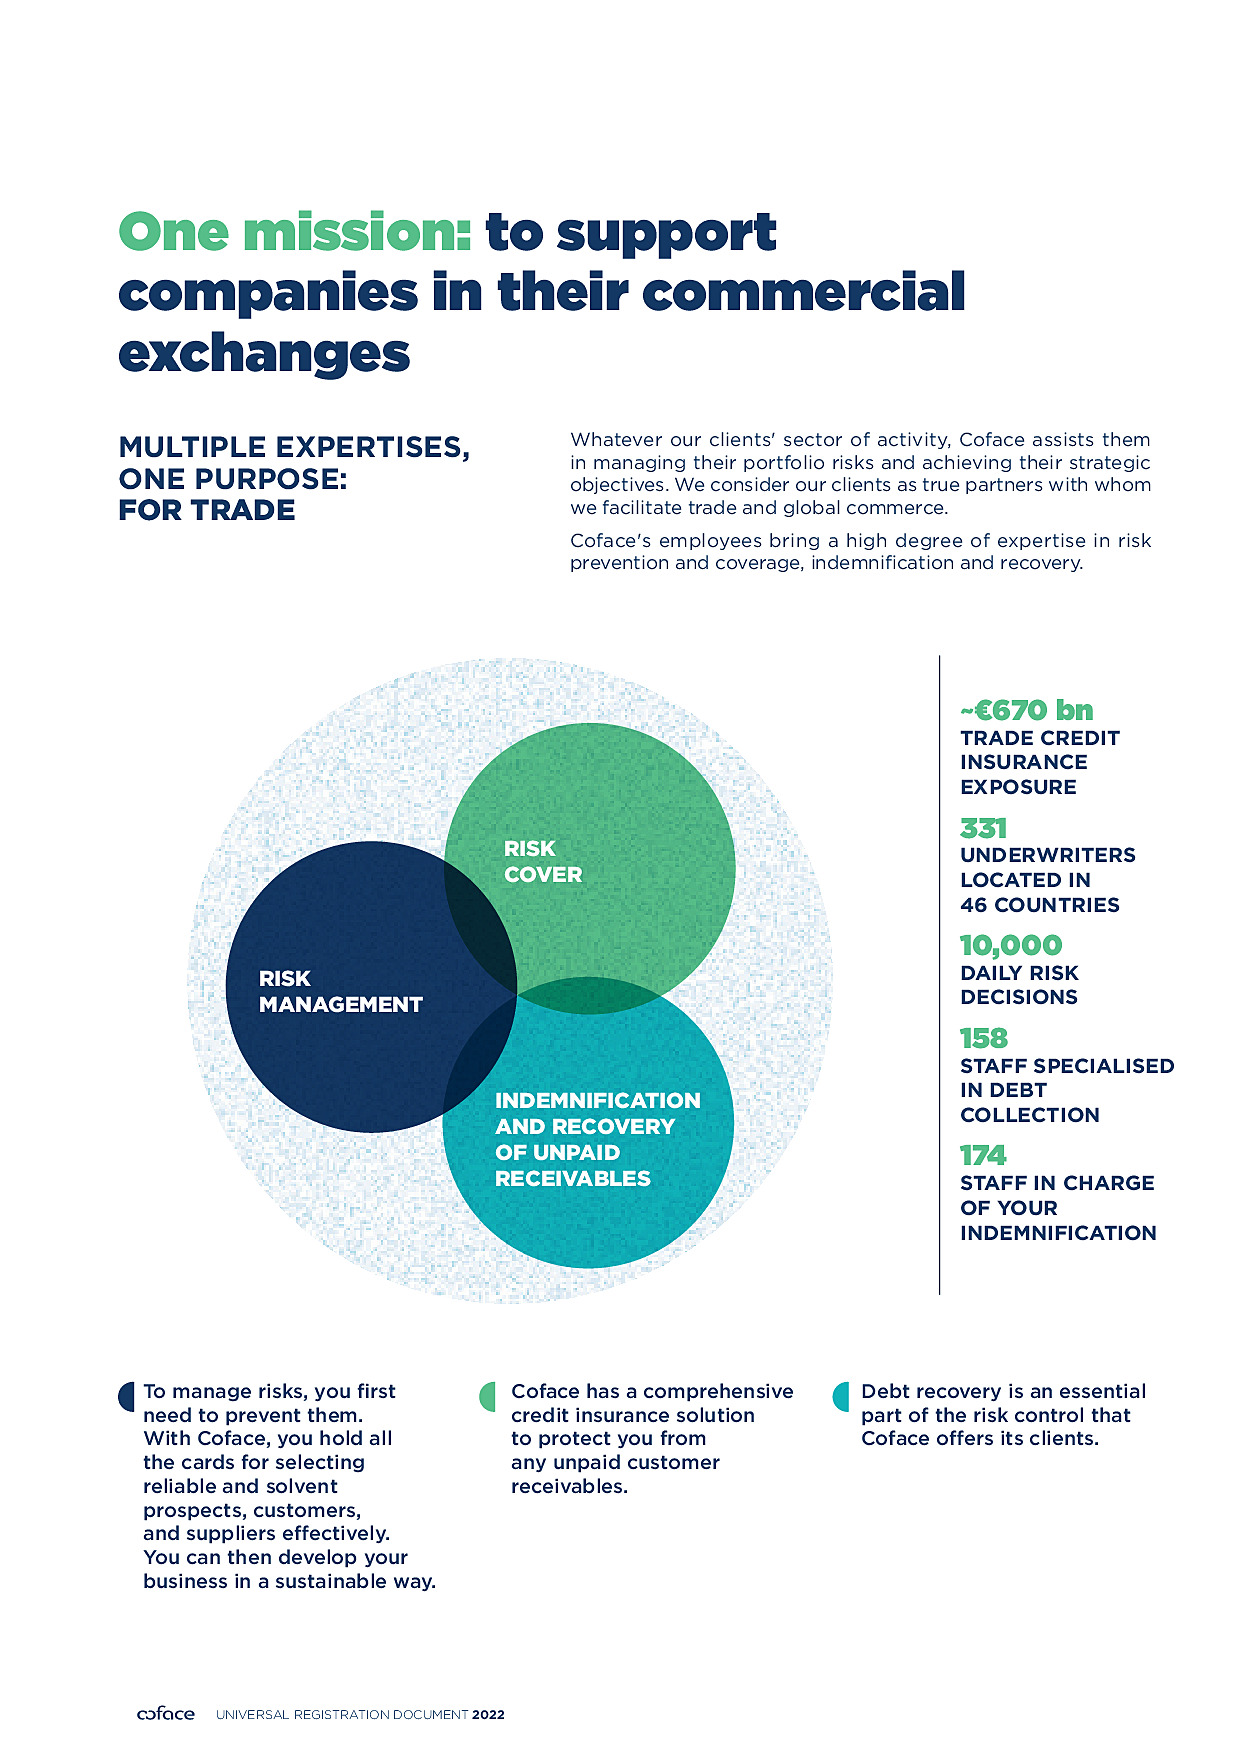
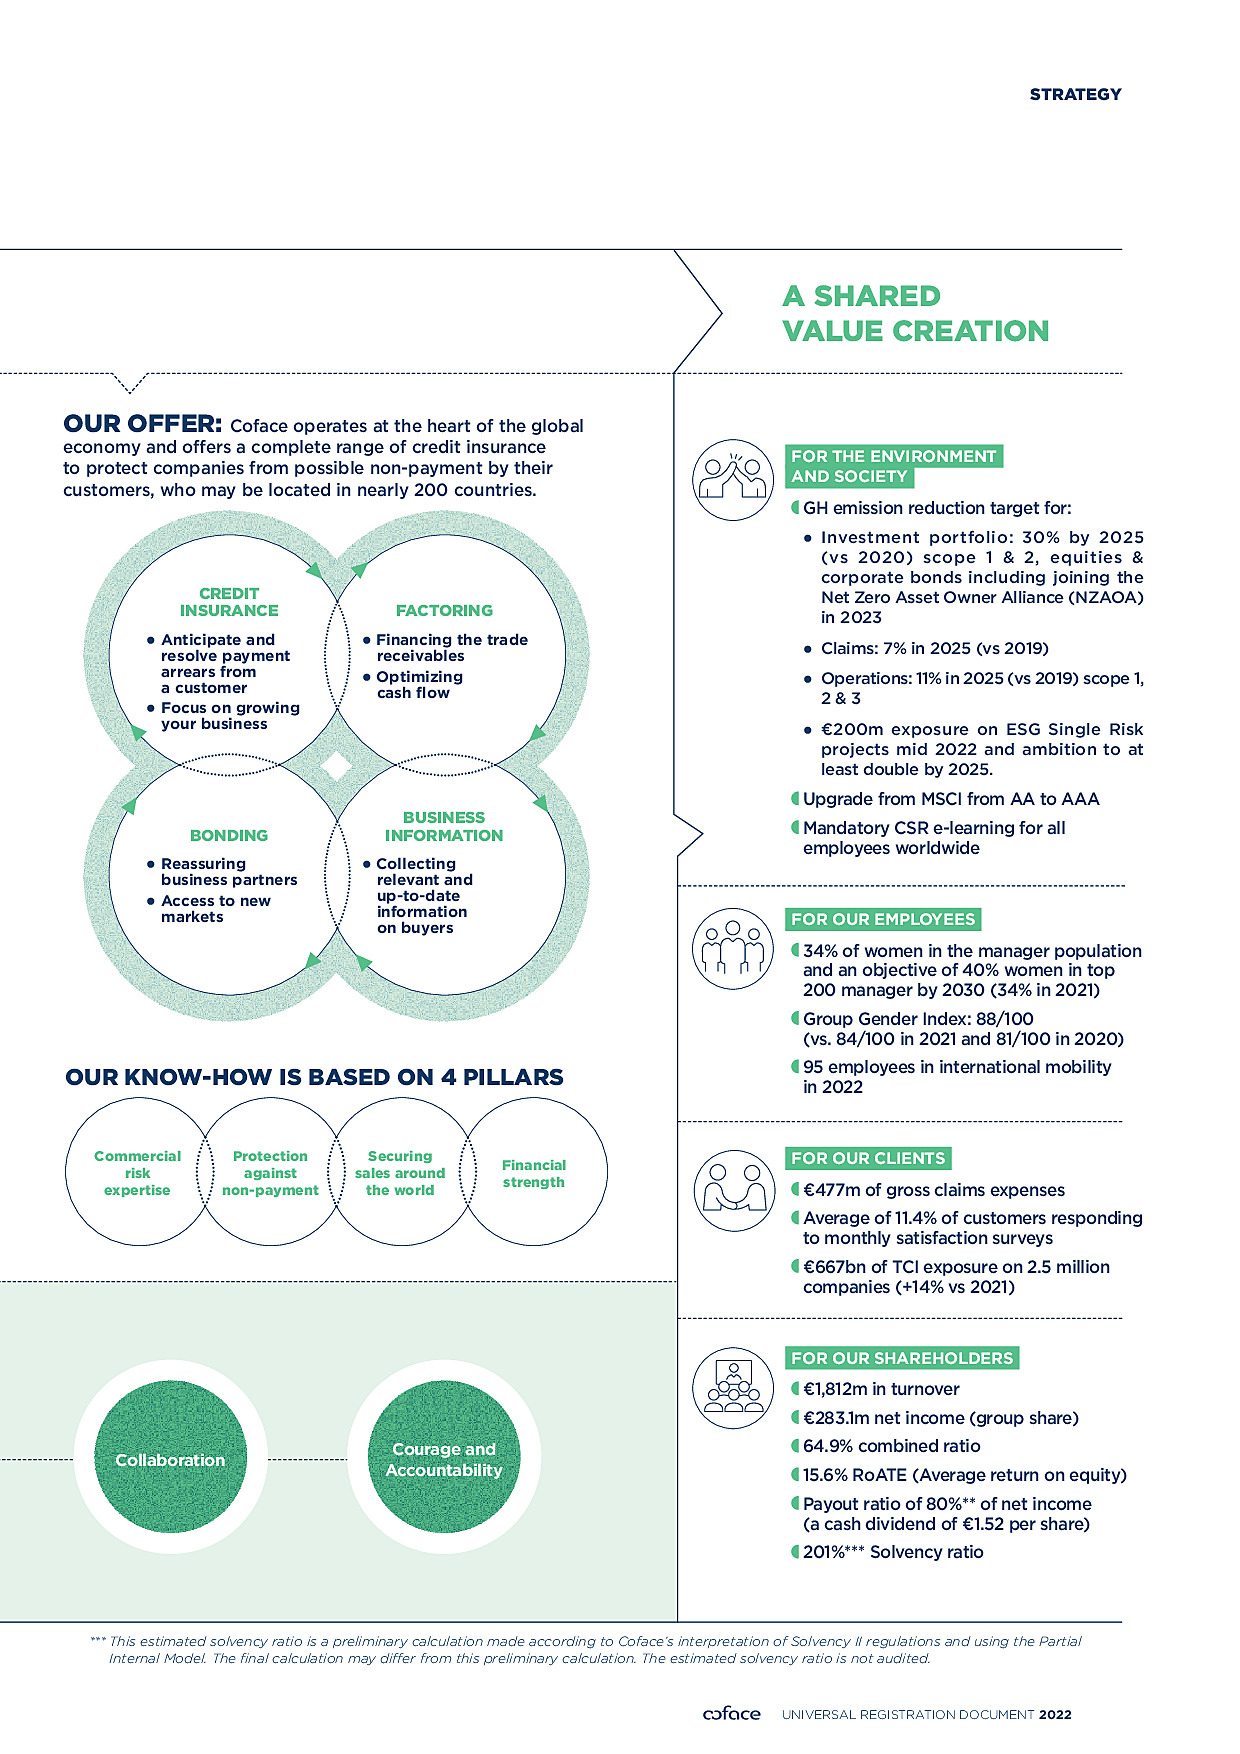
The purpose of credit insurance is to protect a company against default on the payment of its trade receivables. It provides conditional insurance coverage on counterparties approved by the insurer. The solution offers two basic services: the prevention of debtor risks – by selecting and monitoring insured buyers – and the collection of unpaid receivables. In the classic form of the product, these two services are the main hallmarks of the expertise of sector players.

The Group’s principal activity concerns short term credit insurance (defined by risks of no more than 12 months), which is a market representing around €8 billion in premiums. The Group is also active in the medium term credit insurance market through its Single Risk offer. This is a global market which is often syndicated, with a value of some €1.8 billion of premiums. In 2022, the Single Risk business accounted for approximately 1.4% of the Group’s consolidated turnover.

The Group believes that the credit insurance sector has significant growth potential. The credit insurance penetration rate in the total volume of trade receivables worldwide remains very low, estimated at between 5% and 7%, which means that there is a genuine opportunity for conquering new markets. However, growth in the sector remains modest, at around 3%, and typically fluctuates between 0% (2016) and 5% (2005-2009, 2019) when driven by the global economy (1). In 2020, however, the market contracted by more than 5% due to the economic crisis caused by Covid-19, which has given way to a strong recovery since 2021, strengthened by the effects of inflation in 2022.

Sector growth depends on several factors, which are sometimes contradictory:

  • client acquisition by sector players (and conversely, the potential loss of clients);
  • organic growth in turnover among credit insurance clients;
  • price trends, either up or down;
  • the risk selection policy by participants, up or down.

1.2.2Competitive environment of the Coface Group

The global credit insurance market comprises three types of participants: global insurers, national or regional players and niche players.

There are three global insurers: Coface, Allianz Trade (formerly Euler-Hermes, a Belgian subsidiary of the Allianz group, which is listed on the Frankfurt stock exchange) and Atradius (a Dutch company belonging to Grupo Catalana Occidente, which is listed on the Madrid Stock Exchange). In 2021, these three insurers accounted for around 61% of the global market (2).

/Market share of the main credit insurance players – 2021
COA2022_URD_EN_G001_HD.png

The other participants are national or regional players and some of them are derived from or are still public export insurance agencies. These include Sinosure (China), the largest by size, followed by Nexi (Japan), K-Sure (South Korea), EDC (Canada) and Cesce (Spain). There are also private local players, such as the German R+V.

Lastly, a growing number of participants tackle credit insurance with a niche strategy. This strategy allows them to partly bypass the high cost of establishing and maintaining a global debtor information database. These players generally delegate more broadly the selection of risks to policyholders that can demonstrate effective risk management; the insurer provides its financial strength to absorb shocks that exceed a significant deductible. Among the players in this segment, AIG (United States) is the largest in terms of credit insurance earned premiums.

(1)
The ICISA database only contains data on ICISA partners (participants and countries) and does not represent the entire credit insurance market.
(2)
Global market shares are calculated on the basis of gross short term credit insurance premiums, including markets under state monopoly, in 2021. Sources: i) Official market sources, often at the behest of regulators, and sometimes published by a consolidating organisation (for example, Latino Insurance in Latin America. ii) Published consolidated financial statements, when they show the share of gross credit insurance premiums. iii) ICISA data (www.icisa.org), consolidated and published by the association upon declaration by its members. iv) Group estimates, as a last resort.

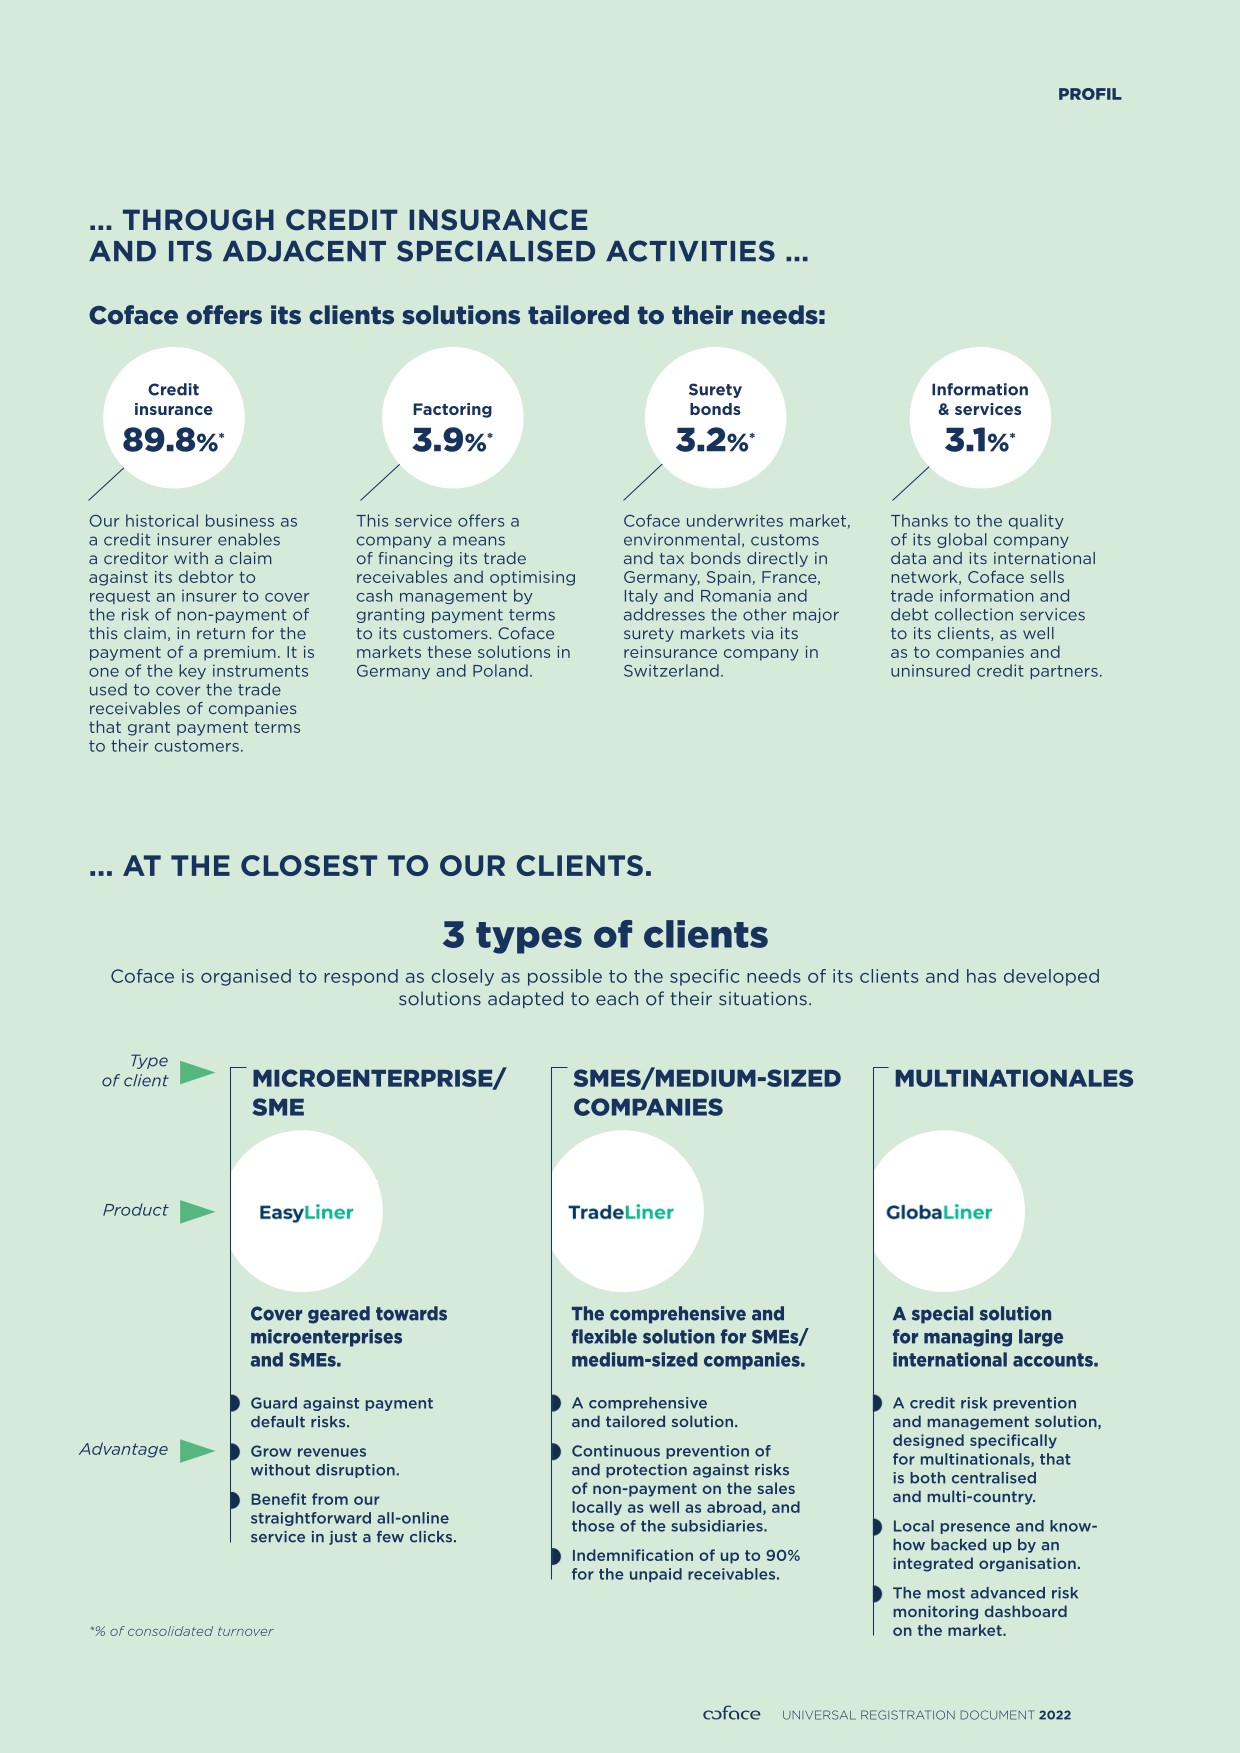
1.3Principal activities

The Group’s activities are mainly focused on credit insurance, which represented 89.8% of turnover in 2022. This entails providing businesses with solutions to protect them against the risk of client debtor insolvency in both their domestic and export markets.

The Group is also present in the factoring market, in Germany and in Poland, and in the surety bond market. In some countries, mainly in Central Europe and Israel, the Group has historically sold business information and debt collection products. In 2020, the Group decided to modernise its information offering to develop new markets. The new ICON sales portal has been launched and the activity has entered the acceleration phase, in line with the Group’s strategic plan.

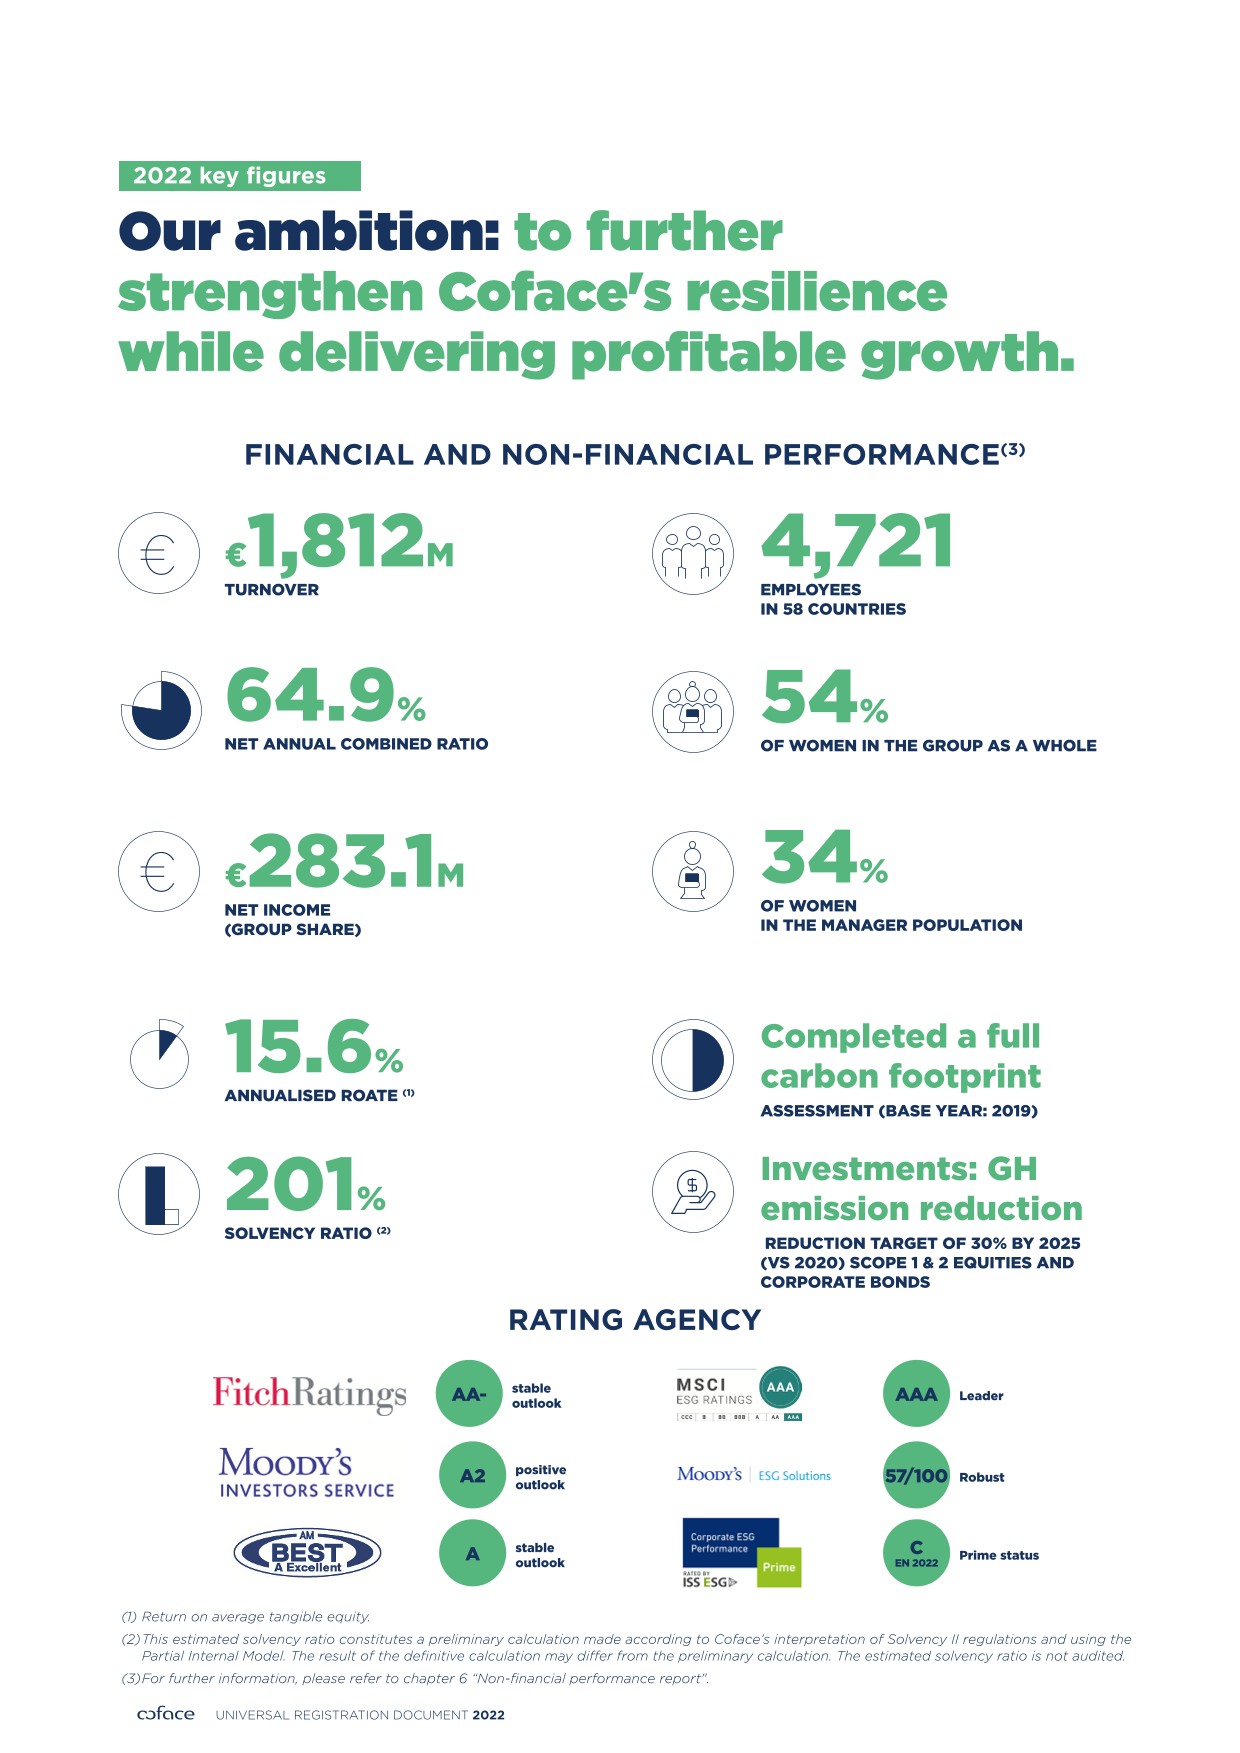
The Group generates its consolidated turnover of €1,812 million from approximately 100,000 (1) clients. Average annual income per client is less than €30,000 and is generated in very diversified business sectors and geographic regions.

The Group considers that it is not dependent on any individual policyholders. For the financial year ended December 31, 2022, the largest policyholder accounted for less than 1.2% of its consolidated turnover.

The following table shows the contribution of these activities to the Group’s consolidated turnover at December 31 for the 2020-2022 period:

/Consolidated turnover by business line

(in thousands of euros and as a % of the Group total)

See also Section

Dec. 31, 2022

Dec. 31, 2021

Dec. 31, 2020

(in thousands of euros)

(as a %)

(in thousands of euros)

(as a %)

(in thousands of euros)

(as a %)

Gross earned premiums – Credit


1,444,175

79.7%

1,242,767

79.3%

1,132,876

78.1%

Gross earned premiums – Single Risk


24,480

1.4%

15,839

1.0%

21,141

1.5%

Gross earned premiums – Credit insurance


1,468,655

81.1%

1,258,606

80.3%

1,154,017

79.5%

Fee and commission income (1)


158,582

8.8%

140,691

9.9%

143,985

9.9%

Other related benefits and services (2)


39

0.0%

156

0.0%

102

0.0%

Turnover from credit insurance

1.3.1

1,627,276

89.8%

1,399,453

89.3%

1,298,104

89.5%

Gross earned premiums – Surety bonds

1.3.3

58,809

3.2%

54,031

3.4%

50,317

3.5%

Financing fees


32,769

1.8%

26,409

1.7%

26,995

1.9%

Factoring fees


41,126

2.3%

39,712

2.5%

32,758

2.3%

Other


(3,601)

(0.2%)

(1,720)

(0.1%)

(1,302)

(0.1%)

Net income from banking activities (factoring)

1.3.2

70,295

3.9%

64,400

4.1%

58,450

4.0%

Business information and other services


49,269

2.7%

42,266

2.7%

34,523

2.4%

Receivables management


6,202

0.3%

7,708

0.5%

9,469

0.7%

Turnover from information and other services

1.3.4

55,471

3.1%

49,974

3.2%

43,992

3.0%

Consolidated turnover

Note 22

1,811,851

100.0%

1,567,858

100.0%

1,450,864

100.0%

  • Policy management costs.
  • IPP commission – International policies commission; business contributors’ commission.

1.3.1 Credit insurance and related services

Key figures

For the financial year ended December 31, 2022, credit insurance products and related services generated turnover of €1,627 million, accounting for 89.8% of the Group’s consolidated turnover.

The following table shows the contribution of this business line to the Group’s consolidated turnover during the 2020-2022 period (in thousands of euros and as a percentage of the Group’s total).

Share of consolidated turnover

Credit insurance

(in thousands of euros and as a % of the Group total)

See also Section

Dec. 31, 2022

Dec. 31, 2021

Dec. 31, 2020

(in thousands of euros)

(as a %)

(in thousands of euros)

(as a %)

(in thousands of euros)

(as a %)

Gross earned premiums – Credit


1,444,175

79.7%

1,242,767

79.3%

1,132,876

78.1%

Gross earned premiums – Single Risk


24,480

1.4%

15,839

1.0%

21,141

1.5%

Gross earned premiums – Credit insurance


1,468,655

81.1%

1,258,606

80.3%

1,154,017

79.5%

Fee and commission income (1)


158,582

8.8%

140,691

9.9%

143,985

9.9%

Other related benefits and services (2)


39

0.0%

156

0.0%

102

0.0%

Turnover from credit insurance

Note 22

1,627,276

89.8%

1,399,453

89.3%

1,298,104

89.5%

  • Policy management costs.
  • IPP commission – International policies commission; business contributors’ commission.
Description

Credit insurance allows a creditor (the seller/supplier), with a term commercial debt held on its debtor (the buyer/client), to ask an insurer to cover the risk of non-payment of the trade receivable, in exchange for payment of a premium. It is one of the key hedging instruments for the trade receivables of companies that grant payment terms to their clients.

The following diagram illustrates the credit insurance mechanism.

COA2021_URD_EN_F036_HD.png

The service proposed by the Group to its policyholders entails much more than compensating the losses they sustain; it also includes preventing claims and providing assistance in developing a profitable and solvent clientele.

Preventing the risk of non-payment through credit insurance solutions requires collecting relevant, reliable and up-to-date information about debtors and their economic environment. Information held by the Group on debtor solvency is the basis for its credit insurance offerings. This information is used when making decisions on the coverage granted by its underwriters on a daily basis.

The Group grants complete or partial coverage, generally covering a portfolio of debtors (or a stream of business) of a given policyholder, as opposed to underwriting one insurance policy to cover a single debtor risk. Credit insurance policies are generally entered into for a period of one year with automatic renewal.

Within the context of these policies, the Group authorises each new debtor that is presented by the policyholder, and through the credit limit granted, establishes the maximum amount of risks it is prepared to accept for this debtor. It may reduce or cancel its credit insurance coverage at any time, sometimes subject to prior notice, for the future deliveries of goods or services by the policyholder to the debtor concerned, in order to reduce payment default risk. This reduction or cancellation allows the policyholder to be warned of if the Group’s concerns with regard to that debtor’s soundness increase.

In certain offers, the Group may give its policyholders some autonomy, depending on their expertise, in setting credit limits for outstanding receivables up to an amount provided for in their credit insurance policy.

In the event that a receivable is not paid by the debtor, the Group handles the recovery of unpaid receivables to limit the loss and release the policyholder from managing this dispute phase. As such, the policyholder preserves its commercial relations with its debtor as much as possible. The Group conducts negotiations and, if necessary, legal proceedings, to recover the amounts due.

By using credit insurance, companies secure their margins by insuring themselves against the financial impacts of an unpaid receivable, while benefiting from information tools regarding the solvency of their debtors and the collection of unpaid receivables. They also benefit from regular exchanges with the Group’s sector and country specialists.

Detailed offer

Present directly through subsidiaries or branches and covering a geographical area that accounts for nearly 97% of the world’s gross domestic product, the Group relies on its international network of local partners. Coface sells its credit insurance solutions and adjacent services in 100 countries, giving it critical mass and a geographical footprint spanning all continents. It is one of three global players in the credit insurance market.

The Group’s primary credit insurance products

The Group has refocused and enhanced its range of solutions to adapt to the specific needs of identified market segments: SMEs, mid-market companies, large international corporations, financial institutions, clients of distribution partners.

The Group offers numerous credit insurance solutions which are harmonised at a global level; the main ones are described below.

Product

Description

TradeLiner

This is a flexible offering addressing the specific requirements and needs of each policyholder with a range of options and adaptable general terms and conditions. It is currently the central solution in the Group’s product platform.

TradeLiner has replaced most local offerings as it has been rolled out in the various markets – this rollout it nearly complete – and as historical portfolios in all markets continue to migrate to this new solution.

EasyLiner

EasyLiner is a range of contracts intended for small and medium enterprises (SMEs), which are often unfamiliar with the mechanisms and benefits of credit insurance solutions. This offering can be distributed online, under a custom brand if necessary, in the context of commercial partnership agreements.

GlobaLiner

GlobaLiner is a policy sold by Coface Global Solutions (CGS), which was launched in 2022. It is dedicated to the management of major international policyholders. This offering is based on a global organisation. It offers multinationals services and management and oversight tools tailored to their specific requirements (geographic fragmentation, multi-currency risks, consolidation of aggregate client receivables, etc.). To round out this offer, the GlobaLiner contractual framework provides large international policyholders with standardised flexible management of their various policies around the world.

CofaNet and other online services

CofaNet is the central internet portal that enables Coface’s policyholders to manage their contracts. This multilingual portal is supplemented by a range of added-value services:

  • Coface Dashboard: a tool providing client risk analyses and reports;
  • CofaMove: a mobile app available on app stores, which includes the key features of CofaNet;
  • CofaServe: Coface’s API offer for policyholders, bringing credit insurance services to the heart of the client’s information system.

Medium term insurance (Single Risk)

The Single Risk offering provides coverage for commercial and political risks in connection with operations that are time-specific, complex, for a high amount (generally greater than €5 million) and for which the credit term is between 12 months and seven years. It gives policyholders the possibility to cover a risk linked to an investment or a particular market, as opposed to credit insurance products, which cover the risks of unpaid receivables on their entire turnover (whole turnover policies).

Pricing of credit insurance offers

The pricing of credit insurance is generally reflected in the premiums. Related services are generally subject to specific pricing depending on policyholders’ actual consumption of each service (number of clients monitored, number of debt collection files).

The Group considers the fair compensation of risk as an important issue. Accordingly, it has developed a pricing methodology within a proprietary computer tool (PEPS – past and expected profitability system) and associated commercial governance. The Group considers that it has a benchmark pricing methodology, including, for example, a risk-based analysis and cost-of-capital approach directly linked to the portfolio of insured risks and the capital allocated. Furthermore, adjustments and improvements are made routinely to ensure that the pricing methodology contributes to controlled and relevant underwriting in the various markets.

A separate methodology applied by a small team of experts is used for medium term Single Risk coverage, for which the default probabilities series are more limited.

Debtor solvency information at the centre of the Group’s business

The Group’s business essentially consists of the sale of insurance coverage or services relying on the acquisition and management of relevant, reliable and up-to-date information on debtors and their environment. The Group runs a network of 53 centres dedicated to collecting, processing and analysing financial and solvency information on all of the Group’s debtor risks worldwide.

Information is key to every stage of the Group’s risk monitoring process and is compiled within its ATLAS database (2). It is first collected, specifically from some 100 information providers, for initial administrative processing. It is then analysed by the team of 340 credit analysts for the purpose of evaluating debtors according to the debtor risk assessment (DRA) scale, which is used by the entire Group. The risk underwriters use the DRA to decide on the amount of risk to be underwritten for each policyholder. This analysis is also based on various tools and methods, including several decision-making engines, conventional invoicing tools and algorithms such as artificial intelligence.

Lastly, this information, which is collected, enhanced, analysed and used by the Group, is updated regularly to allow tracking of debtor risks. Moreover, all of the Group’s businesses rely on EASY, its debtor identification database, which facilitates communication between the Group and its partners and clients (3).

The following diagram illustrates the central place of information for the Group’s activities:

COA2021_URD_EN_F039_HD.png

The collection, use and preservation of reliable, updated and secure information constitutes a major issue for the Group, in order to:

  • guide its pricing policy and enhance the quality of its credit insurance offerings;
  • obtain, specifically at the local level due to its close proximity to the risk, microeconomic information on debtors and their economic environment, to support underwriting decisions under its risk management policy, while offering its policyholders a debtor risk-tracking solution;
  • facilitate its receivables management and debt collection activity.

This policy also allows the Group to obtain macroeconomic information, which is analysed by the Economic Research Department’s teams. These teams are distributed between head office and the Group’s various regions, to ensure local coverage. They conduct studies internally for the Group’s businesses, and externally for policyholders and the public (journalists, academics, prospective clients, banks, brokers, partners and so on). External production essentially takes the form of “panoramas” (country and sector risks, corporate defaults), which are published on its website (www.coface.com). Their purpose is to help businesses assess and prevent risks, and to make their decisions using the most relevant and recent information.

The following diagram illustrates the network of information on the Group’s businesses:

COA2021_URD_EN_F002_HD.png

Under the previous strategic plan, Fit to Win, the Group allocated substantial investments to business information in order to improve risk management by both enhancing its local presence and adopting new technologies (artificial intelligence).

A harmonised risk underwriting process

The Group has established a harmonised process for all of its risk underwriters in 45 countries to strengthen and support the management of risks attached to its various businesses. The risk underwriting decision is, by default, made by the risk underwriter of the debtor’s country, who is best placed to know the local economic environment. Where applicable, a second risk underwriter is able to adjust this initial decision upward or downward, because they are best qualified to determine the policyholder’s business or strategic position. This organisation allows for proximity with both the debtor and policyholder, including for major export transactions. In all, approximately 10,000 risk underwriting decisions are made each day.

Risk underwriting decisions relating to Single Risk coverage are made by a dedicated team within the Group’s Risk Underwriting Department.

To make their decisions, risk underwriters rely on the information collected, which is then subject to a summary internal analysis by the DRA (debtor risk assessment), the drafting and updating of which are carried out in line with debtor quality and the Group’s commitments. They also use the weighted assessment of portfolio (WAP), a concise indicator that measures a policyholder’s average debtor portfolio quality. Lastly, Coface has implemented detailed management of its risks, through 38 sectors and five different country risk levels (forming a matrix of 150 risk categories).

Risk underwriters:

  • work in real time and as a network, thanks to the ATLAS risk centralisation system, a risk underwriting and management IT tool used by all Group entities (4);
  • have no sales objective for the Group’s products and services, and their compensation is in no way linked to their commercial impact. This is to ensure an impartial application of the Group’s policies in terms of risk management;
  • have underwriting authorities of up to €10 million according to their expertise, seniority and skills. For coverage beyond €10 million, they are required to abide by a double-signature procedure for decisions up to €40 million at the regional level. Decisions relating to coverage greater than €40 million and particularly sensitive cases are validated by the Group Risk Underwriting Department.

The new generation of risk underwriting decision-making engines used since 2019 has increased the instant response rate to 66%. This increase in the proportion of coverage resulting from decision-making engines allows underwriters to:

  • free up more time for complex decisions,
  • manage the risk portfolio,
  • manage disruption in business cycles, such as the 2008-2009 crisis or the Covid-19 pandemic in 2020.
Structured commercial underwriting

Commercial underwriting involves determining pricing components (premium, bonus and penalty rates), technical parameters (maximum credit term, cash outflow limits) and the appropriate clauses to match a policyholder’s needs and risk profile. Commercial underwriting focuses on the contract, whilst risk underwriting deals with coverage of the buyers of the entity to be insured. The scope of coverage depends on the clauses applied. The two activities are therefore complementary. For this reason, the Group has a Commercial Underwriting Department that oversees commercial underwriting, risk underwriting, claims & collections and recovery.

Commercial underwriting is conducted at all levels of the Group (countries, regions and head office) in close collaboration with the risk underwriting teams.

This operational supervision complements the business lines, which together form the risk management system. It optimises the support provided to clients by ensuring we are more selective in the quality of debtors covered, that we verify the profitability of the underwritten businesses, and that technical expertise is better shared among the Group’s underwriting centres.

This business is governed by the Group’s rules, which allocate delegation levels on the basis of the seniority and experience of the employees concerned. Beyond certain risk levels and according to the nature of the request, decisions are taken at the Group’s headquarters, either by the Commercial Underwriting Department or by the Group Underwriting Committee.

The Group Underwriting Committee consists specifically of Group commercial underwriting, risk underwriting and commercial underwriting directors. This committee meets every day to review all commercial proposals for new business or policy renewals that exceed local delegations.

A multi-channel sales network strengthened by a large network of partners and business contributors

To market its credit insurance products and complementary services, the Group uses several distribution channels, the breakdown of which changes according to local markets. Specialised brokerage is largely dominant on the international scale, although in certain markets direct sales are historically more common.

The following diagram illustrates this multi-channel distribution model of the Group’s service offerings. The breakdown between direct and indirect sales is expressed as a share of total collected premiums.

COA2021_URD_EN_F040_HD.png

Fronters, who can also act as business contributors, are partner insurers who issue insurance policies on behalf of the Group in countries where it does not have a licence. With its network of partners, many of which are members of the Coface Partner network, the Group serves policyholders in some 40 countries in which it has no direct commercial presence or specific licence.

In terms of non-specialist contributors, banks are a key distribution channel, opening up new client bases, with better transformation rates for prospects.

1.3.2Factoring

Key figures

For the financial year ended December 31, 2022, factoring represented €70 million, or 3.9% of the Group’s consolidated turnover.

Share of consolidated turnover

Factoring

(in thousands of euros and as a % of the Group total)

See also Section

Dec. 31, 2022

Dec. 31, 2021

Dec. 31, 2020

(in thousands of euros)

(as a %)

(in thousands of euros)

(as a %)

(in thousands of euros)

(as a %)

Financing fees


32,769

1.8%

26,409

1.7%

26,995

1.9%

Factoring fees


41,126

2.3%

39,712

2.5%

32,758

2.3%

Other


(3,601)

(0.2%)

(1,720)

(0.1%)

(1,302)

(0.1%)

Net income from banking activities (factoring)

Note 22

70,295

3.9%

64,400

4.1%

58,450

4.0%

Description

Factoring is a financial technique whereby a factoring company (the factor) finances and, as applicable, manages the trade accounts of a company by acquiring its trade receivables. Depending on the type of factoring, in the event of an unpaid receivable, the loss may either remain at the expense of the factor, or it may be recovered from the company.

The Group’s factoring offering allows businesses to fund their trade receivables and optimise their liquidity:

  • by having immediate access to cash on the transfer of their receivables (subject to a security retention);
  • by reducing their client risk, in the absence of recourse (by transferring non-payment and debt collection risks);
  • by financing their growth without being held up by an increase in their working capital requirement.

The following diagram illustrates the factoring mechanism:

COA2021_URD_EN_F038_HD.png

Factoring mitigates the risks associated with the financing of trade receivables, thanks to the analysis performed on the chosen counterparties, the evaluation of their solvency, and the recovery mechanisms for unpaid receivables. The Group offers such factoring solutions in Germany and Poland.

The Group combines its factoring business with its credit insurance expertise to offer the following products:

  • factoring with recourse: a factoring product with recourse on the client in case of payment default;
  • full factoring without recourse: a product combining factoring services and credit insurance. In the event of a claim, the client is covered by credit insurance for its unpaid invoices;
  • in-house factoring with or without recourse: the client manages the relationship with its buyer, particularly in the case of a payment default, allowing it to preserve its business relationship;
  • reverse factoring: the Group’s client in this case is the buyer, who offers advance payment to its supplier through the factoring company;
  • maturity factoring: a service derived from full factoring for which financing only occurs at the invoice due date (late payment protection).
Detailed offer (5)

The Group is active in the German and Polish markets.

In Germany, the factoring market expanded in relation to 2021, with €309 billion in factoring receivables in 2022.

The German factoring market is dominated by five players, which, according to the Coface Group’s estimates, account for approximately 60% of the market: PB Factoring GmbH, Coface Finanz GmbH, BNP Paribas Factor GmbH, Targobank AG et Commerzfactoring (JV Commerzbank and Targobank).

In Poland, the factoring market was extremely dynamic, with growth of 35% in the first nine months of 2022. Coface Poland Factoring is the seventh largest provider with a market share of 7%.

The Polish factoring market is led by the following eight players, which share approximately 85% of the market (according to estimates by the Coface Group and the association of Polish factors): Pekao Faktoring, ING Commercial Finance, BNP Paribas Factoring, Santander Factoring, mFaktoring, Bank Millennium, Coface Poland Factoring and PKO Faktoring.

1.3.3Bonding

Key figures

For the financial year ended December 31, 2022, bonding generated turnover of €59 million, or 3.2% of the Group’s consolidated turnover, primarily in Italy.

Share of consolidated turnover

Bonding

(in thousands of euros and as a % of the Group total)

See also Section

Dec. 31, 2022

Dec. 31, 2021

Dec. 31, 2020

(in thousands of euros)

(as a %)

(in thousands of euros)

(as a %)

(in thousands of euros)

(as a %)

Gross earned premiums – BONDING

Note 22

58,809

3.2%

54,031

3.4%

50,317

3.5%

Description

As a complement to its main credit insurance activities, the Group draws on its debtor risk management capabilities to offer bonding solutions in some countries (mainly in France, Italy, Germany, Austria, Romania and Spain) to meet the specific needs of companies in certain markets.

Bonding consists of a commitment to pay the beneficiary of the bond in the event of a default or breach by the bondholder of its contractual obligations. The coverage provided by a surety bond allows a corporate bondholder to reassure its commercial or financial partners, in order to postpone immediate payment and/or to avoid reducing its borrowing abilities. For the bondholder, these are off-balance sheet commitments. Furthermore, in certain sectors, a surety bond is needed to run a business or access specific markets.

The surety bonds issued by the Group have a fixed term (from a few weeks to a maximum of five years) and the associated risks can be shared among several market players (generally banks and insurers).

The Group selectively offers a range of specific surety bonds to help businesses obtain domestic or export contracts:

  • contract surety bonds:
    • tender bonds (a guarantee for the buyer that a supplier taking part in a call for tenders will be able to offer the services announced in its response, if it wins the contract),
    • performance bonds (a guarantee for the buyer that the seller will execute the contract),
    • advance payment bonds (a commitment to return the advance paid by the buyer in the event that the seller does not pursue the contract),
    • holdback bond (a guarantee covering any faults occurring during the warranty period),
    • subcontracting bonds (to guarantee the payment of any subcontractors the company employs);
  • customs and excise bonds: allow bearers to benefit from customs duties credits or even, in some markets, to cover amounts payable as indirect contributions or excise taxes, or to postpone the payment thereof;
  • environmental surety bonds: cover expenses linked to monitoring a site, keeping a facility safe, any interventions in the event of accidents or pollution and the restoration of the site after the activity is discontinued;
  • legal bonds for temporary employment companies: to cover the wages and social security contributions of temporary employees, in case the business becomes insolvent;
  • payment guarantees: covering the amounts owed by the bondholder as payment for its purchases and services rendered by a beneficiary.
Detailed offer

The global surety bond market is largely dependent on the regulatory framework of the various countries. It is therefore fragmented into national markets. Indeed, the local legal context determines the characteristics of the product as well as the requirements in terms of a mandatory surety bond, which makes it difficult to determine the scope of this market. In addition, the practice of certain business sectors or certain types of operations may also influence this market.

The Group estimates that this market represents between €10 billion and €15 billion in turnover, or more than the credit insurance market. Although this market largely dominated by banks, insurers rank second, with approximately €6 billion in turnover, mainly because they cannot access some national markets for regulatory reasons. This is the case in India and several countries in the Middle East and North Africa. According to the Coface Group’s estimates, the world’s largest market, the United States, accounts for approximately half of the global surety bond market. In Europe, Italy is by far the leading market, and in Asia, South Korea has the highest percentage of turnover from surety bonds issued.

1.3.4Business information and other services

Key figures

As of December 31, 2022, this business line generated consolidated turnover of €55 million.

Share of consolidated turnover

Business information and other services

(in thousands of euros and as a % of the Group total)

See also Section

Dec. 31, 2022

Dec. 31, 2021

Dec. 31, 2020

(in thousands of euros)

(as a %)

(in thousands of euros)

(as a %)

(in thousands of euros)

(as a %)

Business information and other services


49,269

2.7%

42,266

2.7%

34,523

2.4%

Receivables management


6,202

0.3%

7,708

0.5%

9,469

0.7%

Turnover from information and other services

Note 22

55,471

3.1%

49,974

3.2%

43,992

3.0%

Description

Coface has a unique high added value database. This database draws on its recognised expertise in credit risk, including its analysis of companies’ financial statements and in-depth knowledge of their payment behaviour, its economic research and forecasting models, and its use of data science to exploit the wealth of its data. Coface’s teams use this infrastructure to make more than 10,000 credit decisions on a daily basis, helping its policyholders choose their business partners.

Thanks to the quality of its information, its global network, and its expertise in transforming raw data into value-added data, the Group is in a strong position to offer business information services. This activity, which has strong synergies with its core business line in credit insurance, has a digitalised business model and is based on partnerships. Coface has proven expertise in this area and is one of the leaders in business information in several countries (Israel, Poland, Romania).

The need for information in managing business relationships with customers or suppliers has intensified in recent years. Information is vital to anticipate the risks of non-payment by companies. Coface naturally meets a number of these needs with its trade credit insurance business, by offering access to:

  • standard, global information, available fast;
  • micro information (on a company’s financial health) and macro information (sector information, country risk, etc.);
  • high quality, constantly updated information;
  • risk expertise that transforms information into decision-making.

This access is now available through Coface’s information offering, which draws on its credit insurance strengths and processes.

COA2022_URD_EN_G040_HD.png

It provides companies and financial institutions with a comprehensive sales decision support service, to meet three main needs:

  • reporting: descriptive data (information reports, alerts, risk management dashboard, etc.);
  • scoring: predictive data (scoring, buyer risk assessment, etc.);
  • decision-making: bespoke data for decision-making (simple or advanced credit opinions, etc.).

The objective is to enable companies and financial institutions to manage their risk strategy more effectively as part of their business activity.

Detailed offer

The launch of the platform called ICON, developed by Coface under the new Build to Lead strategic plan, offers an innovative, digital, global solution for business information services.

ICON is accessible all over the world, 24 hours a day, 7 days a week, via the internet or through enhanced connectivity with client information systems via APIs.

A full range of services with easy-to-read indicators, adapted to the needs of businesses, is provided:

URBA

URBA (Universal Risk Business Assessment) incorporates all the products described below to give a 360° view of a company’s situation. It has been launched gradually in the different regions since the end of 2022. Customers can access all URBA information and analyses via APIs or through a dynamic user interface. URBA contains portfolio management and corporate risk monitoring options.

Full Report

To obtain complete information about a company and carry out an in-depth risk analysis, the Full Report provides detailed financial data, a credit score, a recommended maximum credit amount and our assessment of the company on an eleven-point scale (from “Insolvency procedure/bankruptcy” to “Excellent risk”), the DRA, based on Coface’s experience as a credit insurer.

Comprehensive reports are available in nearly 200 countries. A monitoring service is available to provide notifications when there are changes to one of the indicators identified as being key to tracking a company’s risk (financial data, ownership, credit rating, etc.)

Snapshot Report

If an in-depth analysis such as the one available in the Full Report is not necessary, Coface offers an instant report that provides a summary of the key aspects needed to assess business partners, with fewer details. This report includes a quick rating (“Low”, “Medium” or “High”), Coface’s assessment and a maximum recommended credit limit.

Monitoring is also available for these reports: notifications are sent in the event of changes in a company’s solvency, late payments, etc.

Debtor risk assessment (DRA)

With the debtor risk assessment, Coface determines a company’s ability to meet its short term financial commitments. The DRA is produced using information available in the Group’s single high added value database, on a scale of 0 to 10 (from “Insolvency/bankruptcy procedure” to “Excellent risk”). The DRA is used on a daily basis to monitor the Group’s own credit insurance portfolio. A company’s DRA takes into account its past assessments and its current default probability. Monitoring is also available on request.

Credit Opinions

Credit Opinions provide a recommended credit limit for a company. This is an effective way to assess the solvency of debtors, prospects, and any company with which the client is considering doing business. The Credit Opinion report includes the DRA and country risk assessment, thereby providing a holistic approach to a company’s risk profile.

Two products based on credit opinions are available to meet various business needs:

  • @Credit Opinion expressed as an index, for small business portfolios or high turnover portfolios, covering exposures up to €100,000;
  • Advanced Opinion, a specific recommended exposure amount.

Other products are also available:

Portfolio Insights and Selectio

Portfolio Insights and Selectio are interactive portfolio management tools that provide the client with in-depth information on the risk presented by all its trading partners (debtors, buyers, customers, etc.) wherever they are in the world, cross-referenced with Coface’s expert macroeconomic assessments. Selectio is currently only available in Italy.

Economic Insights

Coface also provides its expertise in economic assessment to help its clients make the right strategic and operational decisions by anticipating the various risks affecting economies and sectors at the global level thanks to Economic Insights. This interactive platform enables risk monitoring in more than 160 countries and the main business sectors.

(1)
Companies with at least one active contract with Coface in our various business lines.
(2)
See Section 1.7.2 “Group applications and tools”.
(3)
See Section 1.7.2 “Group applications and tools”.
(4)
See Section 1.8.2 “Group applications and tools”.
(5)
Sources: (i) Factoring-Markt 2021: Trotz oder mit Corona starkes Wachstum | Deutscher Factoring Verband e.V.; (ii) Annual Factoring Data | Data & Statistics (euf.eu.com); (iii) http://www.faktoring.pl/eng/
(6)
Headcount figures cover employees on permanent or fixed term contracts, excluding those who had permanently left the Company.
(7)
Comments on regional results can be found in Section 3.3 “Comments on the results as at December 31, 2022”

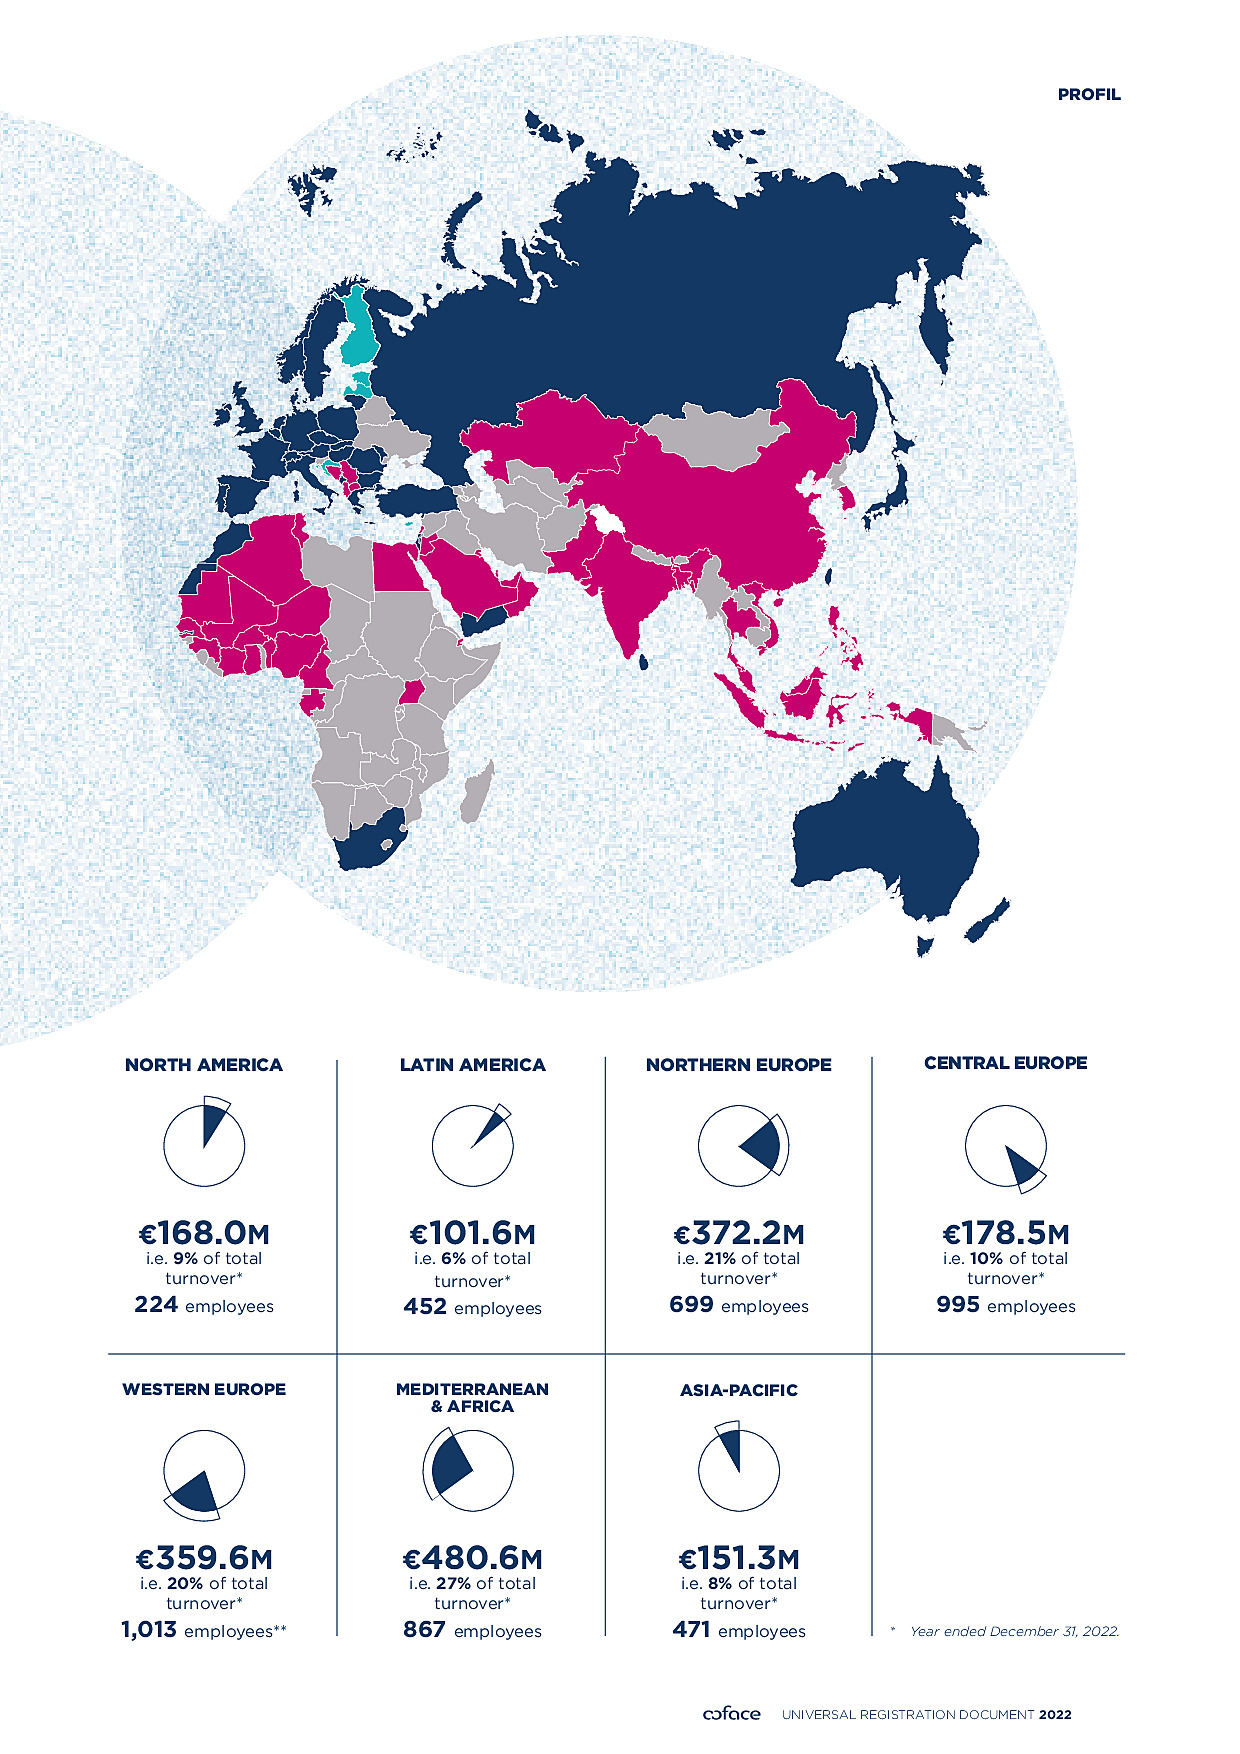
1.4Positioning of the Coface Group region by region

Thanks to its leading international presence, the Group organises its business lines around seven geographic regions in which it sells its products: 

  • Western Europe, 
  • Northern Europe, 
  • Central Europe, 
  • Mediterranean & Africa, 
  • North America, 
  • Latin America
  • Asia-Pacific 
Group activities in the Western Europe region
/Availability of the Group’s offering
COA2022_URD_EN_G024_HD.png
Key figures

The Group, which currently employs approximately 1,013 people in the Western Europe region, generated turnover of €359.6 million in this region, accounting for 19.8% of its total turnover for the financial year ended December 31, 2022.

Classification of countries and offering

The Group’s activities in Western Europe are heavily oriented towards the sale of credit insurance policies. However, there are also certain local features, for example in France, where the Group also sells surety bonds and Single Risk policies. All countries in this region have significantly strengthened their information offering in line with the Build to Lead strategic plan.

Western European countries are mature credit insurance markets. The offering is mainly distributed via specialised credit insurance brokers. Large brokers use their own international distribution network or third-party distribution partners, particularly for international programmes. In France, Coface rounds out its distribution network with direct sales teams across France and is diversifying its multi-channel sales approach by developing partnerships with banks.

Marketing and strategy

In 2022, the region continued to develop its information offering. It also continued to improve the client experience in Credit Insurance.

Group activities in the Northern Europe region
/Availability of the Group’s offering
COA2022_URD_EN_G025_HD.png
Key figures

The Group, which currently employs approximately 699 people in the Northern Europe region, generated turnover of €372.2 million in this region, accounting for 20.5% of its total turnover for the financial year ended December 31, 2022.

Classification of countries and offering

The countries where the Group operates in this region are mature credit insurance markets. There is strong pricing pressure due to intense competition and the low company insolvency rate. However, payment defaults have begun to rise since Q3 2022. The effects of the pandemic led to a sharp rebound in client activity in 2022. Activity was also driven by inflation, which underpinned underlying insured turnover growth and hence premium growth. The Group mainly sells credit insurance services and related credit management solutions such as information services, Single Risk coverage and debt collection. In Germany, it also offers factoring and surety bonds.

Marketing and strategy

The Group’s offering in this region is marketed through a combination of direct sales by its own sales teams and sales through its partners (brokers and banks).

The Group continues to invest in this region, with a focus on profitable growth. In Germany, Northern Europe’s primary market, the core services were enhanced to best meet client needs, including a credit insurance offering tailored to partner banks. In 2022, a strong focus was placed on the development of the business information offering, which recorded strong growth, particularly in the large key accounts segment. The factoring strategy to provide financing solutions for M&A and cross-border transactions continues to confirm its effectiveness.

The creation of the “Nordics” platform strengthened the Group’s presence in the region while promoting its growth in the Nordic markets. While the mainstays were Denmark and Sweden until 2019, the acquisition of Norwegian credit insurer GIEK Kredittforsikring in 2020 – now part of the Group – significantly expanded Coface’s footprint in the region. In summer 2022, the launch of the Group’s flagship credit insurance product “TradeLiner” marked a major and final step towards the integration of the Norwegian branch into the Group. There is also considerable growth potential in Finland with the recruitment of new talent to strengthen the local teams.

Although historically characterised by a broker-centred distribution model, the Group is successfully pursuing its multi-distribution business model in the Dutch market. The new information offering which has been rolled out has also enhanced the range of services offered to clients. In addition, the launch of factoring services in 2022 strengthens the Group’s presence on the Dutch market. Marketing activities have been ramped up to make the brand more visible across the Netherlands.

Group activities in the Central and Eastern Europe region
/Availability of the Group’s offering
COA2022_URD_EN_G026_HD.png
Key figures

The Group, which currently employs approximately 995 people in the Central Europe region, generated turnover of €178.5 million in this region (with the biggest contributions coming from Austria, Poland, Romania and Russia), accounting for 9.9% of its total turnover for the financial year ended December 31, 2022.

Classification of countries and offering

In this region, the Group is the only supplier of integrated credit management solutions comprising credit insurance, business information and debt collection services for both insured and uninsured businesses. It offers factoring solutions in Poland, and, since 2022, surety bonds in Romania.

GDP growth rates in 2022 were solid, mainly driven by good first-half results. The war in Ukraine has since impacted the region’s economies with rising energy and food prices and supply chain disruptions. Inflation reached double digits, limiting households’ propensity to spend, while investment was limited by soaring financing costs. These developments are fuelling fears of recession and are maintaining inflationary pressure.

Marketing and strategy

The Group has the most extensive network in Central and Eastern Europe and the largest local footprint, offering services in 18 countries, directly or indirectly.

The Group’s strategy in this region is built on the cornerstone of supporting the development of distribution, and growing while keeping risks under control.

As these emerging markets are stable in terms of credit insurance, the Group’s strategy is to achieve sound growth while controlling risk. The strategy also involves diversifying the service offering, mainly through the systematic cross-selling of information services to policyholders. The Group successfully integrated PKZ, a company acquired in 2019, which was successfully transformed into the Group’s Slovenian branch in autumn 2022. With this strategic acquisition, the Group strengthened its position on the Adriatic market, and clients now benefit from the full strength of the Group.

Group activities in the Mediterranean & Africa region
/Availability of the Group’s offering
COA2022_URD_EN_G027_HD.png
Key figures

The Group, which currently employs approximately 867 people in the Mediterranean and Africa region, generated turnover of €480.6 million in this region, accounting for 26.5% of its total turnover for the financial year ended December 31, 2022.

Classification of countries and offering

The Group sells credit insurance policies and surety bonds, as well as information and debt collection services.

In terms of credit insurance, this region has both emerging and mature markets (Italy, Greece, Spain and Portugal). The Group has unique geographic coverage in the credit insurance market in the region. It is directly present in eight countries and in a position to operate its business in Middle Eastern and African countries through partnerships with top-tier insurers. It applies its strategy through regional centres in Casablanca, Dubai, Madrid, Milan, Istanbul, Tel Aviv and Johannesburg tasked with coordinating the management of its establishments and partner networks. In Italy, Coface is a benchmark in the surety bond market.

In 2022, the Trade Information Offering experienced strong and promising growth in Italy and achieved encouraging results in Spain. In Israel, Coface BDI is the undisputed leader in the information market.

Marketing and strategy

According to the size and the configuration of markets in the region, the Group combines (i) sales through insurance intermediaries (brokers, agents) or partnerships with banks and (ii) direct sales. The relative contribution of the different channels varies significantly according to the specific characteristics of the market. While agents have a wide reach in Italy and Spain, brokers play a major role in Portugal, Turkey, the Gulf States, Saudi Arabia, and South Africa, and Israel and Morocco rely more on direct sales. In West African countries, the Group promotes credit insurance through partners (insurers, banks), to whom it supplies credit insurance contracts and back office services. The Group has competent qualified teams in Dubai and the Western and Central Africa region to establish agreements with local fronters and provide solutions in countries such as Senegal, Tunisia, Côte d’Ivoire, the Gulf countries and Saudi Arabia. Partnerships with banks were increasingly important in most countries in 2022.

In the three mature credit insurance markets of Italy, Spain and Portugal, the Group reported further substantial production and an exceptionally high level of client loyalty, while gradually adapting its premium rates and underwriting to the actual risk situation. This performance is the result of a sales strategy with a multi-channel distribution approach and efficient customer segmentation.

Group activities in the North America region
/Availability of the Group’s offering
COA2022_URD_EN_G022_HD.png
Key figures

The Group, which currently employs approximately 224 people in the North America region, generated turnover of €168.0 million in this region, accounting for 9.3% of its total turnover for the financial year ended December 31, 2022.

Classification of countries and offering

The Group directly issues credit insurance policies in the United States and in Canada, two markets that are under-penetrated in terms of credit insurance due to low product awareness. It mainly sells credit insurance services, as well as information and debt collection services. The Group also offers Single Risk coverage on a limited scale.

Marketing and strategy

The Group has completed the reorganisation of its distribution channels with a focus on being close to its clients. The process of bringing the sales teams in-house in order to improve sales efficiency is now complete. The Broker Connect team has established strong relationships with the main brokers. In the same vein, the Coface Global Solutions team serving large multinationals was strengthened.

The Group expanded its offering by launching credit insurance solutions including non-cancellable credit limits. This strengthens the Group’s competitive position in the key accounts segment and allows it to fully cover the needs of its international broker partners.

To improve customer proximity, the Group has reorganised its distribution channels for credit insurance and expanded its offerings with solutions including non-cancellable credit limits and hybrid services. It has also adopted new standards to simplify operations, ensure internal efficiency and improve service quality and the customer experience.

The Group is also continuing to expand its business information offering.

Group activities in the Latin America region
/Availability of the Group’s offering
COA2022_URD_EN_G023_HD.png
Key figures

The Group, which currently employs approximately 452 people in the Latin America region, generated turnover of €101.6 million in this region, accounting for 5.6% of its total turnover for the financial year ended December 31, 2022.

Classification of countries and offering

The portfolio of products sold by the Group in the region essentially consists of credit insurance policies, but also includes debtor information and debt collection services.

Latin American GDP slowed in 2022 after a strong rebound in 2021. Inflation continued to accelerate throughout 2022, leading central banks to raise their key rates further. In contrast, activity in the region benefited from higher commodity prices.

In terms of credit insurance, countries in this region are considered high-risk markets with volatile economies. Credit insurance policies are sold directly in a dozen countries, the main ones of which are Argentina, Brazil, Chile, Colombia, Ecuador, and Mexico, and in other countries where policies are signed by partners.

The Group has dedicated enhanced information management teams in Argentina, Brazil, Chile, Colombia, Ecuador, Mexico and Peru (where one of the Group’s three shared information management service centres is located – see Section 1.3.1. “Credit insurance and related services”).

Marketing and strategy

Given the classification of this region’s countries, the Group’s strategy entails supporting the development of sales and growth by managing risks and focusing on developing the most profitable segments in specific countries.

The sales approach is based on targeted prospecting, by market and sector, with pricing and conditions adjusted to real risk profiles.

The Group’s offer in this region is marketed by a combination of direct sales by its own sales teams and sales via its partners. In 2022, the region continued to develop its business information offering and focused on improving the customer experience in Credit Insurance. The strategy also consisted of diversifying the range of services, particularly through new information products for companies and the systematic cross-selling of information services to policyholders.

Group activities in the Asia-Pacific region
/Availability of the Group’s offering
COA2022_URD_EN_G028_HD.png
Key figures

The Group, which currently employs approximately 452 people in the Asia-Pacific region, generated turnover of €151.3 million in this region, accounting for 8.3% of its total turnover for the financial year ended December 31, 2022.

Classification of countries and offering

The Group has a direct presence in 14 markets: Australia, China, Hong Kong SAR, India, Indonesia, Japan, Malaysia, New Zealand, the Philippines, Singapore, South Korea, Taiwan, Thailand and Vietnam.

In terms of credit insurance, most countries in the region have high risk profiles – with the exception of Japan, South Korea, Singapore and Australia, which are economically mature markets.

The region offers business information and debt collection services. It also boasts a service centre in India which is used by the region and the Group for various back office and middle office services, including the processing of debtor information, the production of information reports and support for sales, IT and finance operations (see Section 1.3.1 “Credit insurance and related services”).

Marketing and strategy

In Asia-Pacific, the Group distributes its products directly and through partnerships with insurers (fronters). The Group has branches with direct insurance licenses in Australia, Hong Kong SAR, Japan, New Zealand, Singapore and Taiwan, and has the largest partner network in the region, with 32 partners. Lastly, consistent with the Group’s multi-channel strategy, the region has its own direct sales teams and also uses specialised brokers and banking partners to sell its offering.

The Group also has two specialist teams in the region – ‘Japanese Solutions’ and ‘China Desk’ – which provide international Japanese and Chinese companies with a single point of access to its services. In 2022, the Group also strengthened its organisation around the business information offering for non-insured segments.

1.5Group strategy

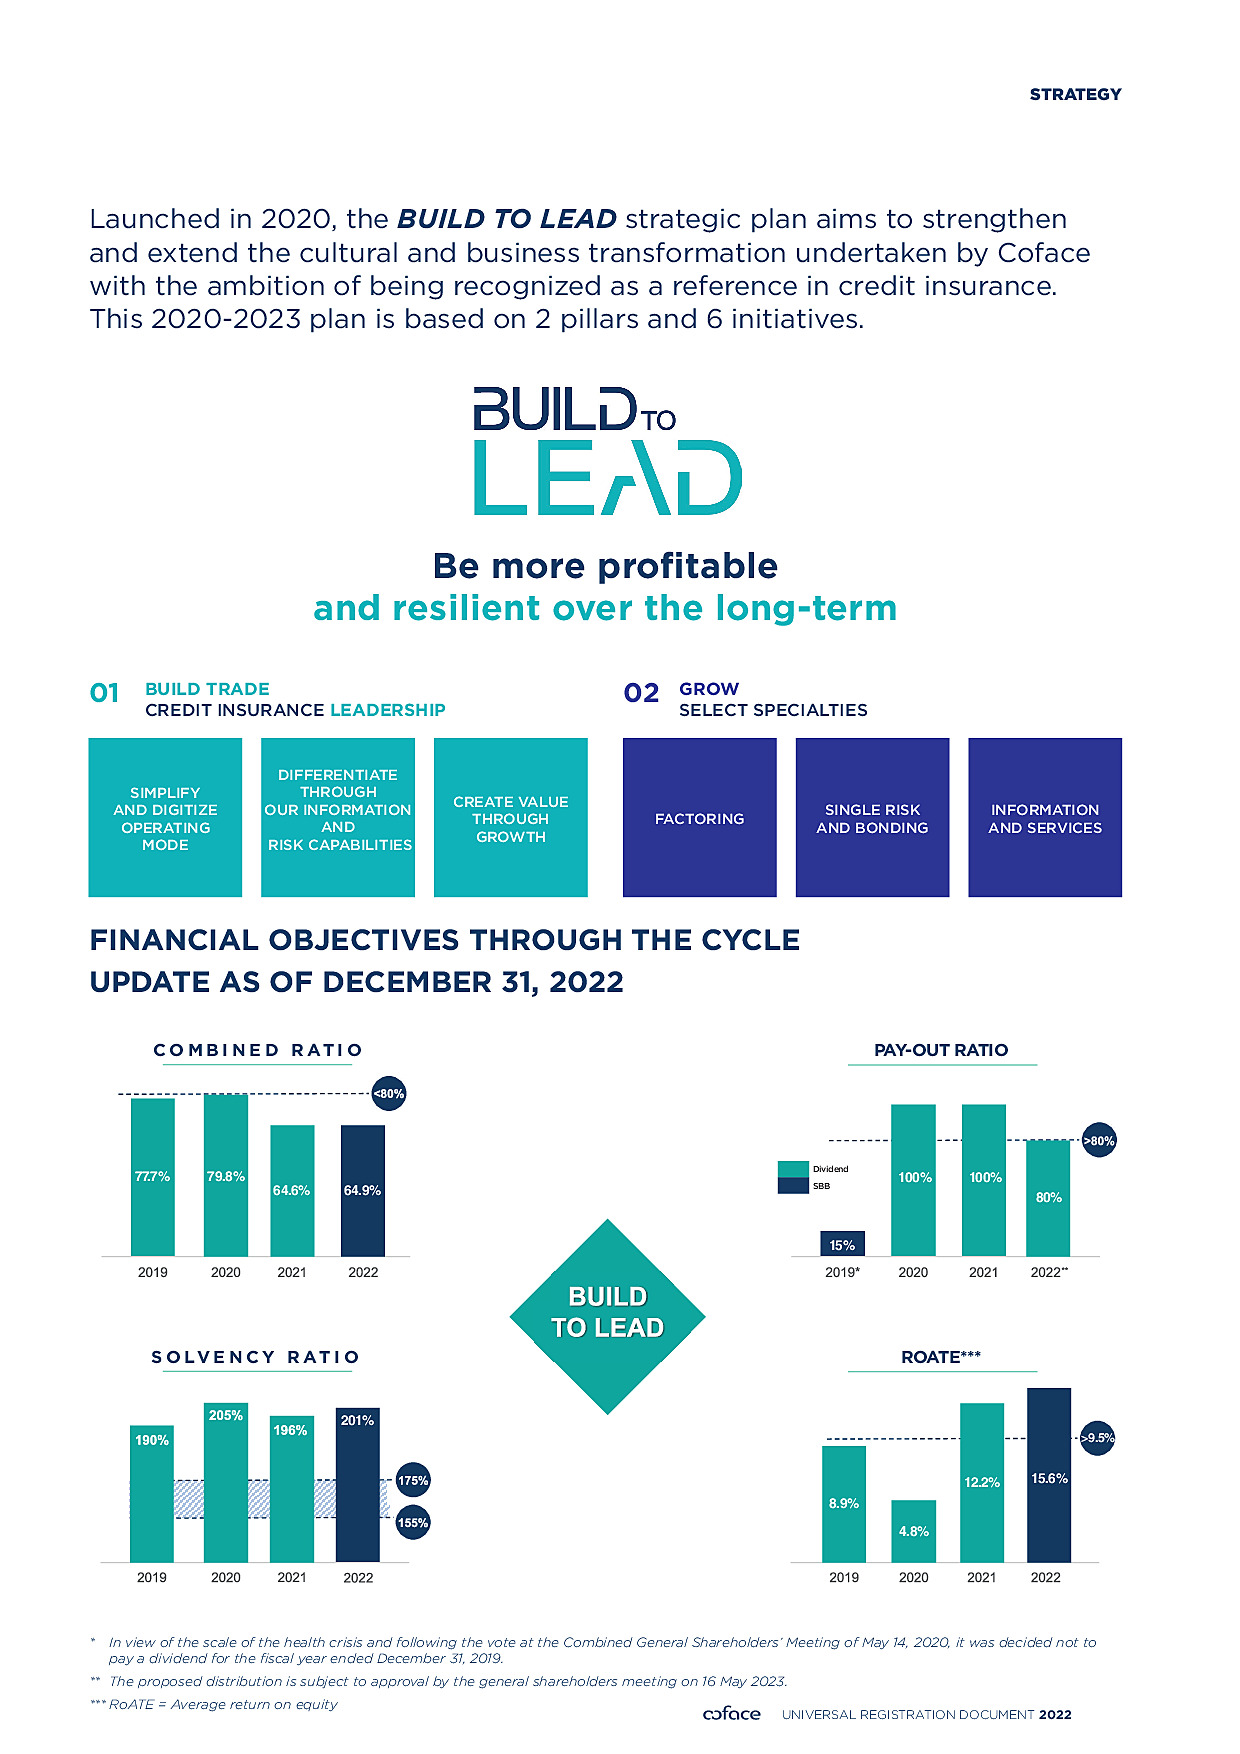
The Build to Lead – 2023 strategic plan launched in 2020 consolidated the successes of the Fit to Win plan by reinforcing Coface’s expertise, synergies and agility. It aims to assert Coface’s leadership in credit insurance by placing the client at the centre of the Coface strategy, while creating growth opportunities in adjacent activities offering significant synergies.

The Covid-19 health crisis and the resulting economic disruption confirm the importance of the ambitions of resilience, responsiveness in client service, and agility that are set out in the Build to Lead plan. These ambitions are upheld, while the priorities have been adjusted to take account of changes in the economic environment.

1.5.1Ambitions and objectives of the Build to Lead strategic plan

The Build to Lead strategic plan aims to create the conditions for profitable and resilient long term growth for Coface. To do this, it relies on two guiding principles:

  • strengthening the Group’s leadership in the credit insurance market by placing its clients and partners at the heart of its strategy; and
  • creating growth opportunities, in particular by developing adjacent activities that complement Coface’s long-standing credit insurance business, for example information services, surety bonds, Single Risk coverage and factoring;

The Group will also continue to manage its capital more effectively so it can secure the resources needed to finance its growth.

As part of this plan, the Group is committed to four objectives throughout the cycle:

  • return on average tangible equity (RoATE) of 9.5%;
  • a combined ratio of 80%;
  • a solvency ratio between 155% and 175%;
  • a dividend payout target of at least 80% of net income.

1.5.2Strengthening Coface’s leadership in credit insurance

For Coface, being a leader is not a matter of size but of being the best in its field:

  • in anticipating and managing risk;
  • in providing effective solutions for its clients, meeting their needs as closely as possible.

This ambition has three priorities:

Continue to improve, simplify and digitalise the operating model

The Group is continuing to improve its operating model. This frees up time and energy to better meet client requirements, to stand apart for the quality of its service and to indirectly reduce its costs.

Improving quality of service and exceeding our clients’ expectations

The Group is implementing service quality programmes to put the client at the centre of its actions. It is instilling a client-oriented mindset and practices drawing on exemplary executives and managers, training and incentives.

Simplifying products, operating processes and IT infrastructure

With its X-Liner product range (GlobaLiner, TradeLiner, EasyLiner and TopLiner), Coface offers simple, standardised and scalable solutions. Similarly, the Group is continuing to simplify and modernise its IT infrastructure and practices to improve efficiency and agility. It intends to improve its connectivity with its clients by developing application programming interfaces (APIs).

Putting innovation at the heart of our operations

Coface continues to innovate and is investing in data and technology to manage its risks, boost sales and improve operational efficiency.

Stand apart with its expertise in risk management and business information
Investing in risk management and information

This will increase the Group’s resilience and reduce risk volatility. This expertise lies at the heart of Coface’s value proposition and is a differentiating factor on the market.

Exploring the opportunities offered by new technologies

The digital revolution is significantly increasing the available sources of information and processing capacities. The Group is actively exploring the opportunities offered by new technologies to build sustainable leadership.

Aligning risk management and profitability through the partial internal model

Rolled out in 2021, the partial internal model enables:

  • a dynamic allocation of capital based on anticipated losses for each exposure;
  • better matching of the prices of our coverage with the corresponding risks thanks to more detailed risk management.
Create value through profitable growth

Coface wants to continue to achieve profitable growth by differentiating its approach by region and by client segment.

Tailoring the approach to specific markets

In “mature” markets where credit insurance has a high penetration rate and competition is intense, Coface invests in:

  • maximising client retention;
  • improving the operational efficiency of its sales forces; and
  • coordinating its network of distribution partners.

In developed but ‘under-penetrated’ economies in terms of credit insurance, such as the United States or Japan, Coface aims to increase opportunities for contact with clients and prospects by adapting its offering and extending its distribution to different market segments.

In ‘volatile risk’ markets, the Group establishes a long term presence so it can seize profitable growth opportunities. To do this, Coface is reinforcing its knowledge of the local economic fabric, developing its local underwriting expertise and building long term relationships with local partners.

Segmenting the offering and marketing by type of client:

Coface adjusts its offer to the type of client:

  • key accounts (CGS);
  • mid-market customers;
  • SMEs; and
  • financial institutions.

The GlobaLiner offering for international groups provides standardised and scalable management of various policies around the world.

The TradeLiner offer for mid-market customers offers a standardised and scalable structure that meets the specific characteristics of different markets.

The EasyLiner offer for the SME segment includes easy-to-use digital client journeys and can be sold by partners, particularly banks.

The financial institutions segment is expanding particularly strongly, backed by dedicated sales and underwriting teams. Coface is expanding in this segment by strengthening relations with target financial institutions.

Strategic partnerships and external growth

Coface’s global network is a major asset both in terms of risk management and in serving its clients abroad. Coface has continued its geographical expansion by stepping up its direct presence through acquisitions (Slovenia, Norway) and via partners.

The Group continues to seek out and develop strategic partnerships that allow it to diversify its client portfolio and strengthen its presence in regions where it sees growth potential and where it does not hold an operating licence.

1.5.3Developing specialised adjacent activities that complement trade credit insurance

Coface wants to expand in adjacent activities that offer synergies with its trade credit insurance business and in which the Group has solid experience. This strategy aims to build up a portfolio of growth opportunities besides credit insurance and to diversify its risks. Coface has set aside capacity to finance this growth, possibly through external acquisitions.

Develop services, particularly through information services

Coface wants to draw on its strengths to develop a range of services offering synergies with credit insurance and with low capital requirements, in particular information about companies.

To do this, Coface intends to leverage the significant amount of data generated by its credit insurance business. Its constantly updated real time database covering 200 countries (600 people dedicated to collecting and entering data from external and internal sources) and its solid experience in data analysis and processing form the foundation of the Group’s information services. Coface is investing in a comprehensive platform including access to data, a range of products focused on credit risk in the broad sense, systems for processing and delivering the offering, and dedicated sales teams. It is managing this expansion internally on high potential markets but does not rule out targeted acquisitions or partnerships.

Finalise the recovery of factoring

The Group offers factoring solutions in Germany and Poland. Coface has begun to restore growth to its business by expanding in high-potential and high-yield niches (particularly in international factoring and among investment funds).

Grow our surety bond, Single Risk and debt collection activities

Coface has established a client base in surety bonds and Single Risk coverage by leveraging its underwriting expertise and distribution capabilities. The Group plans to develop these activities in existing regions and enter new markets where it has existing strengths. A Group-wide department was created to accelerate growth and boost profitability. In addition, Coface continues to deploy its third-party debt collection business. To do this, it draws on its near global debt collection capabilities and its expertise in credit insurance.

1.5.4A dynamic capital management model

The Group is constantly upgrading its business model to manage its capital more efficiently. Achieving an appropriate return on capital is a factor of long term competitiveness and a major driver of value creation for shareholders. The Solvency II prudential framework reinforces this focus on both regulatory and economic capital.

The Group’s capital management policy meets two main objectives: maintaining the financial solidity provided to clients and financing its profitable growth. These targets are measured by its robust solvency ratio and a recurrent financial rating of at least A from the rating agencies.

At the same time, the Group has demonstrated its ability to use instruments that make its balance sheet more efficient (subordinated debt, share buyback programme). It also pursues an active strategy in terms of available reinsurance options.

Based on the partial internal model and stress tests performed during the own risk and solvency assessment (ORSA), the Group has established a comfort scale that was approved by the Board of Directors under the Build to Lead strategic plan. It aims to maintain a solvency ratio above 100% in the event of a crisis equivalent to that of 2008-2009, and takes into account the flexibility needed for its growth requirements.

A target coverage level of 165% with a comfort zone of between 155% and 175% is compatible with these targets over the period of the strategic plan.

The following chart shows the action plan to be implemented depending on where the Group’s solvency ratio is positioned.

COA2021_URD_EN_F037_HD.png

Coface has also announced a policy of paying a dividend equal to or higher than 80% of net income, provided that its solvency remains in the target zone.

Coface was able to demonstrate its agility and resilience throughout 2022 in an uncertain economic environment. Strengthened by its corporate culture and a solid balance sheet, Coface is confidently continuing with the execution of its Build to Lead strategic plan, which is more relevant than ever.

1.6Group organisation

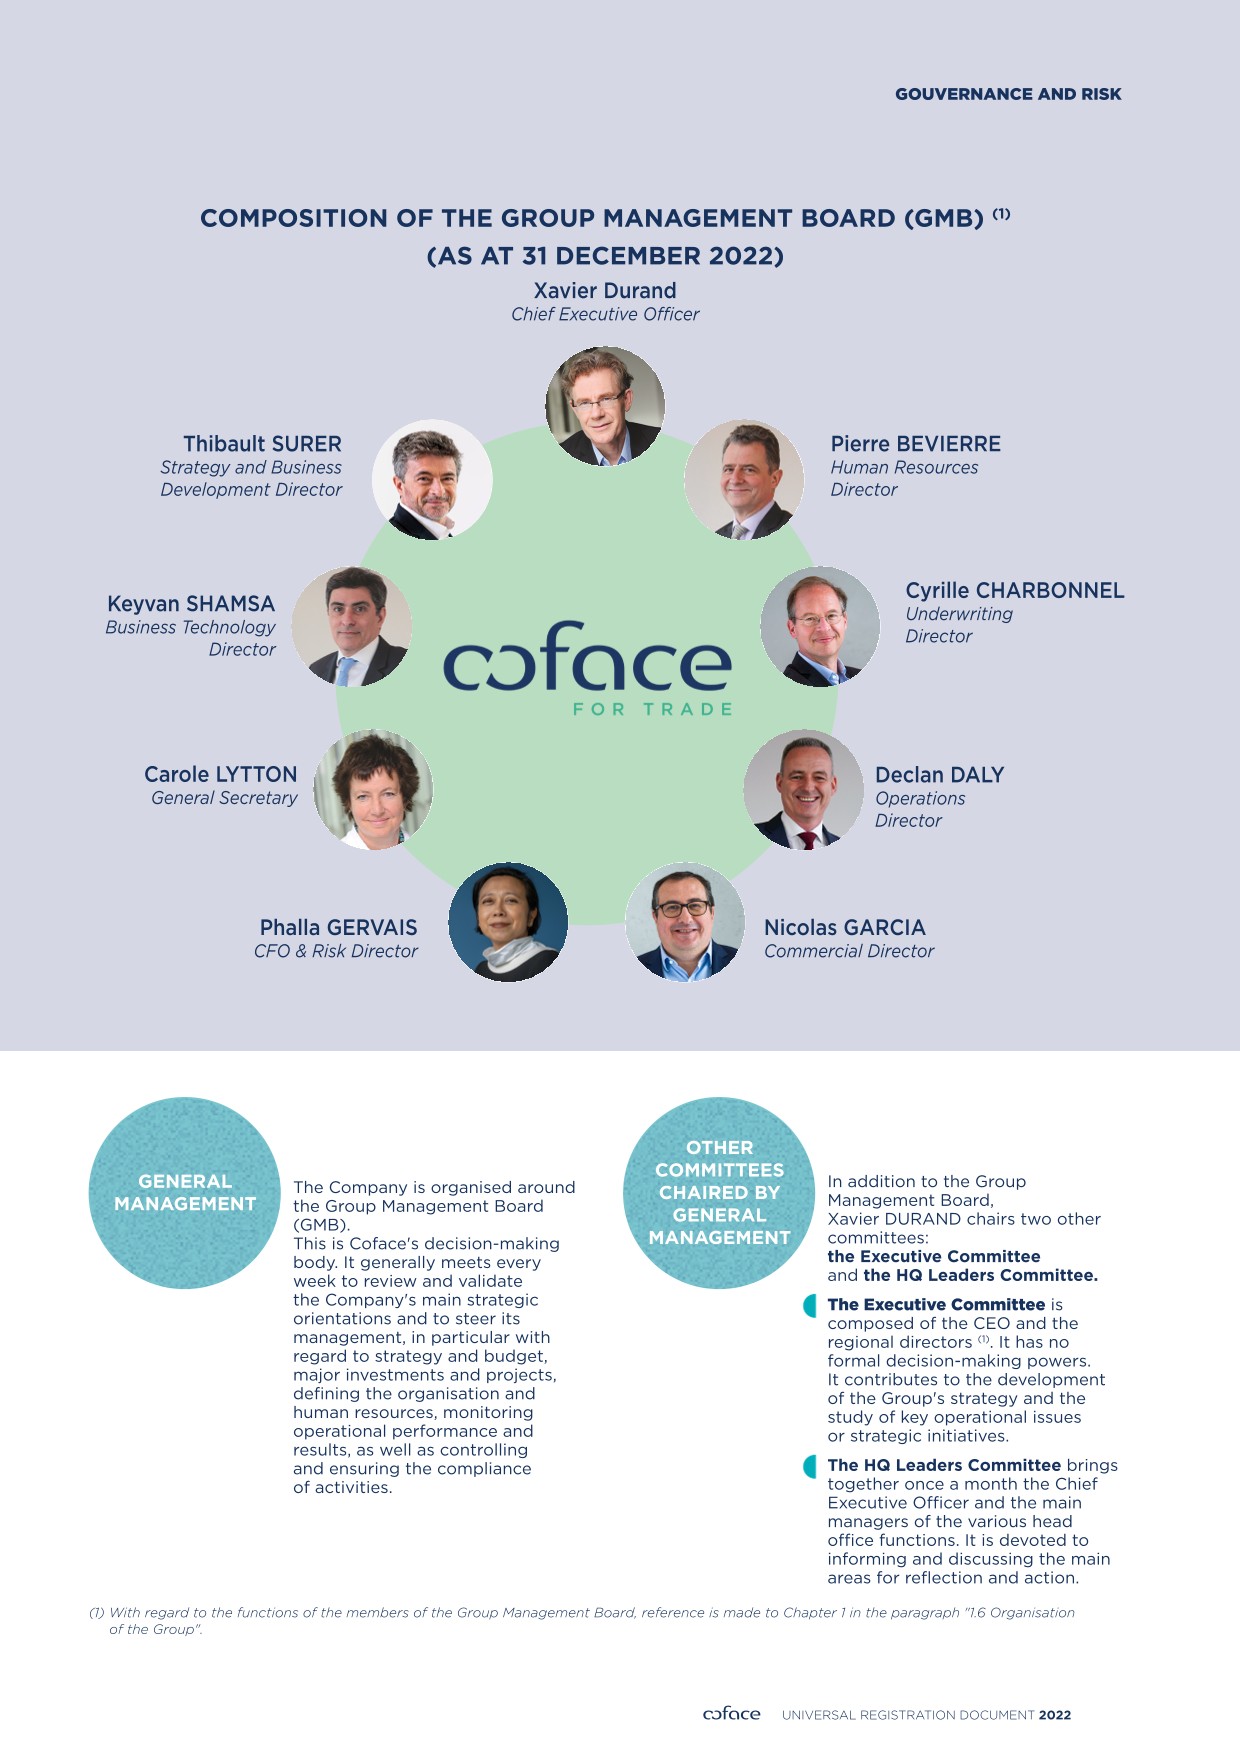
The Group’s organisation includes seven regions and functional departments. Each of the Group’s seven regions is headed by a regional director who is a member of the Group Executive Committee.

This organisation, built on clearly defined responsibilities and transparent governance, aims to facilitate the implementation of the Group’s strategic guidelines.

The organisational structure is based on:

  • the Strategy and Development Department, headed by Thibault Surer, to which the Strategic Planning, Marketing & Innovation, Partnerships, Economic Research, Data Lab and Information teams report;
  • the Commercial Underwriting Department, headed by Cyrille Charbonnel. This department comprises the Risk Underwriting, Claims & Collections and Recovery, and Commercial Underwriting Departments;
  • the Commercial Department, led by Nicolas Garcia;
  • the Audit Department, led by Nicolas Stachowiak;
  • the Finance and Risk Department, headed by Phalla Gervais;
  • the General Secretariat, led by Carole Lytton, which includes the Legal, Human Resources, Compliance and Communications Departments;
  • the Business Technologies Department, headed by Keyvan Shamsa;
  • the Operations Department, headed by Declan Daly.

Within the key functions (risk, actuarial, compliance and audit), the links between the head office and the regional departments are hierarchical in nature, in order to strengthen the coherence of the orientations of these functions at the level of the whole Group, and to ensure the independence of the proper execution of control activities. For other functions, functional ties are organised according to the principle of a strong matrix organisational structure.

The organisational chart below shows the executive organisation of Coface at December 31, 2022:

COA2022_URD_EN_G039_HD.png

1.6.1Strategy and Development Department

Led by Thibault Surer, the scope of this department includes:

  • Strategic Planning, which is in charge of strategic planning, strategic research and the Group’s development through external growth;
  • Marketing & Innovation, which analyses competition (market studies), determines client segmentation, defines the Group’s product and service offering and pricing, and leads the innovation/digitalisation strategy as well as projects in this area;
  • the Partnership Department, in charge of developing and setting up new distribution and fronting agreements;
  • Economic Research, which performs analysis and publishes macroeconomic research;
  • the Data Lab, in charge of supporting modelling, innovation and digital transformation projects;
  • Information, which aims to develop information services. It is tasked primarily with selecting and coordinating information providers and service centres to supply the databases used by risk underwriting teams.

1.6.2Commercial Underwriting Department

Led by Cyrille Charbonnel, this department includes Commercial Underwriting, Claims & Collections and Recovery, Risk Underwriting, Risk Portfolio Management, and Special Risk Underwriting:

  • Commercial Underwriting examines business decisions requiring head office approval and sets underwriting standards in contractual matters;
  • Claims & Collections and Recovery is in charge of indemnification and debt collection procedures;
  • Risk Underwriting defines and controls the credit risk underwriting policy and monitors its application. Specifically, it oversees the largest outstanding amounts, as well as the most at risk, and analyses the monthly reports on credit risk activity for the Group as a whole. In addition, it underwrites major risks and coordinates risk underwriting centres in the Group’s seven regions;
  • Risk Portfolio Management is in charge of analysing the effectiveness of risk management and implementing the measures necessary for its improvement, and is responsible for enhanced information (individual analyses of buyers) destined for risk underwriting;
  • the Commercial Underwriting Department is supplemented by two offices responsible for monitoring specific risks: Single and Political Risk, and business conducted with financial institutions.

1.6.3Commercial Department

Led by Nicolas Garcia, this department is tasked with structuring, organising and coordinating the Group’s commercial activity. Its responsibilities extend to indirect and direct distribution networks and the client portfolio in our three segments: key accounts (CGS), mid-market (segment A, B and C) and financial institutions. This department includes:

  • Mid-market and sales operations, which mainly coordinates mid-market sales (segments A, B and C), monitors sales and the Group’s tools used by the Commercial Department (invoicing, contract management and reporting tools, etc.);
  • Brokerage, in charge of structuring, the brokered sales strategy for all client segments, and coordinating the main international brokerage firms at Group level;
  • Financial Institutions, in charge of implementing the strategy, sales and sales teams dedicated to this segment;
  • Global Solutions, devoted to international key accounts, which handles strategy, the coordination and management of sales teams and quality of service in this segment.

1.6.4Audit Department

Led by Nicolas Stachowiak, this department is in charge of internal audit function. In particular, it performs three levels of periodic controls in accordance with Solvency II requirements, and reports directly to the CEO, according to an audit plan approved by the Board of Directors.

1.6.5Finance and Risk Department

Led by Phalla Gervais, this department, working with all the Group’s operational departments and entities, is tasked with steering and monitoring the Group’s financial performance in all the countries in which it does business.

It is responsible for:

  • accounting and taxation;
  • the publication of regulatory statements;
  • financial communications, investor relations and relations with rating agencies;
  • the establishment of balance sheet protection measures (particularly for reinsurance);
  • asset management, Group funding and purchasing.

In accordance with the new rules governing the insurance sector and the banking system, the actuarial function has been separated from the Risk Department and reports directly to Phalla Gervais:

  • the Risk Department is in charge of supporting general management to ensure the Group’s long term solvency and profitability, and of monitoring compliance with the requirements laid down by the Solvency II Directive. It includes the risk management and internal control functions as described in the Solvency II Directive;
  • the Actuarial Department is responsible for analysing and processing the financial impacts of risk, and pricing, among other duties. It works on solvency modelling and provisioning under Solvency II (internal model).

1.6.6General Secretariat

Led by Carole Lytton, the general secretariat includes the following functions:

  • the Legal function, which advises all Group entities and defends the Group’s interests with respect to third parties. It handles all aspects of the company’s life and activity, with the exception of tax and employment law issues. The Legal Department, with the support of its network of correspondents in the Group’s various regions, is in charge of the legal and regulatory watch, the compliance of insurance policies and of all products sold by the company with laws in France and abroad, and contracts with suppliers. It advises the departments in charge of compensation and participates in partnerships and acquisitions. The Legal Department is also responsible for the good governance of the Group’s companies. As such, it acts as secretary of the board for French companies. The General Secretary is secretary of the Board of Directors of COFACE SA;
  • the compliance function, which ensures the Group observes all the rules governing its activities in France and abroad; it sets rules governing the company’s activities in terms of international sanctions, anti-money laundering, anti-corruption and personal data protection; it ensures compliance with the rules that govern the issuing of licences held by Group entities; it is responsible for the dissemination of these rules and their understanding by all employees, for the definition of level one compliance controls and the implementation of level two controls throughout the Group;
  • Human Resources, which is in charge of providing change management support to general management and all employees. It manages human resources procedures and policies, and implements initiatives for talent and skills development, compensation and performance management;
  • Communications, which defines and implements the Group’s internal and external communications strategy, both in France and abroad. For internal communications, the teams contribute to change management and to furthering employees’ understanding of the Group’s strategy. For external communications, the teams are responsible for developing the Group’s brand awareness and protecting its reputation. It carries out this task in liaison with general management;
  • CSR, which implements applicable legislation, defines the company’s strategy and submits it to the Board of Directors. It is also in charge of training employees on CSR issues and promoting knowledge within the company. It works with the support of other functions that are highly involved in this area, such as the Group Human Resources Department, the Group Compliance Department, the Finance and Risk Department and coordinates their work.

1.6.7Business Technologies

Led by Keyvan Shamsa, this department has four units:

  • a cross-business unit in charge of IT administration, architecture, data management, the deployment and management of the Group’s shared IT resources, and security;
  • a functional unit covering the Coface businesses, which conducts impact studies and supports the implementation of various IT projects for the Group and users;
  • a unit in charge of infrastructure and operations;
  • an international unit comprising the seven regions and providing coordination and consistency between the business, Business Technology matters and the regions.

1.6.8Operations Department

Led by Declan Daly, this department is responsible for managing the client service and operational excellence programme as part of the Build to Lead strategy. It focuses on improving the client experience and implementing more efficient business processes. It is responsible for:

  • the strategy and establishment of shared service centres;
  • the client experience and business process management;
  • the Transformation office, whose main responsibilities include the project portfolio, the operational management of major strategic projects related to the Build to Lead plan, Coface’s transformation programme and change management;
  • the implementation of the digitisation programme.

1.7Information systems and processes

1.7.1General introduction

The use of efficient, reliable and secure information systems is a major challenge for the Group in the context of its commercial offerings; the digital experience provided to its clients through its products and services is an important development focus. It is also equally important for its management, reporting and internal control procedures, since it provides a global perspective on the Group’s activities, the completion of its strategic plans and its development, the management of its risks, and the follow-up given to internal and external audit report recommendations.

In recent years, the Group has focused on aligning its information systems with its strategic objectives, and modernising, unifying and securing its business data. This approach has continued under the new strategic plan, which affords great importance to the streamlining of processes and the automation of information systems. In accordance with its disaster recovery plan (DRP), all servers worldwide are hosted in two external data centres located in the Paris region in France, which will soon be supplemented with a third cold data storage solution. All data are backed up on a private cloud. These two sites combine the Group’s information system equipment (servers, storage, backups, network and telecommunications equipment, security, etc.). In the event of a failure at one of these two sites, the other takes over in a completely transparent manner for all users. The “information systems” component of the DRP is tested twice a year.

The Group has chosen to ensure a high level of expertise and quality in data management, and has chosen open information systems, which allow it to keep abreast of the technological developments needed for its activities, through a range of applications consisting of internally developed applications and software packages.

Furthermore, the Group’s information systems follow a quality process based on the ITIL (Information Technology Infrastructure Library) standard. Its development teams apply agile methods and an active certification process. As such, the Coface Group’s information systems have been ISO 9001 certified since 2000 (1).

Overall, thanks to this new architecture, maintenance costs have fallen and security and the assurance of business continuity have improved. The Group is committed to investing in its information systems, particularly to support its commercial and innovation strategy, while also controlling related expenses and investments.

With the pandemic, information systems now extend to staff members’ homes. In accordance with the business continuity plan (BCP), the Group has strengthened its resources to maintain the required level of security and availability outside the company’s premises. This period was also an opportunity for criminals to develop their activities. The Group therefore decided to strengthen its security by increasing the resources allocated to both human and technical security. Processes were reviewed to ensure that security is taken into account, existing solutions were improved, and new ones have been added. This work has already proven effective in countering these ever-increasing attacks.

The Group has scaled operational infrastructure to deal with crisis situations such as Covid-19 and more generally to support the company with a mixed office/remote working model.

1.7.2Group applications and tools

The main applications and operational tools directly linked to the services the Group provides to its clients, and referred to in this Universal Registration Document, are described below.

Applications

Description

ATLAS

ATLAS is the IT underwriting tool for the credit insurance business and for the risk underwriting management of all the Group’s businesses, for all of its entities and a number of partners of the Coface Partner network. ATLAS incorporates all functions necessary for commercial underwriting and monitoring (receipt of coverage requests, automatic or manual underwriting, management and follow-up of the risk covered, as well as outstanding amounts and portfolios). It offers comprehensive management of debtor risks: the various risks are integrated, and outstanding amounts are managed and viewable. The quality of Group-level reporting and control procedures is thereby improved. This tool, which is accessible 24 hours a day, 7 days a week (excluding scheduled maintenance periods), contains access to information on more than 70 million businesses worldwide, thereby allowing a quick answer to any initial request for a credit limit.

In addition, this tool offers an integrated view of the information contained in the Group’s main risk analysis tools (ATLAS, EASY, ATLAS-INFO, WORKLIST, CUBE) and a link to these applications from a single portal.

COP (IMX)

(Collection Overview Platform)

IMX is used by the Group for its debt management and collection and unpaid invoice management activities. It combines all tasks and reminders relating to a specific case and facilitates the communication and sharing of information among the Group’s entities. This tool simplifies and harmonises the underlying processes and improves the accuracy of the data shared with clients around the world.

EASY

EASY is a centralised Group database and software tool which allows companies to be identified, regardless of their location in the world. It is linked to all Group applications which require access to such data, notably enabling users to:

  • search and identify debtors;
  • continuously manage the content and quality of information in the database (history of modifications);
  • duplicate files and standardise data;
  • cross-check debtors against anti-money laundering lists published by international institutions.

CofaNet

CofaNet is a secure online information flow management platform for the Group’s policyholders. Using this platform, each policyholder can, in a few seconds, identify its debtors, check its covered receivables, declare claims, and track the indemnification of unpaid receivables. The platform also offers key services for the Group’s various business lines. The version that had been in place since 2017 was completely revamped in 2020 to provide policyholders with optimised interfaces and pathways for a smoother and more intuitive browsing experience.

ICON

ICON (Information on Companies ONline) is an information services web platform that is also available to clients and partners via web-service interfaces (APIs). It is a multi-language, multi-currency tool available 24 hours a day, 7 days a week and gives instant access to information on any type of business in 195 countries. With ICON users can search for a company and receive information in different formats:

  • information reports;
  • credit scores;
  • credit opinions;
  • follow-up and monitoring.

Other features, such as risk analysis on more than 160 countries and the main sectors of the economy, are also available.

Other Group tools

The Group also provides other IT tools used for its various businesses, such as NAVIGA for surety bond management, SONATA for Single Risk management, and MAGELLAN for factoring.

INVOICING, an invoicing tool, and iNCA, a claims and collections management tool, are deployed in the Northern Europe and Central Europe regions and will be extended to the other regions of the world under the strategic plan.

In addition, CofaServe, a set of APIs for policyholders and their brokers, puts credit insurance services at the heart of the information systems of both the client company and its broker.

(1)
ISO: founded in 1947, ISO (International Organisation for Standardisation) is the world’s leading producer of voluntary international standards in almost all technological and economic domains. These standards establish quality specifications that are applicable to products, services and best practices in order to boost efficiency in all sectors of the economy.

1.8The Group’s regulatory environment

The Group is governed by specific regulations in each of the countries in which it operates its insurance or factoring activities, either directly, or through branches, subsidiaries or partnerships. In some jurisdictions, the activity of business information and/or debt collection may also be regulated.

1.8.1Credit insurance activities

General rules on oversight and control of the Group’s activities

The French Insurance Code (Code des Assurances), notably in Book III thereof, provides that an insurance company holding an authorisation from a Member State that allows it to perform its activities in one or more classes of insurance, may exercise these same activities, directly or through branch offices, under the European passport.

As an insurance company, Compagnie française d’assurance pour le commerce extérieur is subject to the provisions of the French Insurance Code and European Union regulations, in particular Solvency II. The Company and its branches in the European Union are placed under the supervision of the Autorité de contrôle prudentiel et de résolution (ACPR), an independent administrative authority. It ensures that insurance undertakings are always able to meet their commitments to their policyholders through the application of appropriate internal policies and a sufficient level of own funds. In this respect, level two controls have been put in place since 2008. They mainly relate to:

  • regulatory licences and authorisations;
  • compliance with personal data protection regulations;
  • the implementation of procedures to guarantee the confidentiality of data;
  • governance rules;
  • compliance with anti-money laundering and counter-terrorist financing legislation;
  • the Know Your Customer obligations incumbent on insurance companies; and
  • the effectiveness of reporting procedures.

The Company, as a holding company for an insurance group, is likewise subject to the ACPR’s additional oversight as concerns compliance with the solvency standards (see Section 5.2.2 “Financial Risks”).

In accordance with Articles L.322-4 and R.322-11-1 to R.322‑11-3 of the French Insurance Code, any party, acting alone or in concert, that intends to increase or decrease its interest, directly or indirectly, in the share capital of the Company or Compagnie française d’assurance pour le commerce extérieur, such that the voting rights held by that party (or parties, in the case of a disposal or extension of interest made in concert) would go above or below the threshold of one tenth, one fifth, one third or one half of the voting rights in the Company or in Compagnie française d’assurance pour le commerce extérieur, is required to inform the ACPR of such plan and obtain its approval in advance. Pursuant to Article L.561-2 of the French Monetary and Financial Code, Compagnie française d’assurance pour le commerce extérieur is subject to the legislative mechanism relating to combating money laundering and the financing of terrorism. The current mechanism, codified under Title Six, Book V of the French Monetary and Financial Code, includes oversight of any practices whereby third parties would use insurance operations to engage in corruption or to reintroduce the proceeds of criminal offences into the legal economy. Transactions likely to be the result of an act of corruption, money laundering, or terrorism financing are analysed and, where applicable, result in a suspicious transaction report to TRACFIN (the French financial intelligence unit), which is the competent authority for these matters in France.

Following the entry into force in 2017 of the french law of December 9, 2016 on transparency, anti-corruption and the modernisation of economic life, known as the Sapin II law, the Group reviewed its internal procedures in order to verify their legal and regulatory compliance.

Prudential regime for insurance companies

The prudential regime for insurance companies, which applies to the Company as an insurance group as defined in Article L.356-1 5 of the French Insurance Code, comprises two aspects which govern their operation: a financial component on the one hand, and an accounting component on the other. The companies of the Group operating outside of the European Union are likewise subject to a prudential regime.

Financial aspect of the prudential regime for insurance companies

The regulations derived (i) from Directive No. 2009/138/EC of the European Parliament and of the Council of November 25, 2009 on the taking-up and pursuit of the business of insurance and reinsurance, transposed by ordinance and decree into the French Insurance Code in April and May 2015, and (ii) from its implementing texts, including the delegated regulations of the European Commission (“the Commission”), notably delegated Regulation (EU) 2015/35 supplementing the aforementioned directive, came into force on January 1, 2016 (together “Solvency II”).

The aim of Solvency II is, in particular, to achieve better understanding of insurers’ risks, and create a common system for all European Union members (see Section 5.2.2 “Financial risks”).

In this context, Solvency II sets out rules relating to:

  • the valuation of assets and liabilities;
  • technical provisions;
  • own funds;
  • the Solvency Capital Requirement;
  • the minimum capital requirement; and
  • the investment rules that must be applied by insurance companies.

In this regard, the insurance entities located in the European Union are branches of the Company. This makes it possible to pool all these entities’ assets and to leave only the minimum amount of cash required for operational requirements at the local level.

In other countries, regardless of the legal status of the entity concerned, the Group must comply with local regulations. To that end, the entities hold their asset portfolios and their cash locally in order to meet the asset-liability management and solvency requirements set by local regulators.

Accounting aspect of the prudential regime for insurance companies

In addition to the general accounting obligations enacted by Articles L.123-12 et seq. of the French Commercial Code, the Group is subject to specific accounting rules for insurance companies, which have been codified under Title IV, Book III of the French Insurance Code. In fact, the inversion of the production cycle that is specific to insurance activities, i.e. the fact of providing services with an actual cost that will only be known after the fact, justifies the existence of specific accounting rules for the companies that conduct these activities.

The Group’s consolidated financial statements are prepared in application of IFRS rules including IFRS 4, phase 1. This standard requires that the references used for insurance contracts as defined by IFRS be a recognised set of accounting guidelines. The Group has thus adopted the French principles to show the accounting of the insurance contracts. The provision for equalisation is not accepted under IFRS, and was thus eliminated in the IFRS financial statements. Furthermore, the Group must apply IFRS 4, paragraph 14, and specifically proceed to conduct liability adequacy tests.

IFRS 4 on insurance contracts will be replaced by IFRS 17 on January 1, 2023. In addition, IFRS 9 on financial instruments traded on spot or derivatives markets will be applicable to insurance holding companies on January 1, 2023.

Regulations applicable to credit insurance policies signed by the Group

The policies issued in each of the countries where it is present comply with the corresponding country’s regulations. In France, credit insurance policies issued by Coface are not subject to the provisions of the French Insurance Code but to those of the common law of contracts – with the exception of the provisions of Articles L.111-6 (major risks), L.112-2 (pre-contractual information), L.112-4 (content of insurance policies), L.112-7 (information to be provided when operating under the freedom to provide services) and L.113-4-1 (explanation due to the policyholder by the credit insurer upon termination of cover) of the French Insurance Code.

1.8.2Factoring activities in Germany and Poland

Factoring is regulated as a financial service (and not as a banking activity) by the German banking law and is defined as the ongoing acquisition of receivables based on a master agreement, with or without recourse against the ceding company. As a financial service, as defined in German banking law, the factoring business is regulated and subject to oversight by the two German financial regulation authorities, the Deutsche Bundesbank and BaFin (the Federal Financial Supervisory Authority), which notably requires authorisation to conduct such activities.

In Poland, factoring activities that are performed within the context of the local Civil law scheme on the transfer of receivables are not specifically supervised, with the caveat that they are subject to Polish anti-money laundering regulations.

The law and regulations applicable to the Group’s factoring activities in Germany and Poland do not impose any quantitative requirements in terms of regulatory capital or liquidity. At the Group level, regulatory capital requirements are calculated in accordance with the Basel regulations applicable to banking activities (see Section 3.4.2 “Group Solvency”).

1.8.3Business information and debt collection activities

Information and debt collection activities may be subject to specific regulation in some countries (e.g. Denmark, South Korea, etc.) and require a licence to carry out the activity or a declaration of the activity to the relevant local authority. Local legislation may regulate the exercise of these activities. It should be noted that in terms of debt collection, although there is a restrictive framework, it mainly concerns the activity of collecting debts from private individuals and is not applicable to the collection of commercial debts or only partially.

board of directors
Structure and operation

10 
Directors

60% 
Independent directors

50% 
women directors

95% 
average attendance rate 

at board meetings

(1)
The ICISA database only contains data on ICISA partners (participants and countries) and does not represent the entire credit insurance market.
(2)
Global market shares are calculated on the basis of gross short term credit insurance premiums, including markets under state monopoly, in 2021. Sources: i) Official market sources, often at the behest of regulators, and sometimes published by a consolidating organisation (for example, Latino Insurance in Latin America. ii) Published consolidated financial statements, when they show the share of gross credit insurance premiums. iii) ICISA data (www.icisa.org), consolidated and published by the association upon declaration by its members. iv) Group estimates, as a last resort.
(3)
Companies with at least one active contract with Coface in our various business lines.
(4)
See Section 1.7.2 “Group applications and tools”.
(5)
See Section 1.7.2 “Group applications and tools”.
(6)
See Section 1.8.2 “Group applications and tools”.
(7)
Sources: (i) Factoring-Markt 2021: Trotz oder mit Corona starkes Wachstum | Deutscher Factoring Verband e.V.; (ii) Annual Factoring Data | Data & Statistics (euf.eu.com); (iii) http://www.faktoring.pl/eng/
(8)
Headcount figures cover employees on permanent or fixed term contracts, excluding those who had permanently left the Company.
(9)
Comments on regional results can be found in Section 3.3 “Comments on the results as at December 31, 2022”
(10)
ISO: founded in 1947, ISO (International Organisation for Standardisation) is the world’s leading producer of voluntary international standards in almost all technological and economic domains. These standards establish quality specifications that are applicable to products, services and best practices in order to boost efficiency in all sectors of the economy.

2. CORPORATE GOVERNANCE

2.1Structure and operation of the Board of Directors and its specialised Committees

2.1.1Details of the members of the Board of Directors for financial year 2022

Following the disposals carried out in 2021 between Natixis and Arch Capital Group, on January 6, 2022, Natixis sold its remaining stake in COFACE SA, representing 10.04% of the share capital, to institutional investors. Natixis no longer holds any shares in COFACE SA.

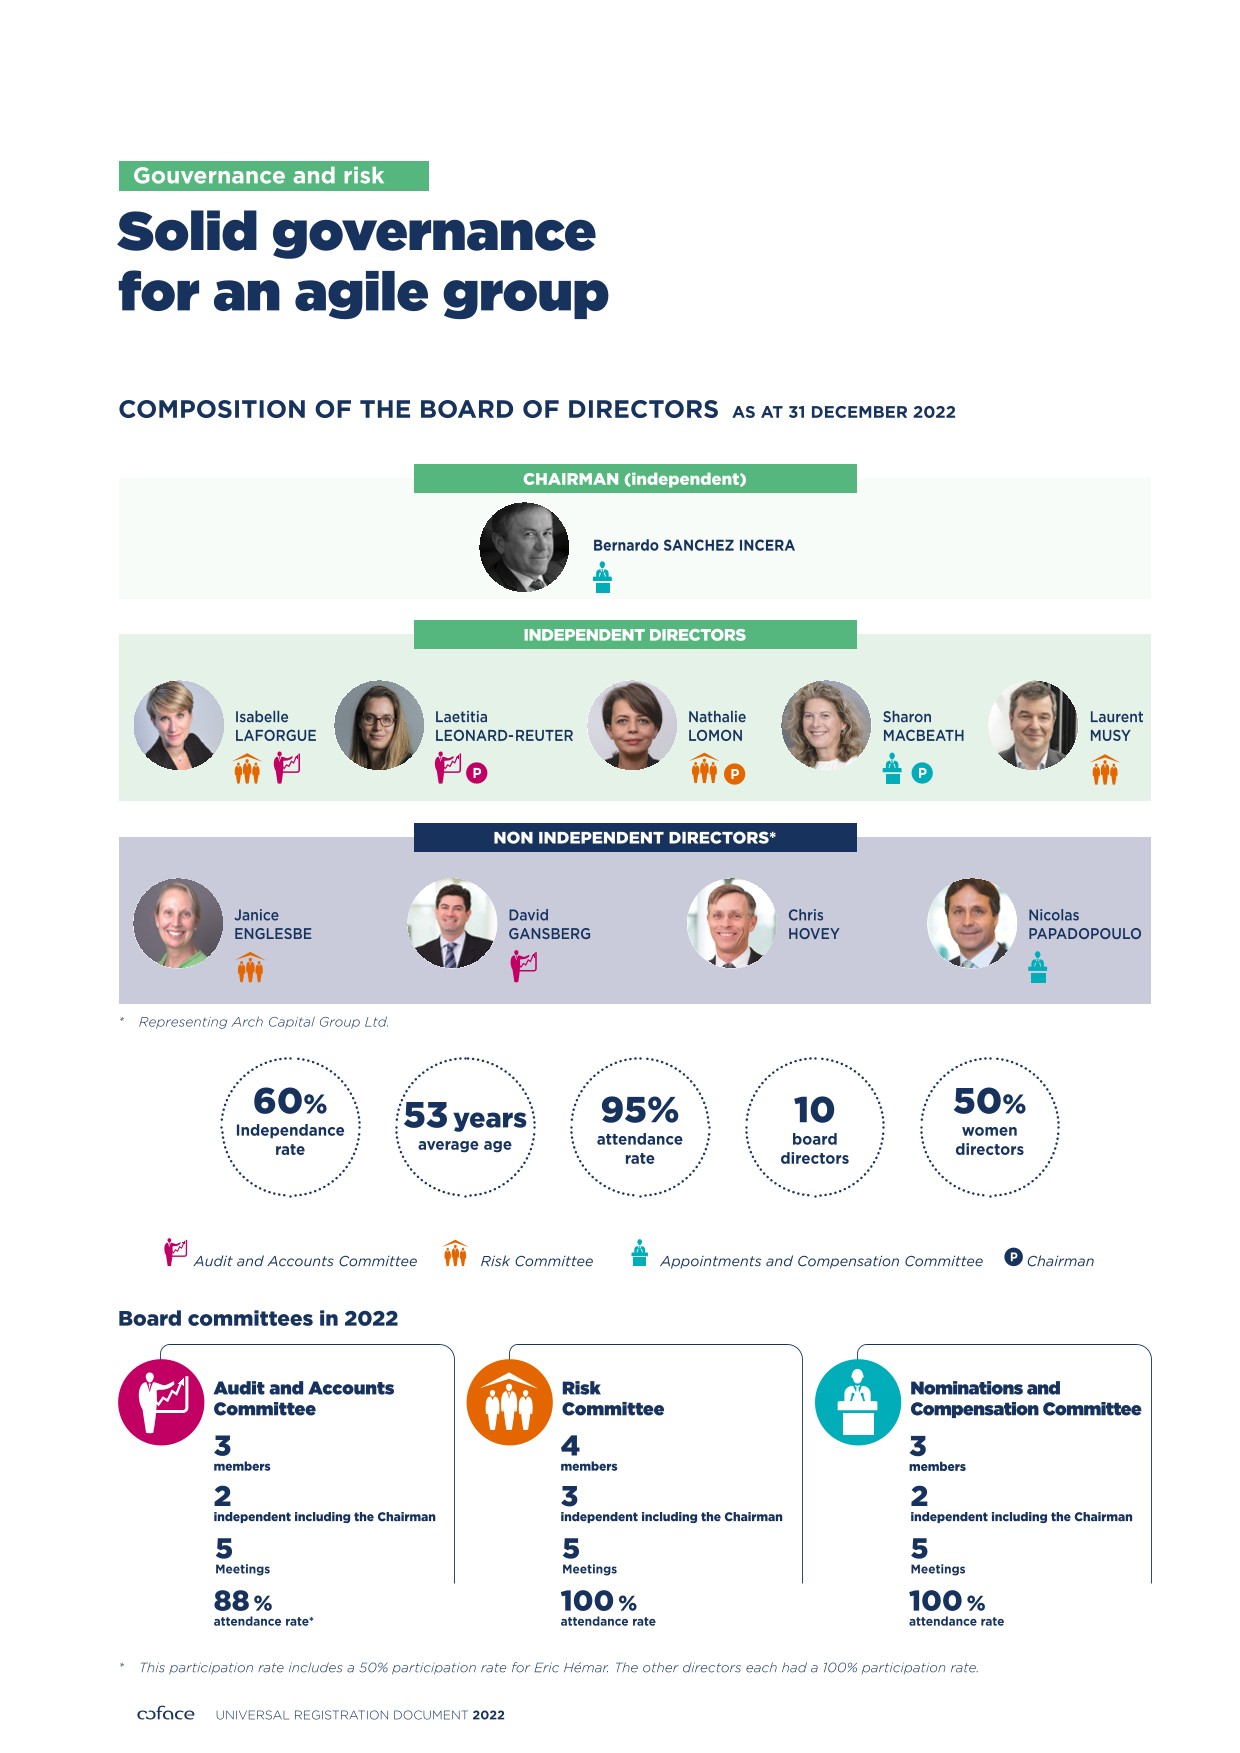
The disposal of this remaining stake had no impact on the organisation of the Board of Directors of COFACE SA, which is still made up of ten directors, including four appointed by Arch Capital and a majority of six independent directors, including the Chairman.

The tables, as well as the biographies, presented below are established as of December 31, 2022 and therefore do not take into account the change in the name of the Appointments, Compensation and CSR Committee (cf. Section “Appointments, Compensation and CSR Committee” in paragraph 2.1.8.).

Name

Personal information

Experience

Position on the Board of Directors

Age

Gender

Nationality

Number of shares

Number of offices held in listed companies (1)

Inde-
pendent

Start of term/end of term

Attendance rate (2)

Board committees/
attendance rate (3)

Bernardo Sanchez Incera

62

COA2020_URD_Picto_Homme_HD.png

Spanish

1,000

1

Feb. 10, 2021

2024 AGM

100%

ACC

100%

Janice Englesbe

54

COA2020_URD_Picto_Femme_HD.png

American

1,000

-


Feb. 10, 2021

2024 AGM

100%

RC

100%

David Gansberg

50

COA2020_URD_Picto_Homme_HD.png

American

1,000

-


Jul. 28, 2021

2024 AGM

90%

AAC

100%

Chris Hovey

56

COA2020_URD_Picto_Homme_HD.png

American

1,000

-


Feb. 10, 2021

2024 AGM

100%

-

Isabelle Laforgue

42

COA2020_URD_Picto_Femme_HD.png

French

1,000

-

Jul. 27, 2017

2024 AGM

100%

AAC – 100%

RC – 100%

Laetitia Léonard-Reuter

Appointment on May 17, 2022

47

COA2020_URD_Picto_Femme_HD.png

French

1,000

-

May 17, 2022

2025 AGM

100%

AAC (Ch.)

100%

Nathalie Lomon

51

COA2020_URD_Picto_Femme_HD.png

French

1,000

-

Jul. 27, 2017

2024 AGM

80%

RC (Ch.)

100%

Sharon MacBeath

53

COA2020_URD_Picto_Femme_HD.png

British

1,000

-

Jul. 1, 2014

2025 AGM

90%

ACC (Ch.)

100%

Laurent Musy

Appointment on May 17, 2022

56

COA2020_URD_Picto_Femme_HD.png

French

1,200


May 17, 2022

2025 AGM

100%

RC

100%

Nicolas Papadopoulo

60

COA2020_URD_Picto_Homme_HD.png

French

12,800

-


Feb. 10, 2021

2024 AGM

90%

ACC – 100%

Average (4)

53

50% (5)

50%


60%


95%


For the purposes of their corporate offices, the members of the Board of Directors are domiciled at the head office of the Company.

  • With the exception of the office held within the Company.
  • Average attendance rate at Board meetings.
  • AAC: Audit and Accounts Committee – RC: Risk Committee – ACC: Appointments and Compensation Committee – Ch.: Chairman.
  • Average on December 31, 2022.
  • Percentage of women on December 31, 2022. 
COA2020_URD_Picto_Femme_HD.png

       Female


COA2020_URD_Picto_Homme_HD.png

        Male


Changes in the composition of the Board of Directors and the Board Committees since the beginning of 2022

BOARD OF DIRECTORS / COMMITTEE

NAME

Nature of change

Date of decision

Board of Directors

Sharon MacBeath

Renewal of directorship

Shareholders’ Meeting of May 17, 2022

Board of Directors

Laetitia Léonard-Reuter

Appointment as independent director

Shareholders’ Meeting of May 17, 2022

Board of Directors

Laurent Musy

Appointment as independent director

Shareholders’ Meeting of May 17, 2022

Board of Directors

Olivier Zarrouati

Expiry of term as independent director

Shareholders’ Meeting of May 17, 2022

Board of Directors

Éric Hémar

Expiry of term as independent director

Shareholders’ Meeting of May 17, 2022

Audit and Accounts Committee

Laetitia Léonard-Reuter

Appointment as Chairman
 to replace Éric Hémar

Board of Directors’ meeting of June 8, 2022

Risk Committee

Laurent Musy

Appointment as member

Board of Directors’ meeting of June 8, 2022

Appointments and Compensation Committee

Sharon MacBeath

Appointment as Chairman 
to replace Olivier Zarrouati

Board of Directors’ meeting of June 8, 2022

2.1.2Experience and offices of the members of the Board of Directors

The Board of Directors has ten members. Information relating to the members of the Board of Directors, including their principal offices outside the Coface Group as at December 31, 2022 is provided in the section below (2).

Bernardo SANCHEZ INCERA

CH02_COA2020_Photo_Admin_BERNARDO_HD.png


Spanish national

Age: 62

Attendance rate at Board meetings: 100%

Attendance rate at appointments and compensation committee meetings: 100%

Expiration date of the 
term of office: Ordinary Shareholders’ Meeting called 
to approve the financial statements for the financial year ended December 31, 2024

Chairman of the Board of Directors
Independent director

since February 10, 2021

Curriculum Vitae

Bernardo Sanchez Incera, a Spanish national, joined Societe Generale in 2009 before serving as Deputy Chief Executive Officer of Societe Generale from January 2010 to May 2018. Prior to that, he was Executive Director of the Monoprix Group from 2004 to 2009, Executive Director of Vivarte from 2003 to 2004, Chairman of LVMH Mode et Maroquinerie Europe between 2001 and 2003 and International Director of Inditex Group from 1999 to 2001. Bernardo Sanchez Incera also served as Chief Executive Officer of Zara France between 1996 and 1999 after being Deputy Director of Banca Jover Spain from 1994 to 1996 and jointly Director and Board member of Crédit Lyonnais in Belgium from 1992 to 1994. With an MBA from INSEAD, Bernardo Sanchez Incera is a graduate of the Paris Institute of Political Studies (Sciences Po) and holds a Master’s degree and a postgraduate degree in economics.

Principal offices and duties outside Coface Group

During financial year 2022

  • Director, Edenred (3)
  • Director, Boursorama
  • Director, Compagnie Financière Richelieu
  • Member of the Supervisory Board, Banque Richelieu France (100% owned by Compagnie Financière Richelieu)

During the past five years and which are no longer held

  • Director, ALD Automotive (2) (in 2021)
  • Member of the Supervisory Board, PJSC Rosbank, Russia (in 2021)
  • Deputy Chief Executive Officer, Societe Generale (2)
  • Chairman of the Board of Directors, Crédit du Nord
  • Chairman of the Board of Directors, Boursorama
  • Director, Sogécap
  • Member of the Supervisory Board, SGMB, Morocco
  • Member of the Supervisory Board, Komercni Banka (2), Czech Republic
  • Director, BRD Bank (2), Romania

Janice ENGLESBE


COA2022_URD_FR_ADMIN_JE_p04_HD.png


American national

Age: 54

Attendance rate at Board meetings: 100%

Attendance rate at Risk Committee meetings: 100%

Expiration date of the term of office: Ordinary Shareholders’ Meeting called to approve the financial statements for the financial year ended December 31, 2024

Director

since February 10, 2021

Curriculum Vitae

Janice Englesbe is Senior Vice President and Chief Risk Officer at Arch Capital Group Ltd. She joined Arch as Global Head of Risk Management on February 25, 2019. She has over 25 years of experience in risk, finance and business, including as Deputy Chief Risk Officer of the General Re Group. She holds a degree in economics from the Wharton School of the University of Pennsylvania and is a CFA Charterholder.

Principal offices and duties outside Coface Group

During financial year 2022

  • Chief Risk Officer, Arch Capital Group Ltd. (4)

During the past five years and which are no longer held

  • Chief Executive Officer, Englesbe Consulting LLC
  • Deputy Chief Risk Officer, General Re Group

David GANSBERG


COA2021_ADMIN_PHOTO_David-Gansberg_HD.png


 American national

Age: 50

Attendance rate at Board meetings: 90%

Attendance rate at Audit and Accounts Committee meetings: 100%

Expiration date of the term of office: Ordinary Shareholders’ Meeting called to approve the financial statements for the financial year ended December 31, 2024

Director

since July 28, 2021

Curriculum Vitae

David Gansberg was appointed Chief Executive Officer in charge of the mortgage lending business of Arch Capital Group Ltd., which provides mortgage insurance and reinsurance worldwide, on March 1, 2019. From February 2013 to February 2019, he was Chairman and CEO of Arch Mortgage Insurance Company. From July 2007 to February 2013, David Gansberg was Executive Vice President and Director of Arch Reinsurance Company. Previously, he held various positions in underwriting, operations and strategy at Arch Reinsurance Ltd. and Arch Capital Services Inc., which he joined in December 2001. Before joining Arch, David Gansberg held various positions at ACE Bermuda and Cigna Property and Casualty. He holds a degree in Actuarial Mathematics from the University of Michigan.

Principal offices and duties outside Coface Group

During financial year 2022

  • Chief Executive Officer of Global Mortgage Group, Arch Capital Group, Ltd. (1)
  • Treasurer, Greensboro Chamber of Commerce

During the past five years and which are no longer held

  • Chairman and Chief Executive Officer, Arch Mortgage Insurance Company

Chris HOVEY


COA2022_URD_FR_ADMIN_CH_p03_HD.png


American national

Age: 56

Attendance rate at Board meetings: 100%

Expiration date of the term of office: Ordinary Shareholders’ Meeting called to approve the financial statements for the financial year ended December 31, 2024

Director

since February 10, 2021

Curriculum Vitae

Chris Hovey is Chief Operating Officer at Arch Capital Services LLC. From July 2018 to January 2020, he served as Executive Vice President and Chief Information Officer at Arch Capital Services LLC. Prior to that, he was Chief Operating Officer of Arch Mortgage Insurance Company. Before joining Arch, Chris Hovey was Chief Operating Officer of PMI Mortgage Insurance Co. from 2011. He was also Vice President and Head of Service Operations and Claims Management for PMI, which he joined in 2002. Chris Hovey holds a degree from San Francisco State University and an MBA from Saint Mary’s College in Moraga, California.

Principal offices and duties outside Coface Group

During financial year 2022

  • Chief Operating Officer, Arch Capital Services LLC
  • Director, Arch Global Services Holdings Ltd.

During the past five years and which are no longer hel

  • N/A

Isabelle LAFORGUE


CH02_COA2020_Photo_Admin_LAFORGUE_HD.png


 French national

Age: 42

Attendance rate at Board meetings: 100%

Attendance rate at Risk Committee meetings: 100%

Attendance rate at Audit and Accounts Committee meetings: 100%

Expiration date of the term of office: Ordinary Shareholders’ Meeting called to approve the financial statements for the financial year ended December 31, 2024

Independent director

since July 27, 2017

Curriculum Vitae

After graduating from École Polytechnique and École des mines de Paris, Isabelle Laforgue began her career at SFR in 2006, where she held various roles in the Strategy and Finance Departments. She was appointed Director of Central Finance in 2011, in charge of management control, accounting, financial communications and consolidation. In 2012, she was appointed Chief of Staff to the Chairman and Chief Executive Officer of SFR, advising, analysing and supporting the decision-making processes during a period of change and market consolidation. In 2015, she joined Econocom, a European company specialising in the digital transformation of businesses, as Chief Transformation Officer to develop and implement the Group’s internal transformation. In 2017, she became Deputy CEO for France at Econocom. In 2019, she joined Owkin, a start-up specialising in the use of artificial intelligence in cancer research, as Executive VP Finance & Operation. In March 2021, Isabelle Laforgue joined AstraZeneca France as Head of Digital, Transformation and Innovation.

Principal offices and duties outside Coface Group

During financial year 2022

  • Head of Digital, Transformation and Innovation, AstraZeneca France
  • Executive VP Finance & Operation, Owkin

During the past five years and which are no longer held

  • Chief Transformation Officer, Econocom (5)
  • Deputy CEO for France, Econocom (1)

Laetitia LEONARD-REUTER


A mettre à jour


French national

Age: 47

Attendance rate at Board meetings: 100%

Attendance rate at Audit and Accounts Committee meetings: 100%

Expiration date of the term of office: Ordinary Shareholders’ Meeting called to approve the financial statements for the financial year ended December 31, 2025

Independent director

since May 17, 2022

Curriculum Vitae

Laetitia Léonard-Reuter is a graduate of HEC Paris, the University of Saint-Gall (Switzerland), and a participant at the Institut des Hautes Études de l’Entreprise (IHEE). She joined Generali France as Chief Financial Officer in November 2018. She previously worked at Axa Group where she held various positions from 2003: Corporate Finance Account Manager, Head of Group Capital Management, then in 2014 Chief Financial Officer of AXA Global P&C, a non-life insurance and reinsurance entity. In 2017, she became Chief Data Officer of Axa France. She began her career in 2000 as an M&A analyst at JPMorgan Chase covering the Telecommunications, Media and Technology sectors.

Principal offices and duties outside Coface Group

During financial year 2022

  • Director, Generali Vie SA and Generali IARD SA
  • Permanent Representative of Generali France, Director of Prudence Créole SA
  • Permanent Representative of Generali Vie, Director of GFA Caraïbes SA
  • Representative of Generali on the French Federation of Insurance (FA) Economic and Financial Committee (ECOFIN) and the FA ECOFIN Office
  • Vice-Chair of the FA ECOFIN
  • Representative of Generali France, Director of Generali Investments Holding S.p.A. and Generali Real Estate S.p.A.
  • Director of AKG SAS and Generali Retraite

During the past five years and which are no longer held

  • N/A

Nathalie LOMON


CH02_COA2020_Photo_Admin_LOMON_HD.png


French national

Age: 51

Attendance rate at Board meetings: 80%

Attendance rate at Risk Committee meetings: 100%

Expiration date of the term of office: Ordinary Shareholders’ Meeting called to approve the financial statements for the financial year ended December 31, 2024

Independent director

since July 27, 2017

Curriculum Vitae

Nathalie Lomon has been Senior Executive VP and Chief Financial Officer at SEB Group since September 2019. She is also a member of the Executive Committee and the General Management Committee.

A graduate of the NEOMA Business School, Nathalie Lomon began her career in auditing at Mazars in 1995 before joining the General Inspection Department at BNP Paribas in 1999. In 2002, she joined Pechiney where she held several financial and management positions, including Chief Financial Officer for the Aeronautical, Transport and Industry division of Rio Tinto Alcan. She then joined the Ingenico group in 2010 as Head of Management Control, subsequently becoming Chief Financial Officer for the European-SEPA region in 2014 and then Chief Financial Officer in 2015, overseeing the finance, legal & governance functions, as well as being a member of the Executive Committee.

Principal offices and duties outside Coface Group

During financial year 2022

  • Senior Executive VP and Chief Financial Officer, SEB Group (6)
  • Chief Executive Officer, SEB Internationale SAS
  • Chief Executive Officer, Immobilière Groupe SEB SAS
  • Member of the Supervisory Board, WMF GmbH
  • Director and member of the Audit Committee, Zhejiang Supor Co. Ltd.
  • Director representing the founding members of the SEB Group Endowment Fund
  • Deputy Chief Executive Officer of Groupe SEB Ré
  • Director, SEB Professional North America, Ei Re Acquisition LLC, Wilbur Curtis Co. Inc.
  • Member of the Supervisory Board, Schaerer (AG)

During the past five years and which are no longer held

  • EVP Finance, Legal & Governance, Ingenico group SA (1)
  • Director, Ingenico Holdings Asia Limited (HK), Fujian Landi Commercial Equipment Co., Ltd.,
  • Manager, Ingenico e-Commerce Solutions BVBA/SPRL (BE)
  • Director, Ingenico Financial Solutions NV/SA (BE), Ingenico do Brasil Ltda., Ingenico Holdings Asia II Limited (HK), Stichting Beheer Derdengelden Ingenico Financial Solutions (IFS Fondation)
  • Chairman of the Supervisory Board and member of the Audit Committee, Global Collect Services B.V.
  • Director, Fixed & Mobile Pte. Ltd., Fixed & Mobile Holdings Pte. Ltd., Ingenico Corp.
  • Chairman, Ingenico Business Support S.A.S., Ingenico 5 S.A.S.
  • Director, Bambora Top Holding AB, Ingenico International (Singapore) Pte. Ltd., Ingenico Japan Co. Ltd.

Sharon MacBEATH


CH02_COA2020_Photo_Admin_MACBEATH_HD.png


British national

Age: 53

Attendance rate at Board meetings: 90%

Attendance rate at appointments and compensation committee meetings: 100%

Expiration date of the term of office: Ordinary Shareholders’ Meeting called to approve the financial statements for the financial year ended December 31, 2025

Independent director

since July 1, 2014

Curriculum Vitae

Sharon MacBeath has a degree in psychology and management from the University of Glasgow, holds a Master’s degree in human resources from the Sorbonne, and an EMBA from INSEAD. After founding the consulting firm EMDS, which specialises in the recruitment, selection and development of highly promising young people with international profiles, she has worked in France since 1991 in human resources. She held the position of Director of Human Resources for the pharmacy and beauty line of the Rexam group before becoming Director of Human Resources and Communications for Redcats, a company in the Kering group (formerly PPR) in 2005. Sharon MacBeath was Head of Human Resources and a member of the Executive Committee of the Rexel group between 2013 and the end of 2016. She was a member of the Board and Head of Human Resources at the Tarkett group from January 2017, before moving from a role as director on the Supervisory Board at Hermès International* to the role of Group Human Resources Director at Hermès International in June 2019. Sharon MacBeath is a member of Hermès’ Executive Committee.

Principal offices and duties outside Coface Group

During financial year 2022

  • Group HR Director of Hermès International (7) since June 17, 2019

During the past five years and which are no longer held

  • Group Director of Human Resources, member of the Executive Committee of Rexel (1)
  • Member of the Board and Executive Committee, Director of Human Resources and Communications for the Tarkett group (1) (until May 1, 2019)
  • Director on the Supervisory Board, Hermès International (1) until March 2019
  • Member of the Hermès International (1) Audit Committee until March 2019
  • Member of the Nominations, Compensation and Governance Committee of Hermès International (1) until March 2019

Laurent MUSY


COA2022_URD_FR_ADMIN_LM_p06_HD.png


French national

Age: 56

Attendance rate at Board meetings: 100%

Attendance rate at Risk Committee meetings: 100%

Expiration date of the term of office: Ordinary Shareholders’ Meeting called to approve the financial statements for the financial year ended December 31, 2025

Independent director

since May 17, 2022

Curriculum Vitae

Laurent Musy is an engineer, a graduate of the École des mines de Paris, and holds an MBA from INSEAD. Since 2015, he has been Chairman and Chief Executive Officer of TERREAL Group. He joined Terreal after 17 years in the aluminium industry in France and abroad, most recently as President of the Packaging and Automotive divisions, then of Aerospace and Transportation at Constellium. He previously worked at Saint-Gobain and McKinsey. From June 2018 until June 2022, he was Chairman of the French Federation for Roof Tiles & Bricks (FFTB). He is a director of IB2.

Principal offices and duties outside Coface Group

During financial year 2022

  • Member of the Board of Directors: IB2, Promodul, Promotoit, FFTB and CTMNC
  • Chairman: Terreal Holding, Terreal España, Terreal Investissements, Terreal Participations, OGT Invest, Quaterreal, CTMCC and Atout Terreal
  • Chairman of the Board: Terreal Italy
  • Managing Director: Creaton SEE and Creaton Benelux
  • Director: Terreal Singapore and Terreal Malaysia
  • Member of the Board: Creaton Polska and Ludowici Roof Tile
  • Advisory Board Member: Creaton Gmbh

During the past five years and which are no longer held

  • FFTB (Chairman until June 2022)
  • CTMNC (Chairman until June 2022)


Nicolas PAPADOPOULO


CH02_COA2020_Photo_Admin_PAPADOPOULO_HD.png


French national

Age: 60

Attendance rate at Board meetings: 90%

Attendance rate at appointments and compensation committee meetings: 100%

Expiration date of the term of office: Ordinary Shareholders’ Meeting called to approve the financial statements for the financial year ended December 31, 2024

Director

since February 10, 2021

Curriculum Vitae

Nicolas Papadopoulo is Chairman and Underwriting and Claims Director of Arch Capital Group Ltd. He was promoted to this position on January 1, 2021. From September 2017 to December 2020, he was Chairman and CEO of Arch Worldwide insurance group and Underwriting Director for property and casualty insurance operations. From July 2014 to September 2017, Nicolas Papadopoulo was Chairman and CEO Arch Reinsurance Group at Arch Capital Group Ltd. He joined Arch Reinsurance Ltd. in December 2001, where he held various underwriting positions. Before joining Arch, he held positions within the reinsurance group Sorema N.A., a US subsidiary of Groupama, and was also an insurance examiner at the French Ministry of Finance, Insurance Department. Nicolas Papadopoulo is a graduate of the École Polytechnique and the École Nationale de la Statistique et de l’Administration Économique with a master’s degree in statistics. He is also a member of the International Actuarial Association and a member of the French Actuarial Society.

Principal offices and duties outside Coface Group

During financial year 2022

  • Chairman and Underwriting and Claims Director of Arch Capital Group Ltd. (8)
  • Director, Greysbridge Holdings Ltd.
  • Director, Somers Re Ltd. (formerly Watford Re Ltd.)
  • Director, Somers Group Holdings Ltd. (formerly Watford Holdings Ltd.)
  • Director, Premia Holdings Ltd.

During the past five years and which are no longer held

  • Director, Arch Insurance Group Inc.
  • Director, Arch Insurance Company
  • Director, Arch Indemnity Insurance Company
  • Director, Arch Specialty Insurance Company
  • Director, Arch Property Casualty Insurance Company
  • Director, Arch LMI Pty Ltd
  • Director, Arch Financial Holdings Australia Pty Ltd
  • Director, Arch MI (Asia) Limited,
  • Director of Ventus Risk Management, Inc.
  • Director, Out Of Towne, LLC
  • Director, Arch Underwriters Ltd.
  • Director, Arch Reinsurance Ltd.

2.1.3Operation of the Board of Directors

The Board of Directors has established Internal Rules which can be consulted on the website at http://www.coface.com/Group/Our-organisation, in the Board of Directors tab.

Convening notice of the Board of Directors

The Board of Directors meets as often as required in the interests of the Company, and at least once per quarter.

Board meetings are convened by the Chairman. However, directors representing at least one third of the Board members may convene a meeting of the Board, detailing the agenda, if there has been no meeting for more than two months. Where the duties of CEO are not performed by the Chairman, the Chief Executive Officer may also ask the Chairman to convene a Board meeting to consider a fixed agenda.

Board meetings are held either at the registered office or any other location indicated in the convening notice. From March 2020 and until July 2022, Board of Directors’ meetings were mainly held by video-conferencing or telecommunications because of the Covid-19 pandemic. The convening notice is in the form of a simple letter or e-mail sent to the Board members within a reasonable period of time before the scheduled date of the meeting. It is sent out by the Board Secretary.

In the event of an emergency as defined below (“Emergency”), the following accelerated procedure may be applied.

An Emergency is defined as an exceptional situation (i) marked by the existence of a brief period of time, imposed by a third party on penalty of being time-barred, and for which a failure to comply could result in harm to the Company or one of its subsidiaries or (ii) which requires a quick response from the Company that is incompatible with the application of the Board of Directors’ usual time frame for a convening notice.

In an Emergency, the meeting may be convened using all appropriate methods, even verbally, and the time frames for convening and holding the meeting of the Board of Directors shall not be subject to the provisions described above, insofar as the Chairman of the Board of Directors of the Company has:

  • first sent notice to the directors providing the basis for the Emergency as defined above; and
  • sent all directors, with the convening notice for said Board meeting, all the information needed for their analysis.
Conduct of the Board of Directors’ meetings

Meetings of the Board of Directors are chaired by the Chairman of the Board of Directors or, in his absence, by the oldest director or by one of the Vice-Chairmen, as the case may be.

In accordance with the legal and regulatory provisions, and except when adopting decisions relating to the review and closing of the annual parent company and consolidated financial statements, directors participating in the Board meeting by video conference or telecommunication that meet the technical criteria set by the current legal and regulatory provisions are deemed to be present for the purposes of calculating the quorum and the majority.

Each meeting of the Board of Directors must be long enough for useful and in-depth debate on the agenda. Decisions are made by a majority of the votes of the members present or represented. In the event of a tie, the Chairman of the Board of Directors shall have the casting vote.

In the event of a malfunction in the video conference or telecommunications system, as noted by the Chairman of the Board of Directors, the Board may make valid decisions and/or move forward with just the members who are physically present, provided that the quorum conditions are met.

Informing the Board of Directors

Pursuant to the terms of Article 21 of the Company’s Articles of Association, and Article 3.4 of the Board of Directors’ Internal Rules, the Board carries out the inspections and verifications which it deems necessary. The Chairman or the Chief Executive Officer must send each director all the documents and information needed to fulfil their duties.

The directors must have access to the information that will allow them to make an informed decision, sufficiently in advance of the meeting of the Board of Directors. However, for urgent matters, or when respect for confidentiality so requires, and in particular when sensitive strategic, commercial or financial information is at issue, this information may be provided during the meeting. Directors shall likewise receive, if they so request, a copy of the minutes of the Board of Directors’ deliberations.

Furthermore, the directors receive all useful information on the events or operations which are significant for the Company in between meetings.

The Company has set up a Group-level governance system based on a clear separation of responsibilities with a system for the provision of information. This governance system includes the following key functions: the risk management, compliance, internal audit and actuarial functions (see Section 5.3.1 “Internal control system”). Each key function operates under the ultimate responsibility of the Board of Directors, to which it reports.

  • Information at the initiative of the Board of Directors.
  • The Board of Directors consults key function managers, directly and at its own initiative, whenever it deems this necessary and at least once a year. This consultation can take place in the absence of the Chief Executive Officer if the Board members consider it necessary. The Board of Directors may refer this consultation to a specialised Board committee.
  • Information at the initiative of a Head of a key function.
  • The Heads of functions may inform the Board of Directors, directly and at their own initiative, of the occurrence of certain events that warrant this action. They must do so immediately upon encountering a major problem that falls within their purview. The Head of the key function must send a written report of the problem to the Chairman. The report must include a detailed explanation of the problem as well as all the elements required to understand it. The report must include recommendations for resolving the problem. The Chairman then communicates this report to the Board members.

2.1.4Activities of the Board of Directors in 2022

The Board of Directors held nine meetings in a Board of Directors format. A presentation of IFRS 17 and training in this new accounting standard were offered to members after two of these meetings. It also held a strategic seminar devoted to a more in-depth review of the themes of the company’s strategic plan presented in February 2020.

The average attendance rate was 95% (including the attendance rates of Olivier Zarrouati (75%) and Éric Hémar (75%) whose mandates expired in 2022, the average attendance rate would be 92%).

The main subjects reviewed by the Board of Directors in 2022 were:

The Company’s financial position, 
cash and exposure

  • Approval of the 2021 annual financial statements (parent company and consolidated statements)
  • Review of quarterly and half-yearly financial statements
  • Approval of the 2023 budget

Internal control/Risks

  • Solvency II: approval of all written policies as drafted or revised in 2022
  • Regulatory reports: ORSA, RSR, SFCR and actuarial reports
  • Risk appetite

Corporate governance

  • Convening of a Combined Shareholders’ Meeting on May 17, 2022
  • Self-assessment of the Board’s work
  • Review of related party agreements entered into in previous years
  • New composition of the Board’s committees following the reappointment of a director and the appointment of two new directors at the Combined Shareholders’ Meeting of May 17, 2022
  • Assessment of the independence of directors

Compensation

  • Compensation policy for the Chief Executive Officer, Chairman and Directors for 2022
  • Compensation paid to the Chief Executive Officer for financial year 2021
  • Approval of the 2022 Long-Term Incentive Plan
  • Delivery of the 2019 Long-Term Incentive Plan
  • Good leaver clause

Financial operations

  • Annual authorisation to issue guarantees as part of the factoring business
  • Liquidity programme
  • Authorisation to proceed with a subordinated bond issue and an offer to redeem existing subordinated bonds

Corporate strategy

  • Update on the situation created by the war in Ukraine
  • Economic outlook
  • Approval of the Group’s reinsurance policy

Business lines

  • Presentation of the Mediterranean and Africa region

Corporate Social Responsibility

  • Carbon footprint presentation

2.1.5Diversity policy applied to the members of the Board of Directors

The Company is vigilant with regard to the diversity of the members of its Board of Directors to ensure that it operates in a manner appropriate to the Company’s business and development, in compliance with applicable regulations. The Company also refers to the provisions of the Corporate Governance Code of Listed Companies (AFEP-MEDEF Code) in implementing its diversity policy. Several criteria are applied:

  • Number of directors
  • The number must reflect the size of the Company and the aforementioned diversity. In 2022, there were ten directors.
  • Seniority and age of directors
  • The Company complies with regulations on the terms of directorships and strives to have a wide range of ages represented on its Board. In 2022, the average age of directors was 53.
  • Proportion of independent and non-independent members
  • The Company complies with the rules applicable to companies with many shareholders and no controlling shareholder. Independent directors account for 60% of Board members. Two thirds of the directors, including the Chairman, sitting on the Audit and Accounts Committee and the Appointments, Compensation and CSR Committee are independent directors. Three-quarter of members of the Risk Committee are independent directors, including the Chairman.
  • International diversity
  • The Company takes into account international diversity and at December 31, 2022, 50% of directors were non-French nationals.
  • Gender equality
  • In 2022, the proportion of women on the Board was 50%.
  • Skills and expertise
  • The Company ensures its directors possess specific skills in certain fields to ensure that the Board has the requisite expertise in terms of finance, insurance regulations, human resources and digital technology.

2.1.6Assessment of the Board’s work in financial year 2022

As in previous years, COFACE assessed the work of its Board of Directors and its specialised committees, in accordance with the recommendations of the Corporate Governance Code of Listed Companies (AFEP-MEDEF Code).

The assessment for the 2022 financial year was carried out via a questionnaire and focused on the following themes:

  • the composition of the Board of Directors;
  • the organisation of Board of Directors’ meetings;
  • the quality of the information given to the Board;
  • the quality of the discussions;
  • the composition and operation of the specialised committees;
  • interaction between directors and with the Chief Executive Officer;
  • the individual contribution of each Board member.

In general, the Board's overall performance is judged to be satisfactory or very satisfactory in terms of the organisation of the Board and its work, the quality of the documentation provided, the involvement and competence of the directors, including their collaborative spirit, the responses obtained from the Company to their questions, and the relationship of trust with the Chairman and the Chief Executive Officer.

For 2023, it was recommended that more emphasis be placed on the following topics: cyber security, operational risk, information products, CSR, presentations by regional managers, human resources policy, business development and acquisition strategy.

It was also suggested that more informal events should be organised to ensure a better knowledge between directors.

2.1.7Analysis of the independence of members of the Board of Directors

Pursuant to the AFEP-MEDEF Code, the Board of Directors must review the status of independent directors every year. As such, during the meeting of December 8, 2022, the Board was asked to examine the situation of the six (6) directors who are not members of ARCH Group with regard to the criteria set out in the code. For each director concerned, this assessment is based on the independence criteria set out in the AFEP-MEDEF Code and the analysis of the High Committee on Corporate Governance (HCGE) included in the Guide to Applying the AFEP-MEDEF Code, which was revised in December 2022.

In order to evaluate the independence of directors, and in the absence of any other dependence criteria, Coface attaches particular importance to any business relationship with a company in which the directors hold senior management positions.

A review of all the criteria set out in the code, as mentioned in the table below, showed that Bernardo Sanchez Incera, Isabelle Laforgue and Sharon MacBeath currently do not meet any of the criteria of dependence. Nathalie Lomon, Laurent Musy and Laetitia Léonard-Reuter, who respectively hold management positions at SEB, Terreal and Generali, must be considered with regard to the business relationship between Coface and these companies. It is recalled that in these circumstances, Coface assesses any impact this business relationship could have on the director’s independent judgement. To do this, Coface analyses a range of items, including the nature of the business, the size of the contract, the existence of an alternative provider for the director’s company, and the importance of the turnover generated for Coface by this business relationship.

SEB is a Coface policyholder. However, the analysis did not identify any dependent relationship between the two companies. The premiums paid by SEB amount to less than 1% of Coface’s total premium income. Competition on the credit insurance market provides SEB with an alternative in the event of a termination in its relations with Coface. This affiliation does not therefore affect the independence of Nathalie Lomon.

Terreal Group is a Coface client in credit insurance and surety bonds, for a limited volume and premium amount in both cases. It also has a business information contract in Poland. All of Coface’s resulting revenues amounted to a little under 0.004% of turnover. Terreal also has alternatives on the French market. This situation therefore does not affect the independence of Laurent Musy.

Generali is not a policyholder, but has concluded half a dozen distribution agreements with Coface in different countries (Malaysia, Germany, Italy, Hungary, Portugal). To date, these partnerships are limited. The resulting annual revenues represent less than 0,02% of Coface turnover, and a very limited amount for Generali. This relationship therefore does not affect the independence of Laetitia Léonard-Reuter.

Criteria to be assessed

Bernardo Sanchez Incera

Laetitia Léonard-Reuter

Isabelle Laforgue

Nathalie Lomon

Sharon MacBeath

Laurent Musy

Not to hold or have held an employee position or a corporate mandate within the past five years in Arch Capital Group Ltd., Coface, or one of its subsidiaries.

Not to be a corporate officer of a company in which Coface directly or indirectly holds a directorship or in which an employee or corporate officer of Coface (in position currently or within the past five years) holds a directorship.

Not to be a client, supplier, corporate banker, significant investment banker of the Company or its group, or for which the Company or its group represents a significant proportion of the business.

Not to have a close family tie to a corporate officer.

Not to have been an auditor of Coface over the past five years.

Not to have been a director of Coface for more than 12 years.

Not to be a director representing a significant shareholder of Coface or Arch Capital Group Ltd.

Not to receive or have received significant supplementary compensation from Coface or from the Group outside of the compensation paid for attendance at meetings of the Board of Directors and its committees, including participation in any form of stock options, or any other form of performance-linked compensation.

The percentage of independent directors on the Board was 60% as at December 31, 2022.

2.1.8Specialised committees, offshoots of the Board of Directors

Pursuant to Article 18 of the Company’s Articles of Association, the Board of Directors may decide to form, with or without the participation of individuals who are not directors, committees or commissions to examine issues that the Board itself or its Chairman refers for their assessment. These committees or commissions perform their duties under its responsibility.

The Board of Directors has established an Audit and Accounts Committee, a Risk Committee, and an Appointments, Compensation and CSR Committee, whose composition, powers and rules of operation are described below.

In accordance with the recommendation of the Corporate Governance High Committee (HCGE) dated August 31, 2021, the internal rules have been amended to incorporate the possibility for Board Committees to request external technical studies on matters falling within their remit, at the company’s expense, after having informed the Chairman of the Board of Directors or the Board. The Committees shall report to the Board on the conclusions thereof.

Audit and Accounts Committee

During financial year 2022, the members of the Audit and Accounts Committee were Laetitia Léonard-Reuter (Chairman), David Gansberg and Isabelle Laforgue.

Two thirds of the members of the Audit and Accounts Committee are independent members of the Board of Directors. It thus conforms to the recommendation of the AFEP-MEDEF Code according to which this committee must have a majority of independent members.

Composition (Article 1 of the Audit and Accounts Committee Internal Rules)
  • Members
  • The Audit and Accounts Committee shall comprise at least three members, who have the appropriate and requisite qualifications to exercise their functions effectively, including particular expertise in financial or accounting matters. They are appointed from among the directors of the Company for the duration of their term of office as members of the Board of Directors.
  • At least two-thirds of the members of the Audit and Accounts Committee are independent members of the Board of Directors.
  • Chairman
  • The Chairman of the Audit and Accounts Committee will be one of the members of the Audit and Accounts Committee nominated by the Company’s Board of Directors from among the independent members for the duration of his/her term of office as a director.
  • The Chairman of the Audit and Accounts Committee will exercise his/her functions in accordance with the Audit and Accounts Committee Internal Rules.
  • The Chairman of the Audit and Accounts Committee will set the dates, times and places of the meetings of the Audit and Accounts Committee, set the agenda and chair its meetings. The convening notices for the meetings will be sent by the Committee’s Secretary,
  • who reports to the Board of Directors on the opinions and recommendations expressed by the Audit and Accounts Committee for the Board of Directors to consider.
  • The Chairman of the Audit and Accounts Committee will ensure that the preparation and due process of the work of the Audit and Accounts Committee is monitored between each of its meetings.
Duties (Article 3 of the Audit and Accounts Committee Internal Rules)

The role of the Audit and Accounts Committee is to ensure that matters concerning the development and verification of accounting and financial information are monitored, in order to facilitate the Board of Directors’ duties of control and verification. In this regard, the committee issues opinions and/or recommendations to the Board of Directors.

Accordingly, the Audit and Accounts Committee will, in particular, exercise the following principal functions:

  • Monitoring the preparation of financial information
  • The Audit and Accounts Committee must examine the annual or half-year parent company and consolidated financial statements before they are presented to the Board of Directors, to ensure the accounting methods used to prepare these financial statements are appropriate and consistent.
  • The Audit and Accounts Committee reviews in particular the level of technical provisions and any situations that could create a significant risk for the Group, as well as all financial information and quarterly, half-year or annual reports on the Company’s business, or that produced for a specific transaction (such as an asset contribution, merger or market transaction).
  • It reviews the accounting treatment of all major transactions.
  • The examination of the financial statements is accompanied by a presentation by the Statutory Auditors indicating the key points not only of the results of the statutory audit, in particular the audit adjustments and significant weaknesses in internal control identified during the audit, but also of the accounting methods used, as well as a presentation by the Chief Financial Officer describing the Company’s risk exposure and its material off-balance sheet commitments.

It examines the scope of consolidated companies.

  • Monitoring the control of the external audit of financial statements
  • The Audit and Accounts Committee is responsible for monitoring the statutory audit of the parent company and consolidated financial statements by the Company’s Statutory Auditors.
  • The Audit and Accounts Committee has regular discussions with the Statutory Auditors during the Audit and Accounts Committee meetings dealing with the review of the procedures for preparing financial information and the review of the financial statements in order to report on their performance and the conclusions of their work.
  • The Audit and Accounts Committee also monitors the Company’s Statutory Auditors (including without the presence of the executives), in particular their working schedule, potential difficulties encountered in the exercise of their duties, modifications which they believe should be made to the Company’s financial statements or other accounting documents, irregularities, anomalies or accounting inaccuracies which they may have identified, uncertainties and material risks relating to the preparation and treatment of accounting and financial information, and material weaknesses in internal control that they may have discovered.
  • It is responsible for monitoring the independence of the Statutory Auditors and ensuring compliance with the professional code of conduct.
  • The Audit and Accounts Committee shall meet the Statutory Auditors at least once a year without the presence of senior management. In this respect, the Audit and Accounts Committee also reviews, with the Statutory Auditors, the risks affecting their independence and the preventive measures taken to mitigate such risks. It must, in particular, ensure that the amount of the fees paid by the Company and the Group, or the share of such fees in the revenues of the firms and their networks, would not impair the independence of the Statutory Auditors.

At the same time, the Statutory Auditors will also present to the Audit and Accounts Committee a report on compliance with their obligations regarding the professional code of conduct for Statutory Auditors and with professional auditing standards.

To this end, the Audit and Accounts Committee must, in particular, ask to receive each year:

  • the Statutory Auditors’ statement of independence;
  • the amount of the fees paid to the network of Statutory Auditors by the companies controlled by the Company or the entity controlling the Company in respect of services that are not directly related to the Statutory Auditors’ duties; and
  • information concerning the benefits received for services directly related to the Statutory Auditors’ duties.
  • Selection and renewal of the Statutory Auditors
  • The Audit and Accounts Committee oversees the selection and renewal of the Statutory Auditors, and submits the result of this selection to the Board of Directors. When the Statutory Auditors’ term expires, the selection or renewal of the Statutory Auditors may be preceded, at the suggestion of the Audit and Accounts Committee and the decision of the Board of Directors, by a call for tenders overseen by the Audit and Accounts Committee, which will approve the specifications and choice of firms consulted, and ensure the selection of the “best bidder” and not the “lowest bidder”.
  • The Audit and Accounts Committee reports regularly on the exercise of its duties to the Board of Directors and informs it without delay of any difficulties encountered.
  • Approval of the provision by the Statutory Auditors of services other than account certification
  • Pursuant to the provisions of Article L.822-11-2 of the French Commercial Code, the committee approves the provision by the Company’s Statutory Auditors of services other than account certification. In this case, it makes this decision after having reviewed the risks affecting the independence of the Statutory Auditors and the preventive measures taken by the Statutory Auditor in this regard.
  • Internal control duties
  • The Audit and Accounts Committee provides its opinion on the organisation of the Audit Department.
  • The committee receives a copy of the Company’s annual audit plan. It reviews this plan, in cooperation with the Risk Committee.
  • It is responsible for monitoring internal audit recommendations. It receives regular summary reports from management.
  • Annual budget
  • Before the beginning of each financial year, it reviews the Company’s draft budget and monitors the budget process throughout the financial year.
Operation (Article 2 of the Audit and Accounts Committee Internal Rules)
  • Frequency of meetings and procedures for convening meetings
  • The Audit and Accounts Committee is convened whenever necessary and at least four times a year. The Audit and Accounts Committee will, in particular, meet prior to each Board meeting if the agenda includes the examination of a matter within its remit and sufficiently in advance (at least two days) of any Board meeting for which it is preparing resolutions.
    • Ordinary convening of meetings
    • Meetings of the Audit and Accounts Committee are called in writing, with convening notices issued by the committee’s Secretary and sent to each member. The Chairman of the Company’s Board of Directors may, as necessary, refer a matter to the Chairman of the Audit and Accounts Committee and request the convening of said committee to discuss a specific agenda.
    • Extraordinary convening of meetings
    • Two members of the Audit and Accounts Committee may ask its Chairman to convene a meeting of the committee to discuss a certain agenda or to add one or more points to the agenda in accordance with the limits and powers of said committee. In the event that the Chairman of the Audit and Accounts Committee does not grant this request within a period of 15 days, the two members may convene the Audit and Accounts Committee and set the agenda for its meeting.
    • If the Company’s Statutory Auditors consider there is an event which exposes the Company or its subsidiaries to a significant risk, they may ask the Chairman of the Audit and Accounts Committee to convene a meeting of said committee.
    • Form and timing for convening meetings
    • The notice convening the Audit and Accounts Committee contains the detailed agenda for the meeting and is sent to the members of the Audit and Accounts Committee with reasonable prior notice. The information allowing the members of the Audit and Accounts Committee to issue informed advice during this meeting is sent to the members of said committee, to the extent possible, sufficiently in advance of the meeting.
    • In case of an urgent matter, the Audit and Accounts Committee may be convened at any time by its Chairman, acting under an exceptional procedure. In this case, the Audit and Accounts Committee meeting does not need to comply with the time limits for the above convening notice as long as the urgent matter is declared in the convening notice and the information allowing the members of the Audit and Accounts Committee to issue informed advice has been sent prior to the meeting.
  • Attendance at Audit and Accounts Committee meetings
  • If any member is unable to attend a meeting of the Audit and Accounts Committee, he or she may participate in the meeting by telephone or video conference.
  • Only the members and the Secretary of the Audit and Accounts Committee are entitled to attend its meetings.
  • At the Chairman’s proposal, the Audit and Accounts Committee may invite to any of its meetings any executive of the Company (including an executive of any of the principal subsidiaries) capable of informing the work of the Audit and Accounts Committee, as well as the Statutory Auditors of the Company.
  • Quorum and majority rule
  • The opinions and recommendations expressed by the Audit and Accounts Committee can only be valid if at least half of its members (including the Chairman) are present.
  • No member of the Audit and Accounts Committee may represent another member.
  • The opinions and recommendations of the Audit and Accounts Committee will be adopted if the Chairman and the majority of members present at the meeting vote in favour.
  • Secretariat and minutes of meetings
  • The Secretary of the Company’s Board of Directors is responsible for the secretariat of the Audit and Accounts Committee.
  • The opinions and recommendations of the Audit and Accounts Committee will be included in a written report. One copy of the report will be sent to all members of the Audit and Accounts Committee and another, if required, will be sent by the Chairman to the directors of the Company.
Activity of the Audit and Accounts Committee

The Audit and Accounts Committee met five times in 2022. The average attendance rate was 88% (this participation rate includes a rate of 50% for Éric Hémar, the other directors each had a 100% attendance rate).

Its main work included:

  • the approval of the annual financial statements for the 2021 financial year;
  • an examination of the quarterly and half-yearly financial statements for the 2022 financial year;
  • the IFRS 17 project;
  • a review of off-balance sheet commitments;
  • the approval of the internal audit policy;
  • the presentation of the 2023 budget;
  • the examination and approval of the 2023 audit plan;
  • regular updates on the audit activity.
Risk Committee

The principle of a Risk Committee was decided by the Board of Directors during its meeting of April 24, 2018.

In 2022, the Risk Committee was composed of Nathalie Lomon (Chairman), Janice Englesbe, Isabelle Laforgue and Laurent Musy.

Composition (Article 1 of the Risk Committee Internal Rules)
  • Members
  • The Risk Committee shall comprise at least three members, who have the appropriate and requisite qualifications to exercise their functions effectively, including expertise in risk management. They are appointed from among the directors of the Company for the duration of their term of office as members of the Board of Directors.
  • The Risk Committee has a majority of independent members from the Board of Directors.
  • Chairman
  • The Chairman of the Risk Committee is an independent member of the Risk Committee nominated by the Board of Directors for the duration of his/her term of office as a director.
  • The Chairman exercises his/her functions in accordance with the Internal Rules of the Risk Committee.
  • The Chairman of the Risk Committee sets the dates, times and places of its meetings, establishes the agenda and chairs its meetings. The convening notices for the meetings are sent by the Risk Committee Secretary,
  • who reports to the Board of Directors on the opinions and recommendations expressed by the Risk Committee for the Board of Directors to consider.
  • The Chairman of the Risk Committee will ensure that the preparation and due process of the work of the Risk Committee are monitored between each of its meetings.
Duties (Article 3 of the Risk Committee Internal Rules)

The role of the Risk Committee is to ensure that the risk management and monitoring mechanisms are effective and that there are efficient operational internal control measures in place, to review the compliance of reports sent to the regulator, monitor the management of the Group’s capital requirements, and monitor the implementation of recommendations from internal audits of areas under its responsibility. The Risk Committee carries out all of these duties in order to facilitate the Board of Directors’ duties of control and verification. In this regard, the committee issues opinions and/or recommendations to the Board of Directors.

Accordingly, the principal functions of the Risk Committee include the following:

  • Efficiency of risk management systems
  • The Risk Committee reviews the major asset and liability risks (including subscription risks, market risk and funding risk), and ensures that effective monitoring and management mechanisms are in place. In this regard, it evaluates the various risk management policies on an annual basis.
  • Each year, it reviews the internal assessment carried out by the Company of its risks and solvency (ORSA).
  • It is kept updated on the Company’s risk appetite.
  • It receives and reviews the results and updates of risk mapping carried out by the Company.
  • Review of all regulatory reports relating to the Company
  • The Risk Committee receives and reviews the regulatory reports required under regulations (in particular SFCR, RSR, anti-money laundering report, actuarial reports), before they are approved by the Board.
  • Changes in prudential regulations
  • The Risk Committee is informed of any regulatory changes that may have an impact on the Group’s solvency or governance. It is also informed of solutions introduced to reduce any negative effects of these changes.
  • Compliance
  • The Committee monitors the activity of the compliance function on an ongoing basis. It receives results of Level 1 and Level 2 compliance controls.
  • The committee is responsible for monitoring the Group’s capital requirements.
  • It monitors, in particular, the drafting of the partial internal model, the compilation of the file for the regulator, and the results of the model.
  • It also examines the governance and major changes to the model.
  • The committee ensures that all Level 1 and Level 2 operational controls are in place.
  • It receives a summary of the results of these controls. It is informed of action plans implemented following these controls and is regularly updated on the progress of these action plans.
  • The Risk Committee is informed of any loopholes in the internal control system and of the corrective actions implemented to address them. It is informed of the actual implementation of these corrective actions.
Operation (Article 2 of the Risk Committee Internal Rules)
  • Frequency of meetings and procedures for convening meetings
  • The Risk Committee will be convened whenever necessary and at least four times a year. The Risk Committee will, in particular, meet prior to each Board meeting if the agenda includes the examination of a matter within its remit and sufficiently in advance (at least two days) of any Board meeting for which it is preparing resolutions.
    • Ordinary convening of meetings
    • Meetings of the Risk Committee are called in writing, with convening notices issued by the committee’s Secretary under the conditions set out in paragraph 3, Section 1 b) of the Risk Committee Internal Rules and sent to each member. The Chairman of the Company’s Board of Directors may, as necessary, refer a matter to the Chairman of the Risk Committee and ask them to meet with said committee to discuss a specific agenda.
    • Extraordinary convening of meetings
    • Two members of the Risk Committee may ask its Chairman to convene a meeting of the committee to discuss a certain agenda or to add one or more points to the agenda in accordance with the limits and powers of said committee. In the event that the Chairman of the Risk Committee does not grant this request within a period of 15 days, the two members may convene the Risk Committee and set its agenda.
    • If the Company’s Statutory Auditors consider there is an event which exposes the Company or its subsidiaries to a significant risk, they may ask the Chairman of the Risk Committee to convene a meeting of said committee.
    • Form and timing for convening meetings
    • The notice convening the Risk Committee contains the detailed agenda for the meeting and is sent to the members of the Risk Committee with reasonable prior notice. The information allowing the members of the Risk Committee to issue informed advice during this meeting is sent to the members of said committee, to the extent possible, sufficiently in advance of the meeting.
    • In case of an urgent matter, the Risk Committee may be convened at any time by its Chairman, acting under an exceptional procedure. In this case, the Risk Committee meeting does not need to comply with the time limits for the above convening notice as long as the urgent matter is declared in the convening notice and the information allowing the members of the Risk Committee to issue informed advice has been sent prior to the meeting.
  • Attendance at Risk Committee meetings
  • If any member is unable to attend a meeting of the Risk Committee, he or she may participate in the meeting by telephone or video conference.
  • Only the members and the Secretary of the Risk Committee are entitled to attend its meetings.
  • At the Chairman’s proposal, the Risk Committee may invite to any of its meetings any executive of the Company (including an executive of any of the principal subsidiaries) capable of informing the work of the Risk Committee, as well as the Statutory Auditors of the Company.
  • Quorum and majority rule
  • The opinions and recommendations expressed by the Risk Committee can only be valid if at least half of its members (including the Chairman) are present.
  • No member of the Risk Committee may represent another member.
  • The opinions and recommendations of the Risk Committee will be adopted if the Chairman and the majority of members present at the meeting vote in favour.
  • Secretariat and minutes of meetings
  • The Secretary of the Company’s Board of Directors will be responsible for the secretariat of the Risk Committee.
  • The opinions and recommendations of the Risk Committee will be included in a written report. One copy of the report will be sent to all members of the Risk Committee and another, if required, will be sent by the Chairman to the directors of the Company.
Activity of the Risk Committee

The Risk Committee met five times in 2022. The average attendance rate was 100%.

It considered:

  • the overall risk map and internal control system;
  • the Russia/Ukraine situation;
  • the partial internal model;
  • risk policies;
  • risk appetite indicators;
  • regulatory reports: ORSA, RSR and SFCR and the anti-money laundering report;
  • compliance actions;
  • actuarial reports;
  • the Cyber Resilience mission;
  • regulatory news;
  • the refinancing of subordinated debt issued in 2014.
Appointments, Compensation and CSR Committee

The principle of an Appointments and Compensation Committee was decided by the Board of Directors during its meeting of July 15, 2014. The Appointments and Compensation Committee is made up of Sharon MacBeath (Chairman), Bernardo Sanchez Incera and Nicolas Papadopoulo.

The Appointments and Compensation Committee is chaired by an independent director, and two thirds of the committee are independent members of the Board of Directors. It thus conforms to the recommendation of the AFEP-MEDEF Code according to which this committee must have a majority of independent members.

Since February 2023, the Committee is also responsible of examining the strategies and actions carried out by the Company in the field of CSR.

Composition (Article 1 of the Appointments, Compensation and CSR Committee Internal Rules)
  • Members
  • The Appointments, Compensation and CSR Committee has at least three members, appointed from among the members of the Company’s Board of Directors for the duration of their term as director.
  • The Appointments, Compensation and CSR Committee shall comprise 2/3 of independent members of the Board of Directors who are competent to analyse compensation-related policies and practices and the company’s risk policy.
  • Chairman
  • The Chairman of the Appointments, Compensation and CSR Committee will be one of the members of the Appointments, Compensation and CSR Committee nominated by the Company’s Board of Directors from among the independent members for the duration of his/her term of office as director.
  • The Chairman of the Appointments, Compensation and CSR Committee will convene the meetings of the Appointments, Compensation and CSR Committee, determine the agenda and chair the meetings.
  • The Chairman will report to the Board of Directors on the proposals and recommendations put forward by the Appointments, Compensation and CSR Committee in order for the Board of Directors to consider them, and will ensure that the preparation and due process of the work of the Appointments, Compensation and CSR Committee is monitored between each of its meetings.
Duties (Article 3 of the Appointments, Compensation and CSR Committee Internal Rules)
  • Role of the Appointments, Compensation and CSR Committee
  • In all matters relating to the appointment of executives (and separate from any issues related to their compensation), the Chief Executive Officer will be involved in the work of the Appointments, Compensation and CSR Committee.
  • The Appointments, Compensation and CSR Committee shall prepare the resolutions of the Company’s Board of Directors on the following topics:
  • Compensation conditions
  • The Appointments, Compensation and CSR Committee is responsible for formulating proposals for the Company’s Board of Directors concerning:
    • the level and terms of compensation of the Chairman of the Board of Directors, including benefits in kind, retirement and personal protection plans, as well as grants of stock options or warrants, as applicable,
    • the level and terms of compensation of the Chief Executive Officer (CEO), and, as the case may be, the Deputy CEO, including benefits in kind, retirement and personal protection plans, as well as grants of stock options or warrants, as applicable,
    • the rules for the distribution of directors’ attendance fees to be allocated to the Company’s directors and the total amount to be submitted to the approval of the Company’s shareholders, and
    • the compensation policy.
  • Appointment process
  • The Appointments, Compensation and CSR Committee:
    • makes proposals to the Board of Directors regarding the appointment of members of the Board of Directors by the Ordinary Shareholders’ Meeting, and the appointment of the members of General Management,
    • establishes and keeps an up-to-date succession plan for members of the Board of Directors and the key executives of the Company and the Group.
  • In its specific role of appointing members of the Board of Directors, the Appointments, Compensation and CSR Committee shall consider the following criteria: 
  • the desired balance in the membership of the Board of Directors with regard to the composition and evolution of the Company’s ownership; 
  • the desired number of independent Board members; 
  • the proportion of men and women required by current regulations; 
  • the opportunity to renew terms; and 
  • the integrity, competence, experience and independence of each candidate. The Appointments, 
  • Compensation and CSR Committee must also establish a procedure for selecting future independent members and undertake its own evaluation of potential candidates before they are approached in any way.
  • The qualification of an independent member of the Board of Directors is discussed by the Appointments, Compensation and CSR Committee, which drafts a report on the matter for the Board. Each year, in light of this report and prior to the publication of the annual report, the Board of Directors will review each director’s situation with regard to the criteria of independence as defined by the Internal Rules of the Board of Directors.
  • The committee is also responsible for the review, development, implementation and monitoring of the CSR strategy and initiatives.
  • Resources and prerogatives of the Appointments, Compensation and CSR Committee
  • The Appointments, Compensation and CSR Committee receives all documents and information required for the completion of its tasks from the Company’s Chief Executive Officer. It may, moreover, if requested by the Company’s Board of Directors, order any study or analysis by experts outside of the Company relating to the compensation of corporate officers in comparable companies in the banking sector.
Operation (Article 2 of the Appointments, Compensation and CSR Committee Internal Rules)
  • Frequency of meetings and procedures for convening meetings
  • The Appointments, Compensation and CSR Committee is convened whenever necessary and at least once a year. The Appointments, Compensation and CSR Committee will, in particular, meet prior to each Board meeting if the agenda consists of the examination of a matter within its remit and sufficiently in advance of any Board meeting for which it is preparing resolutions.
    • Ordinary convening of meetings
    • Meetings of the Appointments, Compensation and CSR Committee are called by its Chairman, with convening notices sent to each member. The notice of meeting is sent by the Secretary of the Appointments and Compensation Committee. The Chairman of the Company’s Board of Directors may, as necessary, refer a matter to the Chairman of the Appointments, Compensation and CSR Committee and ask them to meet with said committee to discuss a specific agenda.
    • Extraordinary convening of meetings
    • Two members of the Appointments, Compensation and CSR Committee may ask its Chairman to convene a meeting of the committee to discuss a certain agenda or to add one or more points to the agenda in accordance with the limits and powers of said committee. In the event that the Chairman of the Appointments, Compensation and CSR Committee does not grant this request within a period of 15 days, the two members may convene the Appointments, Compensation and CSR Committee and set its agenda.
    • Form and timing for convening meetings
    • The notice convening the Appointments, Compensation and CSR Committee is sent to the members of the Appointments, Compensation and CSR Committee with reasonable prior notice and contains the detailed agenda for the meeting. The information allowing the members of the Appointments, Compensation and CSR Committee to issue informed advice during this meeting is sent to the members of said committee, to the extent possible, sufficiently in advance of the meeting.
  • In case of an urgent matter, the Appointments, Compensation and CSR Committee may be convened at any time by its Chairman, acting under an exceptional procedure. In this case, the Appointments, Compensation and CSR Committee meeting does not need to comply with the time limits for the above convening notice as long as the urgent matter is declared in the convening notice and the information allowing the members of the Appointments, Compensation and CSR Committee to issue informed advice has been sent prior to the meeting.
  • Attendance at meetings of the Appointments, Compensation and CSR Committee
  • Only members of the Appointments, Compensation and CSR Committee are entitled to attend its meetings. The Secretary of the Appointments, Compensation and CSR Committee also participates in these meetings.
  • If any member is unable to attend a meeting of the Appointments, Compensation and CSR Committee, he or she may participate in the meeting by telephone or video conference.
  • Quorum and majority rule
  • The opinions and proposals expressed by the Appointments, Compensation and CSR Committee can only be valid if at least half of its members (including the Chairman) are present.
  • No member of the Appointments, Compensation and CSR Committee may represent another member.
  • The opinions and proposals of the Appointments, Compensation and CSR Committee will be adopted if the majority of the members present, including the Chairman, vote in favour.
  • Secretariat and minutes of meetings
  • The Secretary of the Company’s Board of Directors is responsible for the secretariat of the Appointments, Compensation and CSR Committee.
  • The opinions and proposals of the Appointments, Compensation and CSR Committee will be included in a written report. One copy of the report will be sent to all members of the Appointments, Compensation and CSR Committee and another, if required, will be sent to the directors of the Company.
Activity of the Appointments, Compensation and CSR Committee

The committee met five times in 2022. The average attendance rate was 100%.

It examined and/or set:

  • the compensation policy of the Chairman of the Board for 2022;
  • the compensation policy of the directors for 2022;
  • the compensation policy due or paid to the Chief Executive Officer for 2021;
  • the compensation policy of the Chief Executive Officer for 2022;
  • a Long-Term Incentive Plan (LTIP) for 2022;
  • delivery of the 2019 LTIP;
  • succession plans (including for members of the Executive Committee);
  • the 2022 compensation policy;
  • the review of the implementation of a supplementary pension plan for the members of the Executive Committee;
  • replacement of three directors whose terms expired at the end of the Combined Shareholders’ Meeting of May 17, 2022;
  • the external assessment of the activities of the Board of Directors;
  • the actions implemented by the Human Resources Department.

2.1.9Fitness and probity policy

Fitness

All persons that perform functions as director, executive manager, head of key functions, general manager of a branch, or who have the authority to sign on behalf of the Company, should be fit, under all circumstances, to implement sound and prudent management based on their professional qualifications, knowledge and experience.

The assessment of fitness includes an evaluation of professional diplomas and qualifications, relevant knowledge and experience in the insurance sector, as well as in the sectors of finance, accounting, actuarial services and management. The assessment takes into account the various entrusted tasks.

Furthermore, to assess the fitness of members of the Board of Directors, their training and their experience with respect to their responsibilities are taken into account, in particular the experience acquired as Chairman of a Board or a committee. In appraising each person, the assessment also takes into account the fitness, experience and responsibilities of the other members of the Board of Directors. When terms of office have been previously exercised, fitness is presumed owing to the experience acquired. For new members, the assessment considers the training they may receive throughout their term of office.

The Company ensures that directors collectively have the necessary knowledge and experience in the insurance and financial markets, Group strategy and its economic model, its governance, financial analysis and actuarial system, and the legal and regulatory requirements applicable to the Group, which are appropriate to assume the responsibilities conferred on the Board of Directors.

Probity

Evaluating a person’s probity includes an assessment of his/her honesty and financial strength, based on tangible evidence concerning his/her character, personal behaviour and professional conduct, including any relevant information of a criminal, financial or prudential nature, for the purpose of this assessment.

The functions of director, executive director, head of key function, general manager of a branch, or the authority to sign on behalf of the Company cannot be performed by any person who has been the subject, within the past ten years, of:

  • a final sentence;
  • a final measure of personal bankruptcy or any other final prohibition measure.

Persons serving as executive manager, head of key functions, general manager of a branch, or who have the authority to sign on behalf of the Company, are required to provide as proof, a declaration of absence of bankruptcy and a police record or, failing that, an equivalent document issued by a competent judicial or administrative authority of the original Member State of origin of these persons.

This fitness and probity policy will be applied by all direct or indirect subsidiaries of the Company and may be adapted in line with any stricter local regulations in this area.

The Company’s fitness and probity policy was reviewed on November 29, 2018 and approved by the Board of Directors on December 18, 2018 to extend to independent directors the obligation to provide the Company with a police record to prove their probity.

2.1.10Conflict of interest prevention rules applicable to directors

Pursuant to the Directors’ ethics charter, which can be consulted on the website at http://www.coface.com/Group/Our-organisation, on the Board of Directors tab, a director must inform the Board of Directors of any conflict of interests, including potential conflicts, in which he or she may be directly or indirectly involved. The director shall refrain from participating in discussion and decision-making on the subjects concerned.

The director shall also inform the Chairman of the Appointments, Compensation and CSR Committee of any intention to accept a new directorship in a listed company that does not belong to a group of which the director is an executive, in order to allow the Board of Directors, at the proposal of the Appointments, Compensation and CSR Committee, to decide, if necessary, whether such an appointment would be incompatible with being a director of the Company.

The director shall inform the Chairman of the Board of Directors of any conviction for fraud, any indictment and/or public sanction, and any prohibition to manage or govern that may have been issued against them, as well as any bankruptcy, sequestration or winding-up proceedings in which they may have been involved.

2.1.11Statement of conflicts of interest

To the Company’s knowledge, there is no service contract binding the members of the Board of Directors to the Company or to one of its subsidiaries and providing for the award of benefits.

To the Company’s knowledge, there are no familial ties between the members of the Board of Directors and the other executive corporate officers of the Company.

To the Company’s knowledge, none of the members of the Board of Directors have been convicted of fraud during the last five years. None of these people have participated as a manager in a bankruptcy, sequestration or winding-up proceedings in the last five years, and none of these people were subject to charges and/or an official public sanction handed down by a statutory or regulatory authority (including designated professional bodies). None of these people were prevented by a court from acting as a member of an administrative, management or supervisory body of an issuer, nor from taking part in the management or performance of the business of an issuer in the last five years.

To the Company’s knowledge, as of the date of this Universal Registration Document, there are no potential conflicts of interest between the duties of the members of the Board of Directors and the executive directors of the Company, as regards the Company and their private interests.

To the Company’s knowledge, no pact or agreement has been entered into with any shareholders, clients, suppliers or other parties by virtue of which any member of the Board of Directors or any executive officer of the Company has been appointed in such capacity.

As of the date of this Universal Registration Document, no restrictions have been accepted by the members of the Board of Directors or the executive directors of the Company as concerns the disposal of their interests in the Company’s share capital, with the exception of the rules relating to the prevention of illegal insider trading and the recommendations of the AFEP-MEDEF Code imposing an obligation to retain shares.

2.1.12Code of corporate governance

The Company voluntarily refers to all recommendations of the Corporate Governance Code of Listed Companies (the AFEP-MEDEF Code (9)). The Company makes copies of the AFEP-MEDEF Code available for the members of its corporate bodies at all times.

Within the context of the rule to “comply or explain” provided for by Article L.22-10-10 of the French Commercial Code, and by Article 28.1 of the AFEP-MEDEF Code, the Company believes that its practices comply with the recommendations of the AFEP-MEDEF Code. However, as of the date of publication of the Universal Registration Document, certain recommendations are not applied, for the reasons presented in the following table:

  • The Board of Directors’ rules must specify that any significant operation not covered by the Company’s published strategy must receive the prior approval of the Board (Article 1.9).


The wording of the Board of Directors’ Internal Rules, although slightly different, results in a comparable outcome. Indeed, it stipulates that the following are subject to prior approval by the Board of Directors:

  • extension of the Company’s activities to significant businesses not performed by the Company; and
  • any interest, investment, disposal or any establishment of a joint venture carried out by the Company or one of its significant subsidiaries, for a total amount that is greater than €100 million.
  • At least once a year, a meeting of the Board of Directors shall be organised without the presence of the management (Article 12.3)


Due to the large number of meetings training sessions and seminars held by the Board of Directors and its committes in 2022, it was agreed that additional meetings would not be held without the executive management. However, it is reiterated that such a meeting was held in 2021 and it is planned to organise such meeting in 2023.

  • The Compensation Committee must not include any executive corporate officer (Article 18.1).


The Chairman of the Board of Directors is a member of the Compensation Committee. The Chairman of the Board of Directors has no executive role. He/she shall not participate in discussions or in the vote, if the discussions concern his/her own compensation.

  • The Board of Directors must periodically set a minimum quantity of shares that must be held by the Chief Executive Officer in registered form until the end of his/her duties (Article 24).


The Articles of Association set the number of shares that must be held by any director.

The Long-Term Incentive Plans set the number of shares that must be held by the Chief Executive Officer until the end of his/her duties.

2.1.13Limitations on the powers of general management

The Board of Directors has established specific procedures in its Internal Rules which are aimed at limiting the powers of the Company’s general management.

Pursuant to the terms of Article 1.2 of the Board of Directors’ Internal Rules, the following are subject to prior authorisation from said Board, based on a simple majority of the members present or represented:

  • extension of the Company’s activities to significant businesses not performed by the Company; and
  • any interest, investment, disposal or any establishment of a joint venture carried out by the Company or one of its significant subsidiaries, for a total amount that is greater than €100 million.
Factors that may have an impact in the event of a public offer

These factors are published in Section 7.4 “Factors that may have an impact in the event of a public offer”.

(1)
The information presented in this table is correct as at December 31, 2022.
(2)
In accordance with legal requirements and the recommendations of the AFEP-MEDEF Code, Coface directors cannot hold more than four other offices in listed companies outside the Group, including abroad.
(3)
Listed company.
(4)
Listed company.
(5)
Listed company.
(6)
Listed company.
(7)
Listed company.
(8)
Listed company.
(9)
https://www.medef.com/uploads/media/default/0020/01/14911-code-afep-medef-version-de-decembre-2022.pdf

2.2Chief Executive Officer and Group general management specialised committees

At the meeting of November 22, 2012, the Board of Directors decided to separate the roles of Chairman of the Board of Directors and Chief Executive Officer. This decision reflects the Company’s wish to comply with best practices in corporate governance and to clearly distinguish between the strategic, decision-making and supervisory duties of the Board of Directors, and the operational and executive duties of the Chief Executive Officer. This separation was expressly reiterated by the Board of Directors at its meeting of January 15, 2016 on the appointment of Xavier Durand and on his reappointment at the meeting held on February 5, 2020.

2.2.1Experience and offices of the Chief Executive Officer

For the purposes of this Universal Registration Document, the Chief Executive Officer is domiciled at the Company’s head office.

 Xavier DURAND

COA2022_URD_FR_ADMIN_XD_p10_HD.png


Age: 58

Expiration date of the term of office: Ordinary Shareholders’ Meeting called to approve the financial statements for the financial year ended December 31, 2023

264,500 shares (180,000 in registered form and 84,500 bearer shares)

(see Section 7.2.9 “transactions carried out by persons with executive responsibilities”)

Chief Executive Officer

since February 9, 2016

Curriculum Vitae

Xavier Durand is a graduate of the École Polytechnique and the École Nationale des Ponts et Chaussées. He started his career in 1987 with consultancy firm The Mac Group (Gemini Consulting) before joining Banque Sovac Immobilier in 1994 as deputy CEO. In 1996, Xavier Durand joined GE Capital, where he led an international career, first in Chicago as Director of Strategy and Growth in the finance division of the Global Auto business, then in France, first as CEO of GE Money Bank France, then CEO for Europe of GE Money and GE Capital’s banking activities. In 2011, he was named CEO of GE Capital Asia-Pacific, based in Japan. He was appointed GE Capital’s Director of Strategy and Growth, based in London, at the end of 2013. He has been Chief Executive Officer of COFACE SA since February 9, 2016.

Principal terms of office and duties

During financial year 2022

  • Chairman of the Board of Directors and Chief Executive Officer of Compagnie française d’assurance pour le commerce extérieur
  • Chairman of the Board of Directors of Coface North America Holding Company
  • Director and Chairman of the Audit and Internal Control and Risk Committee of: ALD Automotive (1)

During the past five years and which are no longer held

  • N/A

2.2.2Composition and experience of the members of the Group Management Board

The Chief Executive Officer of the Company created the Group Management Board. It comprises eight members (see also Section 1.7. “Group organisation”): 

  • the Chief Human Resources Officer; 
  • the Group Chief Operating Officer; 
  • the Underwriting Director; 
  • the Commercial Director; 
  • the General Secretary; 
  • the Chief Financial and Risk Officer; 
  • the Business Technology Director; and 
  • the Strategy and Business Development Director (see also Section 1.7. “Group organisation”).

The Management Board is the decision-making body of Coface. It generally meets every week to 

  • examine and validate the Group’s main strategic guidelines and steer management, 
  • in particular, concerning 
    • strategy and budget, 
    • major investments and projects, 
    • definition of the organisational structure and human resources, 
    • monitoring of operational performance and results, 
    • in addition to control and compliance of activities. 

In 2022, it continued to meet on average twice a week.

In addition to Xavier Durand, the following persons were members of the Group Management Board on the date of publication of the Universal Registration Document:

 Pierre BEVIERRE

CH02_COA2020_Photo_Admin_BEVIERE_HD.png


Chief Human Resources Officer

The Human Resources Department is responsible for all of the Group’s key human resources processes and policies.

Curriculum vitae

Pierre Bevierre, 55 years old, holds a postgraduate degree in human resources from Université Paris-Dauphine. He began his career as a recruitment expert before joining Presstalis, a French media distribution corporation, in 1992 as Head of HR and industrial relations. In 1998, he was appointed Head of Compensation and Employee Benefits at GE Money Bank, then Head of HR at GE Insurance in 2001. In 2004, he was promoted to Director of Human Resources Europe for shared financial services at the GE group. In 2008, he joined MetLife as Director of Human Resources for Western Europe and was appointed Vice-Chairman of Human Resources for Central and Eastern Europe in 2012. He joined Coface on January 2, 2017 as Group Chief Human Resources Officer and has been a member of the Executive Committee since January 1, 2019.

 Cyrille CHARBONNEL

COA2022_URD_FR_ADMIN_CC_p02_HD.png


Underwriting Director

Under the Build to Lead strategic plan, the management of both debtor and client risks is fundamental, and monitoring was ramped up due to the crisis in Ukraine. The Underwriting and Claims Department is in charge of both commercial underwriting and litigation, as well as being responsible for the Risk Underwriting and Information Department.

Curriculum vitae

Cyrille Charbonnel, 57 years old, is a graduate in finance from the Institut Supérieur de Commerce de Paris. After initially working at an organisational consulting firm, he joined the Euler Hermes France group as a risk analyst in 1990. He then moved into sales in 2001 and was appointed Sales and Marketing Director in 2004. In 2007, he left for Portugal as Chief Executive Officer of the local subsidiary. He joined Coface in 2011 as Group Organisation Director, then as Chief Operating Officer. In 2013, he was appointed Director of the Western Europe and France region before becoming Group Chief Underwriting Director in 2017.

Declan DALY

CH02_COA2021_ADMIN_PHOTO_Declan-Daly_HD.png


Group Chief Operating Officer

The Group Operations Department is a cross-business function focusing on three main objectives: (i) improving the level of service to clients, (ii) increasing productivity through the use of shared services and process optimisation, and (iii) strengthening operational excellence through major global transformation projects.

Curriculum vitae

Declan Daly, 56 years old, began his career in software engineering at ABB in Ireland and Austria, before joining General Electric Company in 2000. From 2002, he was Chief Operating Officer of GE Money Bank in Switzerland, before being appointed Chief Executive Officer of GE Money Bank in Austria in 2006. In 2009, he joined Western Union Financial Services’ management team as Vice President of Europe, Head of B2B. In 2014, Declan was appointed Chief Information Officer and member of the Executive Committee of Semperit Holding AG. He joined Coface in 2017 as regional director Central and Eastern Europe. In April 2021, he was appointed Coface Group Chief Operating Officer. Declan holds a degree in electronic engineering from Dublin City University and an MBA from INSEAD.

Nicolas GARCIA

COA2022_URD_FR_ADMIN_NC_p07_HD.png


Commercial Director

The Group’s Commercial Department is tasked with structuring, organising and coordinating the Group’s commercial activity. Its responsibilities extend to distribution networks, both brokerage-based and direct, and management of portfolio accounts, including those of Coface Global Solutions, intended for our major international clients.

Curriculum vitae

Nicolas Garcia, 49 years old, holds a degree in economics and international finance from the University of Bordeaux, as well as an MBA in international banking & finance from Birmingham Business School. He has held various positions within the Euler Hermes group, including Head of Commercial Underwriting since 2011. He has held the position of Group Commercial Director since July 2, 2014.

Phalla GERVAIS

COA2022_URD_FR_ADMIN_PG_p08_HD.png


Group Chief Financial and Risk Officer

The Finance and Risk Department encompasses management control and purchasing, accounts, investment and financing activities, financial communications, and reinsurance, as well as the Risk Department and the Actuarial Department.

Curriculum vitae

Phalla Gervais, 54 years old, began her career in the Finance and Banking Department of PwC, before joining GE Capital in 1995, where she held various senior management positions in finance. In 2013, she became Chief Financial Officer of Aviva Italy. She was promoted to Deputy Chief Financial Officer of Aviva France in 2016 before being appointed Chief Financial Officer and Deputy Chief Executive Officer of Aviva France in charge of Finance & Legal cross-business functions in 2017. In 2021, she joined Coface as Chief Financial & Risk Officer. Phalla is a graduate of SKEMA Business School.

 Carole LYTTON

CH02_COA2020_Photo_Admin_LYTTON_HD.png


General Secretary

The General Secretariat encompasses the Human Resources Department, the Communications Department, the Legal Department, and the Compliance Department.

Curriculum vitae

Carole Lytton, 66 years old, graduated from the Paris Institut d’études politiques and holds postgraduate degrees in public law and international law. She joined the Group in 1983 and was Chief Legal and Compliance Officer from 2008 to 2015. She was appointed General Secretary on July 3, 2015. She serves as the Group’s Chief Legal Officer. The Group’s Compliance, Communications and Human Resources Departments are under her direct authority.

 Keyvan SHAMSA

CH02_COA2020_Photo_Admin_SHAMSA_HD.png


Business Technology Director

The Business Technology Department brought together the former Information Systems and Organisation Departments in 2018.

Curriculum vitae

Keyvan Shamsa, 60 years old, has a PhD in computer science from Université Pierre et Marie Curie. He began his career in finance at Crédit Lyonnais Corporate and Investment Banking in 1991 as part of the information systems team before being appointed in 2000 as Head of IT at Crédit Lyonnais Asset Management (now Amundi). In 2005, he joined Societe Generale Corporate and Investment Banking in New York as Head of Corporate Information Systems for the Americas. In 2008, he joined BNP Paribas Asset Management in Paris as Head of Information Systems, where he also held various other management positions over a ten year period. He joined the Group on November 5, 2018 as Business Technology Director.

Thibault SURER

COA2022_URD_FR_ADMIN_TS_p09_HD.png


Strategy and Business Development Director

The Strategy and Development department includes strategic planning functions, M&A, marketing and innovation, partnerships, information and economic research.

Curriculum vitae

Thibault Surer, 60 years old, is a graduate of École des Hautes Études Commerciales de Paris, the London Business School and the Stockholm School of Economics. He began his career in Eurosuez-Euroventures funds (1987-1994) and then spent more than 15 years with McKinsey & Company, in Paris, New York then Beijing, as Partner and Director of the Financial Institutions and Transport and Logistics Competence Centres. After serving as Partner in the Astorg Partners private equity fund (2010 to 2015), he became Strategy and Business Development Director of Coface Group on June 13, 2016.

2.2.3Other committees chaired by the Chief Executive Officer

Xavier Durand also chairs the Executive Committee.

The Executive Committee is composed of the members of the Group Management Board and the seven regional directors (see also Section 1.7 “Group organisation”).

It helps to prepare the Group’s strategy and reviews key operational matters or strategic initiatives.

Like the Management Board, the Executive Committee pays particular attention to monitoring the efficiency of internal control, internal audit and risk management systems that are considered essential to the Group’s smooth internal governance.

It meets each month to review the progress of the Group’s cross-disciplinary projects and the implementation of the strategic plan. In 2022, it also continued to meet twice a month.

Furthermore, the Executive Committee members contribute, as a team, to setting up and disseminating Coface’s managerial culture.

In addition, the Chief Executive Officer convenes the main managers of the various head office functions for a meeting of this committee once a month. This committee focuses on information and discussions relating to the main areas of reflection and action.

Since the fourth quarter of 2022, the Executive Committee meets once a quarter in the form of a “CSR Committee”. On this occasion, it examines the company’s strategy, the main projects and potential initiatives relating to CSR.

(1)
Listed company.

2.3Compensation and benefits paid to managers and corporate officers

The Company refers to the AFEP-MEDEF Code to prepare the report required by Article L.225-37 of the French Commercial Code.

The tables included in the sections below present a summary of compensation and benefits of any kind that are paid to corporate officers of the Company, and to members of the Company’s Board of Directors by:

  • the Company, 
  • companies controlled, pursuant to Article L.233-16 of the French Commercial Code, by the company in which the mandate is performed, 
  • companies controlled, pursuant to Article L.233-16 of the French Commercial Code, by the Company or companies that control the company in which the mandate is performed and 
  • the Company or companies that, pursuant to the same article, control the company in which the mandate is exercised. Since the Company belongs to a group at the date of this Universal Registration Document, the information concerns the amounts owed by all companies in the chain of control.

The Company is a limited corporation (société anonyme) with a Board of Directors. The duties of Board Chairman, performed by Bernardo Sanchez Incera since February 10, 2021, and Chief Executive Officer, performed by Xavier Durand, have been separated.

Xavier Durand is compensated by the Company for his functions as Chief Executive Officer as described in Sections 2.3.2 and 2.3.3 below.

2.3.1Employee compensation policy

Regulatory framework

The Company’s compensation policy is in line with the provisions of Directive 2009/138/EC of the European Parliament and of the Council of November 25, 2009 on the taking-up and pursuit of the business of Insurance and Reinsurance (Solvency II) and Delegated Regulation (EU) 2015/35 of the European Commission of October 10, 2014 (Article 258(1), point 1 and Article 275).

Generally speaking, compensation practices should contribute to effective risk management at the Company, and in particular:

  • ensure strict compliance with the laws and regulations applicable to insurance companies;
  • prevent conflicts of interest and not encourage risk-taking beyond the limits of the Company’s risk tolerance;
  • be consistent with the Company’s strategy, interests and long-term results;
  • guarantee the Company’s capacity to keep an appropriate level of own funds.

In this context, Coface’s compensation policy specifies general provisions applicable to all employees according to certain criteria and provisions specific to regulated categories of employees within the meaning of the Solvency II Directive.

General principles

The compensation policy is a key instrument in implementing Coface’s strategy. It seeks to attract, motivate and retain the best talent. It encourages individual and collective performance and seeks to be competitive in the market while respecting the Group’s financial balance. It complies with the regulations in force, guarantees internal equity and professional equality, particularly between men and women. It incorporates social and environmental issues.

It is proposed by the Group’s HR Department and is reviewed by the Appointments, Compensation and CSR Committee, and then subject to approval by the Board of Directors. The HR function is responsible for implementing the policy at the country level to ensure practices are consistent within the Group, and to ensure each country is compliant with local regulations and remains competitive in the market.

Structured in a clear and transparent manner, compensation is intended to be adapted to the Group’s objectives and to assist it in its long term development strategy:

  • fixed compensation: this is the principal component of individual compensation and depends on the abilities and expertise expected for a given position. It is set at the time of hiring and reviewed annually in light of market practices, individual contribution and internal equity in strict compliance with the budgets allocated for the financial year;
  • annual individual variable compensation (“bonus”): the Group’s variable compensation policy takes individual and collective performance over a given year into account and is assessed on the basis of financial and non-financial criteria. The eligibility rules and variable compensation level are set by function, responsibility level and market under consideration.
  • For the Group’s Senior Managers (Top 200), the target variable compensation is set as a percentage of the base salary and may not exceed 100% of this. Variable compensation is awarded based on objectives set annually by the Management Board and the managers of each function, with the support of the Group’s HR Department. This procedure ensures that individual objectives are consistent with the Company’s strategic objectives:
    • for the front office functions:
      • quantitative objectives related to the financial performance of the operating entity account for 15% of variable compensation,
      • predominantly quantitative objectives related to the performance of the function in question account for 45%,
      • 40% of the objectives are determined individually during the annual performance review meeting. These may be quantitative and/or qualitative objectives, provided that they comply with SMART rules (specific, measurable, attainable, relevant and time-bound);
    • for the control and support functions, the quantitative objectives linked to the financial performance of the operating entity account for 30%, and targets set individually for 70% of the total,
    • furthermore, to avoid any conflict of interest, for the control functions referred to in Articles 269 to 272 (audit, risk, compliance), the collective part of annual variable compensation based on financial objectives is assessed using the Group scope, irrespective of the employee’s level of involvement, to prevent them from being directly assessed on the performance of the units placed under their control;
  • Long-Term Incentive Plan: since 2016, the Group has awarded performance shares to two types of employees each year:
    • employees identified under the Solvency II Directive, which imposes a system for deferred total variable compensation. This category includes members of the Executive Committee, key functions and employees having a significant influence on the company’s risk profile,
    • key employees as part of a reward and retention process. This plan also ensures that the interests of the beneficiaries are aligned with those of the shareholders over the long term;
  • collective variable compensation (employee savings): in France, the Group negotiated a three-year profit-sharing agreement in 2021. This agreement benefits all employees on a fixed or open-ended employment contract, who have more than three months’ seniority within the companies forming part of the Compagnie française d’assurance pour le commerce extérieur – Fimipar economic and corporate unit (a wholly-owned subsidiary of the Group). Participation is handled according to the legal formula. Similar collective schemes exist in other Group entities depending on their legal obligations with a view to giving employees a stake in the Company’s performance;
  • corporate benefits: employee benefits are determined by each Group entity in order to be as close as possible to local concerns. The Group ensures consistency of practice and guarantees a level of social protection that is competitive in the market and respectful of its employees worldwide. In order to meet the need for fairness and competitiveness in the compensation of members of the Executive Committee, the Board of Directors decided, at its meeting of February 15, 2022, to implement a supplementary pension plan for members of the Executive Committee who do not have a specific scheme. The main features of this plan are:
    • defined contribution pension scheme (in France, in the form of an insurance policy governed by Article 82 of the French General Tax Code),
    • contribution of 10% of the beneficiary’s base salary (invested in the plan, with compensation for additional charges and taxes),
    • withdrawal as a lump sum or an annuity on liquidation of pension entitlements.

In 2020, the Group implemented a car policy aimed at harmonising practices and reducing the carbon impact of its vehicle fleet. It is gradually replacing its high-emission vehicles with petrol, hybrid or 100% electric vehicles.

The compensation of employees is wholly or partly comprised of these components, depending on the position held, the level of responsibility and the reference market.

Special provisions applicable to Solvency II regulated categories of employees
Scope of regulated categories of employees

Pursuant to the provisions of Article 275, Section 1, Point (c) of Regulation 2015/35, Coface has identified the following functions as falling within the scope of regulated categories of employees:

  • members of the Executive Committee including general management, the finance and risk, strategy, operations, specialised product lines, business technology functions, the General Secretariat (legal, compliance, human resources and communications), human resources, sales, risk underwriting, information, claims & recovery and collection, and regional managers;
  • persons holding the key functions described in Articles 269 to 272 of Regulation 2015/35: audit, risk, and actuarial (compliance key function is exercised by the General Secretariat);
  • persons whose professional activity has a material impact on the Company’s risk profile: compliance, risk underwriting, commercial underwriting, credit risk support, investment, reinsurance, economic research, financial communication, country managers where turnover exceeds a proportion of the Company’s total turnover determined each year.

In 2022, 31 employees fell within the regulated category. The Appointments, Compensation and CSR Committee reviews these functions, then presents them to the Board of Directors for approval. This list is reviewed each year in order to guarantee a perfect match between the evolution of the Company’s risk profile and the identification of employees.

Specific provisions regarding compensation

The Group endeavours to ensure that the proportion and structure of variable compensation are balanced and that the goals set are in accordance with the Company’s strategy and risk profile.

In addition to rules common to all employees, the Group sets specific compensation rules intended for regulated categories of employees:

  • the variable compensation package therefore includes the annual variable compensation (bonus) and long term variable compensation (Long-Term Incentive Plan) in the form of free performance shares;
  • performance shares constitute the deferred component of total variable compensation and account for at least 30% of the total amount (1). They are contingent upon presence and performance conditions and have a vesting period of three years;
  • all risk hedging transactions are prohibited.

2.3.2Compensation policy for corporate officers

In accordance with Article L.22-10-8 of the French Commercial Code, the Board of Directors, based on a proposal by the Appointments, Compensation and CSR Committee, establishes a compensation policy for corporate officers. This document describes the principles of the policy, which is in line with the Company’s corporate interests, falls within its commercial strategy and contributes to its long-term viability.

It describes all the components of fixed and variable compensation and explains the decision-making process followed to determine, review and implement it.

It is presented in a clear and understandable way as part of the corporate governance report and is the subject of a draft resolution submitted for approval by the Shareholders’ Meeting each year and each time a significant change is made.

The compensation policy for corporate officers defines the principles, structure and governance rules applicable to the compensation paid to the Chief Executive Officer and the directors.

Compensation of the Chief Executive Officer
Principles applicable to the compensation of the Chief Executive Officer

The Board of Directors sets the various components of the Chief Executive Officer’s compensation at the start of each financial year, based on a proposal by the Appointments, Compensation and CSR Committee. The Appointments, Compensation and CSR Committee proposes the compensation policy for the Chief Executive Officer in compliance with the rules laid down by the Solvency II Directive and the recommendations of the AFEP-MEDEF Code.

It thereby ensures that the principles of balance, external competitiveness, consistency and internal equity are observed in determining the components of compensation. It ensures a correlation between the responsibilities exercised, the results achieved and the level of compensation over a performance year.

It also ensures that compensation practices contribute to effective risk management within the Company and in particular:

  • strict compliance with the laws and regulations applicable to insurance companies;
  • the prevention of conflicts of interest and the management of risk-taking within the limits of the Company’s risk tolerance;
  • consistency with the Company’s strategy, interests and long-term results;
  • consideration of social and environmental issues.

The Chief Executive Officer’s compensation is subject to a comparative analysis of the market each year by a compensation consultancy firm in order to ensure it is competitive within the market and that the structure offers the right balance of fixed, variable, short-term and long-term components. The results of this analysis are reported to the Appointments, Compensation and CSR Committee as part of the annual review of the Chief Executive Officer’s compensation.

The objectives, practices and governance in terms of compensation are clearly established and communicated and the components of the Chief Executive Officer’s compensation are presented transparently in the corporate governance report subject to approval by the Shareholders’ Meeting.

Components of the compensation of the Chief Executive Officer

The compensation of the Chief Executive Officer comprises:

COA2022_URD_EN_G020_HD.png
  • fixed compensation: the fixed annual compensation was adjusted to €750,000 gross when the Chief Executive Officer’s term of office was renewed in 2020 in order to take into account his responsibilities, performance and market practices (see detailed explanation in the fairness ratio section below);
  • annual variable compensation: the bonus is assessed on the basis of performance for a given year. The target is set at 100% of the base salary. It comprises 60% financial objectives and 40% strategic and managerial objectives. The maximum achievement rate for variable compensation is 200% (150% for financial objectives and 50% for strategic and managerial objectives);
  • long-term variable compensation: fixed in the form of free performance shares. The delivery of the shares is contingent upon presence and performance conditions and they have a vesting period of three years. The shares awarded to the Chief Executive Officer may not represent more than 20% of the total number of shares awarded for the financial year and is limited to 125% of his base salary. The Chief Executive Officer’s free share award is subject to the same conditions as all beneficiaries; however, the Chief Executive Officer must retain 30% of the shares awarded until expiry of his term of office. These Long-Term Incentive Plan (LTIP) schemes are intended to ensure that the interests of the Chief Executive Officer are aligned with those of the shareholders over the long term;
  • benefits in kind: the Chief Executive Officer is entitled to a company vehicle and the payment of 62.5% of the contributions payable to the social security regime for company managers and corporate officers.

He is entitled to the Group healthcare and protection schemes in place for all employees. In 2022, the Board of Directors decided to put in place a supplementary retirement scheme for members of the Executive Committee, including the Chief Executive Officer (see paragraph 2.3.1 above). A medical assessment is proposed to the Chief Executive Officer and members of the Executive Committee every two years.

Note:

  • the variable compensation package includes the annual variable compensation (“bonus”) and the long term variable compensation (Long-Term Incentive Plan) in the form of free performance shares;
  • the payment of 30% of the annual variable compensation (“bonus”) is deferred and paid as follows: 50% in N+2 and 50% in N+3. Deferred compensation is not paid if a loss is observed on the date of payment or in case of dismissal for gross negligence or serious misconduct;
  • deferred compensation, including the deferred bonus portion and the free shares awarded under the Long-Term Incentive Plan, accounts for more than 60% of the overall variable compensation;
  • all risk hedging transactions are prohibited.

The compensation of the Chief Executive Officer may be summarised as follows:

COA2021_URD_EN_F041_HD.png
Directors’ compensation
Principles of directors’ compensation

The Group’s policy is not to award compensation to management representatives who perform the duties of directors in Group companies. The Chairman of the Board of Directors receives compensation of €180,000 for his corporate office within COFACE SA.

The compensation policy for corporate officers has been adapted to the usual practices of listed companies and guarantees the independence of directors.

The components of directors’ compensation are presented clearly and transparently in the corporate governance report and are subject to approval by the Shareholders’ Meeting.

Components of directors’ compensation

The overall annual budget allocated to directors’ compensation in 2022 totalled €450,000 (excluding the compensation of the Chairman of the Board of Directors). It is divided between the Board of Directors, the Audit and Accounts Committee, the Risk Committee and the Appointments, Compensation and CSR Committee.

 The rules on the distribution of directors’ fees are as follows:


Fixed portion

(per year prorata 
to the term of office)

Variable portion

(per meeting and capped*)

Board of Directors

Members

€8,000

€3,000

Audit and Accounts Committee

Chairman

€17,000

€3,000

Members

€5,000

€2,000

Risk Committee

Chairman

€17,000

€3,000

Members

€5,000

€2,000

Appointments, Compensation and CSR Committee

Chairman

€8,000

€3,000

Members

€3,000

€2,000

* Capped:

 • at six meetings for the Board of Directors, the Audit and Accounts Committee and the Risk Committee;

 • at five meetings for the Appointments, Compensation and CSR Committee.


Financial year 2022 – maximum gross compensation amounts

On the basis of six Board meetings per year;

six Audit and Accounts Committee meetings; six Risk Committee meetings; five Appointments, Compensation and CSR Committee meetings

Amount of compensation

Fixed portion

(in %)

Variable portion

(in %)

Member of the Board of Directors

€26,000

31

69

Member of the Board of Directors

+ Chairman of the Audit and Accounts Committee

€61,000

41

59

Member of the Board of Directors

+ Member of the Audit and Accounts Committee

€43,000

30

70

Member of the Board of Directors

+ Chairman of the Risk Committee

€61,000

41

59

Member of the Board of Directors

+ Member of the Risk Committee

€43,000

30

70

Member of the Board of Directors

+ Chairman of the Appointments, Compensation and CSR Committee

€49,000

33

67

Member of the Board of Directors

+ Member of the Appointments, Compensation and CSR Committee

€39,000

28

72

2.3.3Summary of the compensation of each executive director for financial years 2021 and 2022

In compliance with the regulations, the tables below present a summary of compensation and stock options and shares awarded during the fiscal years ended December 31, 2021 and December 31, 2022 to Bernardo Sanchez Incera, Chairman of the Board of Directors since February 10, 2021, and Xavier Durand, Chief Executive Officer.

Nicolas Namias, Chairman of the Board of Directors from September 9, 2020 to February 10, 2021, received no form of compensation or benefit. The compensation paid by Natixis to Nicolas Namias for his duties as Chief Executive Officer of Natixis is described in the Natixis Universal Registration Document and on the website: www.natixis.com

/Summary of compensation, stock options and shares granted to each executive corporate officer (Table 1 – AMF/AFEP-MEDEF)


Financial year 2022 (1)

Financial year 2021 (1)

Bernardo Sanchez Incera, Chairman of the Board of COFACE SA

since February 10, 2021


Compensation due for the financial year

180,000

180,000

Value of multi-year variable compensation allocated during the financial year


Value of stock options granted during the financial year


Value of performance shares granted during the financial year

N/A

N/A

Total

180,000

180,000

Xavier Durand, Chief Executive Officer


Compensation due for the financial year (2) (presented in detail in Section 2.3.4 below)

2,331,550

2,012,105

Value of multi-year variable compensation allocated during the financial year

-

-

Value of stock options granted during the financial year

-

-

Value of performance shares awarded during the financial year (presented in detail in Section 2.3.8 below) (3)

737,700

533,850

Total

3,069,250

2,545,955

  • In euros.
  • Before social security contributions and income tax.
  • IFRS fair value (corresponding to a value on the award date of €641,363 for the 2021 LTIP and €880,350 for the 2022 LTIP).

2.3.4Compensation of executive directors for financial years 2021 and 2022

In compliance with the regulations, the tables present the breakdown of fixed and variable compensation and other benefits granted during the fiscal years ended December 31, 2021 and 2022 to Bernardo Sanchez Incera, Chairman of the Board of Directors since February 10, 2021.

Nicolas Namias, Chairman of the Board of Directors from September 9, 2020 to February 10, 2021, received no form of compensation or benefit. The compensation paid by Natixis to Nicolas Namias for his duties as Chief Executive Officer of Natixis is described in the Natixis Universal Registration Document and on the website: www.natixis.com

/Summary of the compensation paid to each executive director (Table 2 – AMF/AFEP-MEDEF)
Compensation due or awarded for the financial year ended December 31, 2022, to Bernardo Sanchez Incera, Chairman of COFACE SA Board of Directors since February 10, 2021


2022 (1)

Amounts due

Amount paid

Bernardo Sanchez Incera, Chairman of the Board of COFACE SA


Fixed compensation for corporate office (2)

180,000

180,000

Annual variable compensation

-

-

Extraordinary compensation

-

-

Compensation for attending COFACE SA Board meetings

-

-

Benefits in kind

-

-

Total

180,000

180,000

  • In euros.
  • On a gross basis before social security contributions and income tax.
Compensation due or awarded for the financial year ended December 31, 2022, to Xavier Durand, Chief Executive Officer of COFACE SA


2022 (1)

2021 (1)


Amounts due (2)

Amounts paid (3)

Amounts due (2)

Amounts paid (3)

Xavier Durand, Chief Executive Officer


Fixed compensation

750,000

750,000

750,000

750,000

Annual variable compensation

1,415,555 (5)

872,278 (4)

1,246,110 (5)

349,113 (4)

Deferred variable compensation (6)

-

205,418

-

266,738

Extraordinary compensation

-

-

-

-

Directors’ fees

-

-

-

-

Benefits in kind (7)

165,995

15,995

15,995

15,995

Total (8)

2,331,550

1,843,691

2,012,105

1,381,846

  • Amount in euros, on a gross basis before social security contributions and income tax.
  • The amounts due correspond to the sums allocated for the financial year excluding long-term variable compensation and deferred variable compensation.
  • The amounts paid correspond to the sums effectively paid during the financial year and include amounts that were due for the previous financial year.
  • Variable compensation paid in performance year N (portion due for N-1).
  • Variable compensation for performance year N.
  • Deferred variable compensation paid in year N for performance years N-2 and N-3.
  • Xavier Durand is entitled to the payment by the Company of 62.5% of the contributions payable to the social security regime for company managers and corporate officers (GSC), a company car, and the retirement scheme for members of the Executive Committee (maximum 20% contribution of annual fixed compensation). The contribution to the supplementary pension plan is subject to a performance condition that must be approved by the 2023 Shareholders’ Meeting.
  • For the history of free share awards, see Section 2.3.12.
Details of the components of the compensation of Xavier Durand, Chief Executive Officer of COFACE SA due for the year ended December 31, 2022(2)
COA2022_URD_EN_G002_HD.png

Components of compensation

Amount

Comment


Fixed compensation

€750,000

Gross annual compensation set at €750,000 on the renewal of the term of office of Xavier Durand and effective from the Shareholders’ Meeting closing financial year 2019, held in May 2020.

Annual variable compensation (“bonus”)

€1,415,555

Target variable compensation is set at 100% of fixed compensation.

The maximum achievement rate for variable compensation is 200%, broken down as follows:

  • 150% for financial objectives (i.e., a maximum achievement rate of 250%);
  • 50% for strategic and managerial objectives (i.e., a maximum achievement rate of 125%).

The achievement rate for financial objectives is defined in the scope of variation limits, as follows:

  • the lower end of the variation limit corresponds to the trigger level, i.e. 0% achieved;
  • the objective corresponds to 100% achievement;
  • between the lower end of the variation limit and the objective, the achievement rate is calculated on a straight-line basis between 0% and 100% of achievement;
  • between the objective and the upper end of the variation limit, the achievement rate is calculated on a straight-line basis between 100% and 250% of achievement.

Thus, if the achievement rate for one of the financial objectives is at or below the lower end of the variation limit for this objective, no compensation will be paid for it.

The payment of 30% of the annual variable compensation (“bonus”) is deferred and paid as follows: 50% in N+2 and 50% in N+3. A penalty system is introduced in the event of dismissal for gross negligence or serious misconduct or observed losses prior to the payment date.

The achievement rate of the 2022 objectives, proposed by the Nominations and Compensation Committee meeting of January 23, 2023, approved by the Board of Directors at the meeting of February 16, 2023, and submitted for approval of the Shareholders’ Meeting that approves the 2022 financial statements is 188.74%, broken down as follows:

Financial objectives

Variation limit

% weighting

Achievement
rate

Amount of variable compensation

Turnover

-/+10%

15%

250.00%

€281,250

Net income

-/+20%

20%

250.00%

€375,000

Cost ratio after reinsurance

+/-3 pts

10%

145.00%

€157,500

Gross loss ratio excluding claims handling expenses

+/-5 pts

10%

250.00%

€187,500

Turnover from information business

-/+20%

5%

104.81%

€39,305

Total (A)


138.74%

€1,040,555

Strategic and managerial objectives

Variation limit

% weighting

Achievement rate

Amount of variable compensation

Monitoring of the implementation of the strategic plan by the Board of Directors

0/125%

15%

125.00%

€140,625

CSR strategy/integration of CSR into the business policy, carbon assessment and definition of the trajectory to reduce our emissions

0/125%

10%

125.00%

€93,750

Maintaining employee engagement and client satisfaction

0/125%

10%

125.00%

€93,750

Executive Committee succession plan

0/125%

5%

125.00%

€46,875

Total (B)


50.00%

€375,000


Total (A + B)


188.74%

€1,415,555


The bonus due for financial year 2022 is therefore €1,415,555 and will be paid as follows:

  • 70% of the total amount paid in 2023, i.e. €990,889;
  • 15% of the total amount deferred to 2024, i.e. €212,333;
  • 15% of the total amount deferred to 2025, i.e. €212,333.

Payment of the 2022 bonus is conditional on the approval of the Ordinary Shareholders’ Meeting that follows the closing of financial year 2022.

A penalty scheme continues to apply to deferred compensation: therefore, in case of losses observed prior to the payment dates of the deferred amounts or dismissal for gross negligence or serious misconduct before the payment date, no payment will be made for these deferred amounts.

Multi-year variable compensation

€0.00

N/A


Extraordinary compensation

€0.00

N/A


Long-term variable compensation

(Allocation of stock options/performance shares and any other component of long-term compensation)

(see Section 2.3.8)

75,000 free shares are awarded under the 2022 Long-Term Incentive Plan (2022 LTIP), representing an IFRS fair value of €737,700 (€880,350 on award, based on the average opening share price for the last 20 stock market trading sessions preceding the date of the Board meeting).

Free shares will be definitively vested on February 15, 2025, subject to presence and performance conditions measured over the term of the plan until December 31, 2024, as follows:

  • 40% of the shares awarded will be vested subject to the relative performance of COFACE SA’s shares, measured by COFACE SA’s Total Shareholder Return (TSR) compared to the TSR of companies comprising the Euro Stoxx Assurance index over the period from January 1, 2022 to December 31, 2024;
  • 40% of the shares awarded will be vested subject to achievement of net earnings per share at December 31, 2024;
  • 20% of the shares awarded will be vested subject to the achievement of the CSR criterion linked to increasing the proportion of women in senior management (Top 200) by December 31, 2024.

The trigger level is set at 80% of the objective for each criterion. Thus, if the achievement rate for one of the criteria is less than 80% of the objective, performance in respect of this criterion will be unfulfilled. The achievement rate may vary between 80% and 120%, and the achievement rates can offset each other. However, this offsetting cannot be applied if the rate of achievement for one of the criteria is less than 80% of the target and cannot result in the acquisition of more than 100% of the shares in total.

The share vesting period is set at three years starting from February 15, 2022. The plan does not include a minimum holding period.

The Board decided that 30% of the CEO’s shares vested under the 2022 LTIP should be retained until the end of his term of office or of any other role that he might hold within Coface.

No hedging

€0.00

To the Company’s knowledge, no hedging instrument has been set up.

Supplementary retirement scheme

€150,000

In 2022, the Board approved the implementation of a supplementary pension plan for the members of the Executive Committee. It is also available to Xavier Durand, subject to a performance condition. The plan provides for a contribution of 10% of fixed compensation with an allowance for taxes and additional expenses for up to 10% of the amount of fixed compensation.

Directors’ fees

€0.00

Xavier Durand did not receive any directors’ fees in connection with his duties within the Company.

Benefits in kind

€15,995

Xavier Durand is entitled to a company vehicle and the payment of 62.5% of the contributions payable to social security regime for company managers and corporate officers.

Total amounts due*

€2,331,550


* The amounts due correspond to the sums allocated for the financial year excluding long-term variable compensation.

Fairness ratio between the level of compensation of the Chief Executive Officer and the average and median compensation of the Company’s employees

In accordance with the terms of Article L.22-10-9 of the French Commercial Code, the Company provides here the ratio between the level of compensation of the Chief Executive Officer to the average and median full-time equivalent compensation of the Company’s employees.

This analysis was conducted taking into account the “Guidelines on compensation multiples” issued by the AFEP (the French Association of Private Enterprises) on September 27, 2019 and updated in February 2021. The scope used for the analysis is the France scope (all employees established in France and continuously present during the reference year), which is the Chief Executive Officer’s market and is the most relevant for this comparison. It takes into account the gross components of compensation paid or awarded for financial year N (fixed pay, variable compensation paid during financial year N for year N-1, deferred variable portion paid during financial year N for previous financial years, free shares awarded for financial year N valued at IFRS fair value, and benefits in kind).

It concerns only the Chief Executive Officer, as the Chairman of the Board of Directors receives only an annual flat-rate compensation set at €180,000 for his term of office.

Financial year

2018

2019

2020

2021

2022

SBF 120 benchmark*

Ratio to average employee compensation

23.7

24.1

29.1

24.2

28.0

50

Ratio to median employee compensation

29.2

29.0

35.2

29.4

34.6

66

* Average of ratios, source Willis Towers Watson.


/Explanations for the change in the ratio over the reference period
  • Financial year 2018: first full year of Xavier Durand’s compensation, including a performance bonus for 2017 (152.01% achievement of the objectives set over the period) and the first deferred variable compensation amount paid in respect of the 2016 bonus.
  • Financial year 2019: Xavier Durand’s compensation includes a performance bonus for 2018 (157.83% achievement of the objectives set over the period), comparable to 2017, and the second deferred variable compensation amount paid in respect of the 2016 bonus and the first for the 2017 bonus; the ratios are relatively stable between 2018 and 2019.
  • Financial year 2020: Xavier Durand’s compensation includes a performance bonus for 2019 (151.43% achievement of the objectives set over the period), comparable to 2017 and 2018, the second deferred variable compensation amount paid in respect of the 2017 bonus and the first for the 2018 bonus. In addition, Xavier Durand’s fixed compensation was revised from €575,000 to €750,000 on his reappointment in 2020, in order to take into account:
    • individual performance: Xavier Durand outperformed his objectives for the previous three financial years;
    • market practice: Xavier Durand’s fixed compensation was voluntarily set below the market median at the time he took office in 2016 (17% below the market median (3) in base salary and 21% below overall in 2019) and was not reviewed in his first four years in office, in accordance with the company’s policy and the recommendations of the AFEP-MEDEF Code. This review allowed the Xavier Durand’s compensation to be positioned at a competitive level, slightly above the market median.

The fairness ratio therefore changed over the period but remains well below the benchmarks made up of SBF 120 companies.

  • Financial year 2021: the compensation paid or awarded to Xavier Durand in 2021 mainly includes:
    • gross annual compensation set at €750,000 on the renewal of his term of office in 2020, maintained for 2021,
    • the cash portion of the bonus due in respect of 2020, with 72.11% of targets for the period met, down significantly compared to previous years,
    • the second instalment of deferred variable compensation paid in respect of the 2018 bonus and the first in respect of the 2019 bonus, the amounts of which were stable compared to the previous financial year,
    • the amount awarded under the 2021 LTIP, or 75,000 shares valued at €533,850 (IFRS value). This amount was less than in the 2020 LTIP, which was valued at €717,900 (IFRS value) for the same number of shares.

Financial year 2022: the compensation paid or awarded to Xavier Durand in 2022 mainly includes:

  • gross annual compensation set at €750,000 on the renewal of his term of office in 2020, maintained for 2022,
  • the cash portion of the bonus due in respect of 2021, with 166.148% of targets for the period met, higher than in previous years, and significantly higher than in 2020,
  • the second instalment of the deferred variable compensation paid in respect of the 2019 bonus was unchanged compared to the previous financial year; the first payment of deferred compensation in respect of the 2020 bonus was lower than historical standards,
  • the amount awarded under the 2022 LTIP, or 75,000 shares valued at €737,700 (IFRS value). This amount was more than in the 2021 LTIP, which was valued at €533,850 (IFRS value) for the same number of shares.
/Annual changes in compensation, the Company’s performance, average full-time equivalent compensation for the Company’s employees and the aforementioned ratios during the five most recent financial years


2018

2019

2020

2021

2022

Change in the compensation of the Chief Executive Officer

41%

9%

22%

(17%)

35%

Change in the average compensation of employees

6%

7%

1%

0%

17%

Ratio to average employee compensation

23.7

24.1

29.1

24.2

28.0

Change in ratio vs. average employee compensation compared to the previous year

33%

2%

21%

(17%)

15%

Ratio to median employee compensation

29.2

29.0

35.2

29.4

34.6

Change in ratio vs. median compensation of employees compared to the previous financial year

37%

(1%)

21%

(16%)

18%

Change in net income

47%

20%

(44%)

170%

26%

Change in turnover

2%

7%

2%

8%

16%

Note: the Chief Executive Officer’s compensation fell in 2021 then increased in 2022 following an increase in the vested portion of the bonus for 2021 paid in 2022.

With regard to long-term variable compensation in the form of free shares, for the same number of shares awarded in 2021 and 2022, the IFRS fair value of the shares awarded in 2022 was significantly higher than in 2021.

These changes demonstrate the close link between the company’s results and the amount of annual variable compensation (bonus) and therefore the effectiveness of the CEO compensation system.

The structure and principles of the Chief Executive Officer’s compensation will therefore be maintained in 2023 (see Chapter 8 of this document, presenting the 2023 compensation policy for corporate officers).

2.3.5Compensation of members of the Board of Directors for financial years 2021 and 2022

The table below shows the compensation received by members of the Company’s Board of Directors for the financial year ended December 31, 2021 as well as compensation payable to them for the financial year ended December 31, 2022. For the sake of transparency, the Directors representing Natixis who resigned on February 10, 2021 are also included in the table below.

/Table of compensation received by non-executive corporate officers (Table 3 – AMF/AFEP-MEDEF) (1)


Directors’ compensation (in €)

Other compensation and benefits (in €)

Total (in €)

2022 (2)

2021 (3)

2022 (2)

2021 (3)

2022 (2)

2021 (3)

Jean Arondel (4)

-

4,000

-

-

-

4,000

Nathalie Bricker (4)

-

(6)

-

-

-

(6)

Janice Englesbe

41,000

37,375

-

-

41,000

37,375

David Gansberg (5)

41,000

27,417

-

-

41,000

27,417

Éric Hémar

21,375

55,000

-

-

21,375

55,000

Chris Hovey

26,000

25,000

-

-

26,000

25,000

Daniel Karyotis (4)

-

4,000

-

-

-

4,000

Isabelle Laforgue

56,000

53,375

-

-

56,000

53,375

Benoît Lapointe de Vaudreuil (5)

-

19,667

-

-

-

19,667

Laetitia Léonard-Reuter (7)

41,208

-

-

-

41,208

-

Nathalie Lomon

58,000

58,000

-

-

58,000

58,000

Sharon MacBeath

42,708

33,000

-

-

42,708

33,000

Laurent Musy (7)

31,708

-

-

-

31,708

-

Nicolas Papadopoulo

39,000

36,000

-

-

39,000

36,000

Marie Pic-Pâris (4)

-

6,625

-

-

-

6,625

Isabelle Rodney (4)

-

6,625

-

-

-

6,625

Anne Sallé-Mongauze (4)

-

(6)

-

-

-

(6)

Olivier Zarrouati

27,000

40,000

-

-

27,000

40,000

Total

425,000

406,084

-

-

425,000

406,084

  • The dates of appointment and ends of terms of office for the Board of Directors are available in Section 2.1.1 “Details of the members of the Board of Directors for financial year 2022”.
  • Amount awarded in respect of 2022 in euros, on a gross basis (before social security contributions and income tax).
  • Amount awarded in respect of 2021 in euros, on a gross basis (before social security contributions and income tax).
  • Directors representing Natixis who resigned following the announcement of February 10, 2021 concerning the sale by Natixis of 29.5% of the share capital to Arch Capital Group (see paragraph 2.1.1 “Details of the members of the Board of Directors for financial year 2022”).
  • Resignation of Benoît Lapointe de Vaudreuil on July 27, 2021 and co-opting of David Gansberg.
  • Nathalie Bricker, Chief Financial Officer of Natixis, waives her compensation for her participation on the Board of Directors of COFACE SA pursuant to the Natixis policy. The same applies to Anne Sallé-Mongauze, CEO of a wholly owned subsidiary of Natixis.
  • Laetitia Léonard-Reuter and Laurent Musy were appointed as directors following the Combined General Meeting of May 17, 2022. These appointments follow the expiry of the directorships of Olivier Zarrouati and Éric Hémar, respectively.

2.3.6Stock options or warrants awarded in financial year 2022 to each executive corporate officer by the Company or by any company in the Group

/Table 4 – AMF/AFEP-MEDEF

None – no stock options or warrants were awarded to executive directors during the financial year ended December 31, 2022.

2.3.7Stock options or warrants exercised in financial year 2022 by each executive corporate officer

/Table 5 – AMF/AFEP-MEDEF

None – no stock options or warrants were exercised by an executive corporate officer during the financial year ended December 31, 2022.

2.3.8Free shares awarded during financial year 2022 to each corporate officer

The conditions for the free share allocation are described in Section 2.3.4. The table below provides a description of the free performance shares awarded to Xavier Durand under the 2022 Long-Term Incentive Plan.

/Shares awarded to each corporate officer (Table 6 – AMF/AFEP-MEDEF)


Plan date

Number of shares awarded during the financial year

Valuation of shares in euros according to the method used for the consolidated financial statements (1)

Vesting date

Availability date (2)

Performance conditions

Xavier Durand

Chief Executive Officer

2022 Long-Term Incentive Plan

Feb. 15, 2022

75,000

€737,700

Feb. 15, 2025

Feb. 15, 2025

See table in Section 2.3.4

Total


75,000

€737,700


  • The value on the award date was €880,350 based on the average opening share price for the last 20 stock market trading sessions preceding the date of the Board meeting.
  • Xavier Durand must retain 30% of the shares acquired under the 2022 LTIP until the end of his term of office or of any other role that he might hold within Coface.

2.3.9Shares which have vested in financial year 2022 for each corporate officer

/Table 7 – AMF/AFEP-MEDEF


Plan No. and Date

Number of shares vested during the financial year

Xavier Durand

Chief Executive Officer

2019 Long-Term Incentive Plan

Feb. 11, 2019

75,000

As the performance condition was met in full, all of the shares awarded to Xavier Durand under the 2019 LTIP, i.e., 75,000 shares, were definitively vested on February 14, 2022 and delivered on February 16, 2022. As agreed under the Plan’s regulations, Xavier Durand must retain 30% of the shares acquired under the 2019 LTIP until the end of his corporate term of office or of any other role that he might hold within Coface, which corresponds to 22,500 shares under this Plan.

2.3.10History of stock option or warrant awards – information on subscription or purchase options

/Table 8 – AMF/AFEP-MEDEF

None, no stock options or warrants were awarded during the financial years ended December 31, 2022, 2021, 2020, 2019 and 2018.

No plan to award stock options or warrants is pending at the date of this Universal Registration Document.

2.3.11Stock options or warrants granted to the top ten employees who are not corporate officers

No stock options or warrants were awarded during the financial years ended December 31, 2022, 2021, 2020, 2019 and 2018 to the top ten employees who are not corporate officers.

No plan to award stock options or warrants is pending at the date of this Universal Registration Document.

2.3.12History of free share awards

372,268 performance shares were awarded under the 2019 LTIP, out of the 434,055 available shares representing the total package allocated to this plan by the Board of Directors. 70,000 performance shares were awarded to the Chief Executive Officer for a value of €564,445 on the award date (IFRS fair value of €463,260). The remaining 302,268 performance shares were awarded to members of the Executive Committee, to the regulated category of employees and to a number of other employees, with a view to their retention. In addition, in certain countries where the award of free shares was too complicated or impossible, a “phantom shares” solution was implemented for some beneficiaries (28,520 phantom shares). As the performance condition was fully met, all of the shares awarded under this plan were delivered in February 2022, subject to the beneficiaries’ continued presence in the company at the vesting date, representing 357,388 free shares and 27,280 phantom shares.

312,200 performance shares were awarded under the 2020 LTIP, out of the 347,841 available shares representing the total package allocated to this plan by the Board of Directors. 75,000 performance shares were awarded to the Chief Executive Officer for a value of €862,463 on the award date (IFRS fair value of €717,900). The remaining 237,200 performance shares were awarded to members of the Executive Committee, to the Solvency II “regulated” category of employees and to a number of other employees, with a view to their retention. In addition, in certain countries where the award of free shares was too complicated or impossible, a “phantom shares” solution was implemented for some beneficiaries (28,109 phantom shares). As the performance condition was fully met, all of the shares awarded under this plan were delivered in February 2023, subject to beneficiaries’ continued presence on the vesting date, i.e. 299,391 free shares and 26,409 phantom shares.

408,403 performance shares were awarded under the 2021 LTIP, out of the 467,754 available shares representing the total package allocated to this plan by the Board of Directors. 75,000 performance shares were awarded to the Chief Executive Officer for a value of €641,363 on the award date (IFRS fair value of €533,850). The remaining 333,403 performance shares were awarded to members of the Executive Committee, to regulated categories of employees and to a number of other employees, with a view to their retention. In addition, in certain countries where the award of free shares was too complicated or impossible, a “phantom shares” solution was implemented for some beneficiaries (46,700 phantom shares).

320,849 performance shares were awarded under the 2022 LTIP, out of the 425,966 available shares representing the total package allocated to this plan by the Board of Directors. 75,000 performance shares were awarded to the Chief Executive Officer for a value of €880,350 on the award date (IFRS fair value of €737,500). The remaining 245,849 performance shares were awarded to members of the Executive Committee, to the Solvency II “regulated” population and to a number of other employees, with a view to their retention. In addition, in certain countries where the award of free shares was too complicated or impossible, a “phantom shares” solution was implemented for some beneficiaries (84,256 phantom shares) – see Section 7.2.3 “Own shares and the acquisition of treasury shares by the Company”.

/History of free share awards (Table 9 – AMF/AFEP-MEDEF)


Long-Term Incentive Plan*


2022

2021

2020

2019

Meeting date

May 12, 2021

May 16, 2018

May 16, 2018

May 16, 2018

Date of the Board of Directors’ meeting

Feb. 15, 2022

Feb. 10, 2021

Feb. 5, 2020

Feb. 11, 2019

Total number of free shares awarded

320,849

408,403

312,200

372,268

of which allocated to Xavier Durand

75,000

75,000

75,000

70,000

Share vesting date

Feb. 15, 2025

Feb. 12, 2024

Feb. 6, 2023

Feb. 14, 2022

End-date of the retention period

N/A

N/A

N/A

N/A

Number of shares subscribed

-

-

-

-

Cumulative number of cancelled or lapsed shares

-

-

-

-

Remaining free shares awarded at financial year-end

320,849

408,403

312,200

372,268

* The performance conditions are described in Section 2.3.4.


/Table summarising the multi-year variable compensation paid to each executive corporate officer (Table 10 – AMF/AFEP-MEDEF)

None.

2.3.13Employment contracts, retirement indemnities and indemnities in the event of termination of the duties of the executive directors

/Employment contracts, retirement indemnities and indemnities in the event of termination of the duties of the executive directors (Table 11 – AMF/AFEP-MEDEF)


Employment contract

Supplementary retirement scheme

Compensation or benefits due or which could be due as a result of a termination or change of duties

Indemnities
 related to a non-competitor clause

Executive corporate officers

Yes

No

Yes

No

Yes

No

Yes

No

Bernardo Sanchez Incera

Chairman of the Board of Directors

From February 10, 2021 until the Ordinary Shareholders’ Meeting called to approve the financial statements for the financial year ending December 31, 2024


X


X


X


X

Xavier Durand

Chief Executive Officer

From February 5, 2020 until the Ordinary Shareholders’ Meeting called to approve the financial statements for the financial year ending December 31, 2023


X

 (1)


  • The Chief Executive Officer benefits from health, retirement and personal protection plans under the conditions applicable to all employees within the Company, as well as the supplementary retirement scheme approved in 2022 for members of the Executive Committee.
Severance compensation granted to Xavier Durand

Should his corporate term be terminated, Xavier Durand would be entitled to severance pay of an amount equal to two years’ salary (fixed and variable). The reference used for the fixed portion will be the salary for the current financial year at the date his duties cease. The reference amount for the variable portion will be the average of the variable compensation received for the three financial years preceding the date his duties cease.

This severance pay shall be due if the following performance criteria have been met:

  • achievement of at least 75% of the average annual objectives during the three financial years preceding the departure date; and
  • the Company’s combined ratio after reinsurance is at most 95% on average for the three financial years preceding the departure date.

If just one of the two conditions above has been fulfilled, 50% of the severance pay will be due. If neither of the conditions above has been met, no severance pay will be due. No severance pay will be paid by the Company if the corporate term is ended at Xavier Durand’s initiative or in the event of termination for serious misconduct or gross negligence. The compensation components and corporate benefits governed by the regulated agreements procedure in accordance with the provisions of the French Commercial Code are subject to approval by the Company’s Shareholders’ Meeting.

Xavier Durand does not have an employment contract.

Following the renewal of his term of office in 2020, given his responsibilities as Chief Executive Officer and in order to preserve the Company’s interests, the Board of Directors resolved to introduce a non-competitor clause.

It is understood that the total maximum amount paid to Xavier Durand in respect of severance compensation and the non-competitor clause may under no circumstances exceed two years’ salary (fixed and variable).

2.3.14Amounts placed in reserve or otherwise recorded by the Company or its subsidiaries for the purposes of paying pensions, retirement or other benefits

As Xavier Durand is entitled to the collective scheme within the Company, no particular amount was reserved or recorded by the Company or its subsidiaries for the purposes of paying pensions, retirement or other benefits to its executive directors.

Environment 
& Outlook

€1,812M 
turnover in 2022

64.9% 
Annual net combined ratio

€283.1m 
Net income (group share)

80% 
proposed payout ratio

(1)
The information presented in this table is correct as at December 31, 2022.
(2)
In accordance with legal requirements and the recommendations of the AFEP-MEDEF Code, Coface directors cannot hold more than four other offices in listed companies outside the Group, including abroad.
(3)
Listed company.
(4)
Listed company.
(5)
Listed company.
(6)
Listed company.
(7)
Listed company.
(8)
Listed company.
(9)
https://www.medef.com/uploads/media/default/0020/01/14911-code-afep-medef-version-de-decembre-2022.pdf
(10)
Listed company.
(11)
Note: the company plans to increase the deferred component of the variable compensation to 40% for financial year 2023, for all employees falling within the scope of the regulated employees.
(12)
See also Section 8.1.3 on the principles and components of the Chief Executive Officer’s compensation
(13)
Benchmark performed by Willis Towers Watson on a panel of 30 SBF 80 companies comparable with Coface in terms of headcount, turnover and/or geographic scope.

3. COMMENT ON THE FINANCIAL YEAR

(1)
Group estimates.

3.1Economic Environment

After a post-Covid rebound of 5.9% in 2021, the global economy slowed to 3.0% in 2022 (at market exchange rates). The trend can largely be explained by the slowdown in China resulting from its zero-Covid policy, given the country’s weight in the global economy. The slowdown can also be attributed to the surge in inflation, at 8.0% in 2022 compared with 4.3% in 2021. Commodity and intermediate prices soared while supply chains failed to return to normal.

Inflation also spiked following Russia’s invasion of Ukraine on February 24. The outbreak of hostilities was followed by extensive sanctions and counter-sanctions that impacted trade and financial exchanges with the two countries, along with Belarus. Russia and Ukraine play a major role in global trade in agricultural products, fertilisers, minerals and hydrocarbons.

Central banks in developed economies joined those in emerging economies having tightened their monetary policy in second-half 2021 to combat inflation and support their currencies against the dollar, the latter boosted by rising uncertainties. Governments once again intervened to mitigate the impact of galloping energy and food prices on households. As a result of this aid, and the savings accumulated during the pandemic, consumption proved resilient in the first half of the year. Companies also benefited from support measures to cope with rising production costs. But this did not prevent companies in energy-intensive sectors, such as glass, fertilisers, metallurgy, paper-cardboard, food or construction materials, from reducing or halting production at some plants as they were unable to pass on the increase in their costs. In this respect, a distinction must be made between regions with relatively cheap energy, such as the Middle East and North America, and the rest.

Despite the dip in certain commodity prices in the second half, global trade increased in value (1) by USD 32,000 billion, 13% higher than in 2021 and 27% higher than in 2019. Trade in goods came out at USD 25 trillion, up 10% and 32% respectively. At USD 7 trillion, trade in services increased 15% and 11% respectively. In volume terms (2), trade in goods rose by nearly 3% in 2022 compared with 2021, with strong momentum in the first half of the year giving way to a sharp slowdown in the second half. Trade in services, which also returned to its pre- Covid peak in the second quarter, slowed less sharply.

With growth of 2.6% in 2022 (after 5.3% in 2021), the economies of developed countries slowed as a whole. The trend began in the last few months of 2021, when all sectors were impacted by numerous shocks, including supply issues, an increase in energy, materials and food prices, workforce shortages, and a fresh wave of Covid-19 with the Omicron variant. However, the main cause of the trend is the outbreak of war in Ukraine at the end of February 2022, which exacerbated the rise in producer and consumer prices. With inflation impacting all products, and wages rising substantially in some countries, central banks have been forced to raise interest rates vigorously.

Growth in Western Europe came out at 2.6% in 2022 (after 4.5% in 2021). The figure would have been even lower if the autumn had not been mild, reducing the need for heating and easing pressure on energy prices. There were also considerable disparities in growth.

  • Portugal, Spain, Austria and Greece (with growth of 6.5%, 5.5%, 4.8% and 4.5%, respectively) took full advantage of the strong rebound in tourism.
    • Spain and Portugal also benefited from a relatively lower energy price environment.
    • While Greece capitalised on its vital role in maritime transport.
  • The Irish economy (11.1%) was buoyed by the strength of the pharmaceutical and IT industries, as well as the robust results of the European head offices of global groups attracted by the country’s tax benefits.
  • The UK economy (4.4%) slowed throughout the year, going as far as stagnation. Consumption and investment were negatively impacted by high inflation and tighter credit.
  • Meanwhile, the Netherlands (4.2%), Western Europe’s trade gateway, benefited from the higher value of trade.
  • Belgium, Denmark, France, Italy, Norway and Sweden ranked in the middle with growth of between 2.5% and 3.5%.
    • The tourism industry offset industrial and energy issues in France and Italy, while Scandinavian countries benefited from their advantageous positioning in energy, electronics and pharmaceuticals.
  • At the bottom of the rankings, Germany (1.8%) suffered from its dependency on mechanical and automotive exports to China.

Among other advanced economies:

  • the US economy also slowed sharply, with growth of 1.9% in 2022, after 5.9% in 2021. Despite its weak trade links with Russia and Ukraine and its status as a net exporter of energy and other commodities, the US still suffered from the rise in global commodity prices. It also faced a decline in its labour force participation rate following Covid, which kept wages high. The Fed took aggressive action to deal with inflation by raising interest rates. The resulting increase in the cost of credit and the sharp drop in stock market values weighed on investment, particularly in the construction sector. Consumption held up better due to the savings accumulated during the pandemic;
  • Canada, with growth of 3.5%, fared better than its neighbour owing to its higher share of commodity exports;
  • the Australian economy (3.4%) held up relatively well despite a slowdown in domestic demand driven by inflation and monetary tightening;
  • Israel (5.0%) benefited from its autonomous gas supply, the arrival of Russian and Ukrainian immigrants, its high-tech focus, and relatively limited inflation;
  • Japan’s economy slowed to 1.1%, a weak performance but in line with its potential. The export sector suffered from China’s poor form, while its imports bill rose. In addition, consumers faced inflation exacerbated by the depreciation of the yen;
  • South Korea (2.6%) was also negatively impacted by weaker external demand, particularly for its semiconductors.

Emerging and developing economies expanded by 3.6% in 2022 after 6.7% in 2021. However, there were wide disparities between regions and countries.

The Middle East and North Africa region is the only emerging or developing region that posted higher economic growth in 2022 than in 2021, with 5% after 4.4%.

  • Unsurprisingly, oil- and gas-producing countries benefited from the high prices: Algeria (+4.5% after +3.5%), Saudi Arabia (+7% after +3.2%), United Arab Emirates (+6.0% after +3.8%), Iraq (+9% after +7.7%), Oman (+5.5% after +3%), and Qatar (+5.0% after +1.6%).
  • Iran recorded modest growth (3.5%) for the third year in a row despite international sanctions.
  • The Egyptian economy grew 6.5% (after only 3.3% due to the pandemic) over its 2021-2022 fiscal year thanks to the Suez Canal, natural gas and public investment. But activity slowed sharply in the second half of the year on high inflation, tighter credit and import restrictions.
  • In contrast, growth dipped in Morocco (1.0% after 5.7%) owing to poor harvests caused by drought.
  • Growth also declined in Tunisia (2.2% after 3.3%) on inflation and political and social difficulties.

With growth of 3.7% in 2022, after 7.2% in 2021, emerging Asia confirmed its resilience to external shocks:

  • as the slowdown resulted from China’s poor health (3.0% after 8.1%) caused by its zero-Covid strategy and the tightening of regulations on real estate activity. However, the relative isolation of its food market and advantageous prices on Russian oil and gas helped contain inflation, while public investment in infrastructure boosted domestic demand;
  • the Indian economy proved resilient (6.8% in 2022, after 8.3% in 2021) despite the impact of inflation (particularly food prices) and higher interest rates on domestic demand. The strength of its pharmaceutical exports and IT services contributed positively;
  • growth in Indonesia rose from 3.7% in 2021 to 5.3% in 2022 on strong momentum in coal, nickel and palm oil exports. Its post-COVID reopening boosted tourism and domestic demand;
  • growth in Malaysia (8.0% after 3%), Vietnam (7.9% after 2.6%) and the Philippines (7.1% after 5.7%) also picked up thanks to domestic demand, electronic exports and tourism. 
  • In Thailand, the improvement (from 1.6% to 3.2%) was limited by the delayed and only partial return of tourists, despite the strength of electronics and automotive exports.

Latin American growth slowed from 7.1% in 2021 to 3.6% in 2022.

  • Brazilian growth came out at 2.9% (after 5.0% in 2021). Domestic demand held up strongly despite tighter credit and high inflation, as social transfers, tax exemptions and employment growth played their part. Mineral and agricultural exports prospered.
  • In Argentina, growth slowed throughout 2022 to 5.1% (after 10.3% in 2021). Consumption and investment collapsed due to skyrocketing inflation and restrictions on capital movements and imports, while strong agricultural exports were offset by energy prices.
  • Colombian growth held up well (8.0% in 2022 after 10.7% in 2021), boosted by sales of coal, oil and gold, with consumer spending underpinned by strong employment and wages.
  • In Peru, growth slowed throughout 2022 to just 2.5% over the year, after 13.6% in 2021. This can be attributed to the impact of strikes in copper mines (the price of which has fallen) and political chaos, which dampened investment. Meanwhile, consumption held up well thanks to fiscal support measures and a new scheme allowing savers to withdraw their money from pension funds.
  • In Mexico, growth was down from 4.8% in 2021 to 2.6% in 2022, with domestic consumption, boosted by employment, with wages and expatriate remittances proving resilient.
  • In Chile (2.7%), domestic demand was hit by inflation, tighter credit and rising unemployment as well as a decline in Chinese demand for copper.

Sub-Saharan Africa saw its growth slow slightly from 4.6% in 2021 to 3.5% in 2022.

  • In Nigeria, growth varied little (down from 3.6% in 2021 to 3.2% in 2022) and remains relatively low relative to the country’s population growth. The country benefited only minimally from high oil prices as a result of operating constraints, while agriculture was impacted by insecurity and flooding.
  • In South Africa, growth came in at 2.1% in 2022 after 4.9% in 2021. The impact of rolling blackouts and flooding in KwaZulu-Natal on mining was offset by strong domestic demand supported by social transfers. These were facilitated by an improvement in the fiscal position thanks to increased revenue from mineral exports.
  • The recovery was confirmed in both Angola (3.2% in 2022 after 0.8% in 2021) due to the increase in oil revenues, and Mozambique (3.9% after 2.3%) thanks to coal, aluminium and electricity.
  • In Kenya, activity held up well (5.3% in 2022 after 7.5% in 2021) thanks to the post-Covid rebound, despite the impact of imported inflation, which was exacerbated by the impact of drought on agriculture in the north.
  • In Ethiopia, growth shrank from 6.5% in 2021 to 3.5% in 2022, with the war in Tigray, the suspension of international aid and drought continuing to have a negative impact.
  • Growth remained strong in Tanzania (4.5% in 2022 after 4.9% in 2021), with tourism and gold mining continuing to expand and infrastructure construction maintaining momentum.
  • In Ghana, growth fell from 5.4 to 3.6% due to runaway inflation and the corresponding increase in the cost of credit, despite the strong performance of oil, gold and cocoa.
  • Finally, in Côte d’Ivoire, growth remained strong (5.0%), driven by agricultural exports, the agri-food industry and relatively controlled inflation thanks to government measures.

Central European economies slowed from 6.0% growth in 2021 to 4.1% in 2022.

  • Poland followed this pattern (4.4% in 2022, after 6.8% in 2021). Excluding inflation, consumer spending continued to benefit from rising wages in a tight labour market and from the arrival of many Ukrainians. This partially offset the slowdown in exports.
  • Hungarian growth held up well (5.2% after 7.1%), for the same reasons.
  • In the Czech Republic, growth fell from 3.5% to 2.5% owing to sluggish consumption resulting from inflation and a sharp drop in exports as industry suffered from input shortages.
  • Conversely, Romanian growth increased considerably, from 5.1% to 5.8%, thanks to strong momentum in private consumption boosted by substantial inflows of Ukrainians.
  • Further to the east, Turkey saw its growth contract from 11.4% in 2021 to 5.5% in 2022. While consumer spending was hit by inflation, exports benefited from the rebound in tourism and the country’s role in offering an alternative to Asian products.
  • Ukraine’s economy collapsed by 35% due to the war.
  • While Russia managed to limit the decline to 3.5% thanks to oil and gas revenues. Regarding the gas sector, the positive price effect trumped the negative volume effect, while China and India provided an alternative to Europe for oil exports.
  • Lastly, Kazakhstan, which was unable to fully benefit from its oil owing to a problem with a pipeline to the Caspian Sea, achieved growth of 3.3% in 2021, up from 2.6% in 2022.
/Change in GDP growth by country (3):
COA2022_URD_EN_G003_HD.png
(1)
According to UNCTAD (estimate at November 30, 2022)
(2)
According to the WTO (estimates in November and December 2022).
(3)
Source: FMI for 2021, Coface estimates and forecasts for 2022 and 2023

3.2Significant events of 2022

3.2.1Governance evolution

In the Board of Directors

On May 17, 2022, during the Combined General Meeting, Laetitia Leonard – Reuter and Laurent Musy have been elected as independent directors for a term of four years. These appointments follow the expiration of the terms of office of Olivier Zarrouati and Éric Hémar, respectively.

Thus, at the close of the General Meeting, the Board of Directors is composed of 10 members, 5 women and 5 men, the majority (6) of whom are independent directors.

In the Executive Committee

On May 2, 2022, Hugh Burke has been appointed as the CEO of Coface Asia-Pacific region, effective on April 1, 2022. He joins the Group Executive Committee and reports to Xavier Durand, Coface CEO. He takes over from Bhupesh Gupta.

On September 8, 2022, Matthieu Garnier, Group Information Services Director, joined the Group Executive Committee and will continue to report to Thibault Surer, Group Strategy & Development Director. This decision is part of our strategy to develop information services, one of the major pillars of our Build to Lead plan.

3.2.2Natixis announces the sale of its residual stake in COFACE SA

On January 6, 2022, Natixis announced the sale of its remaining interest in COFACE SA. This sale represented approximately 10.04% of COFACE SA’s share capital, or 15,078,095 shares. It was carried out by way of an ABB (accelerated book-building) at an average price of €11.55. Following this transaction, Natixis no longer held any shares in COFACE SA.

3.2.3Anticipated impacts of the Ukraine crisis

The invasion of Ukraine by Russia on February 24, 2022 has triggered a war in Europe for the first time since the Second World War. This armed conflict and the numerous economic sanctions taken against Russia had serious economic, financial an inflationary consequences for the whole world.

In this context, Coface has adjusted its assessments of Russian, Belarusian and Ukrainian risks and reduced its exposure to these countries during 2022. The Group continues to monitor closely the situation on a daily basis and is constantly adjusting its underwriting policy to ensure compliance with international sanctions.

To date, and subject to any changes in the situation, this serious crisis has greatly increased uncertainty and volatility due to its multi-sector and multi-geographical impact.

Coface is not directly exposed to the countries in conflict through its investment portfolio.

Coface Russia Insurance’s earned premiums will amount to €11.6 million in 2022 (vs. €12.5 million in 2021, i.e. 1% of the Group total) and this subsidiary contributed €25.8 million to the Group’s total balance sheet in 2022 (i.e. 0.3% of the consolidated total balance sheet). Losses related to this conflict have increased but remain limited at the Group level.

The Group’s exposure to Russian debtors has decreased from just under 1% of total exposure to 0.1% as at December 31, 2022.

3.2.4Financial and non-financial rating agency

AM Best affirms Coface’s main operating subsidiaries rating at A (Excellent) with a stable outlook

On April 7, 2022, the rating agency AM Best affirmed the A (Excellent) Insurer Financial Strength – IFS rating of Compagnie française d’assurance pour le commerce extérieur (la Compagnie), Coface North America Insurance Company (CNAIC) and Coface Re. The outlook for these ratings remain “stable”.

MSCI upgrades COFACE SA’s rating from AA to AAA.

On July 14, 2022, COFACE SA’s rating was upgraded to “AAA” by the extra-financial rating agency MSCI, which analyzes the environmental, social and governance (ESG) practices of thousands of companies worldwide.

This places COFACE SA in the top 4% of companies in its industry (“Property & Casualty Insurance” category).

Moody’s affirms Coface’s ratings, changes outlook to positive

On October 11, 2022, the rating agency Moody’s has confirmed the financial strength rating (Insurance Financial Strength Rating – IFSR) for Coface at A2. The agency has also changed the outlook for Coface to positive from stable.

Fitch affirms Coface AA- rating, with ‘stable’ outlook

On November 23, 2022, the rating agency Fitch affirmed Coface AA- Insurer Financial Strength (IFS) rating. The outlook remains stable.

3.2.5Success of its debt management exercise

On September 21, 2022, COFACE SA announced the results of the tender offer to repurchase its guaranteed subordinated notes of an amount of €380,000,000 bearing a fixed interest rate of 4.125 per cent., due on March 27, 2024. The Company accepted the repurchase of a principal amount of EUR 153,400,000 Notes validly tendered at a fixed purchase price of 103,625 per cent.

COFACE SA also announced the issuance on September 22, 2022 of €300,000,000 tier 2 notes bearing a fixed interest rate of 6.000 per cent., due on September 22, 2032.

3.2.6Coface New Zealand: new branch opens

On April 4, 2022, Coface announced the opening of an office in New Zealand after the approval from the Reserve Bank of New Zealand. This is in line with its ambitions to grow in new high-potential markets.

According to the World Bank, the value of New Zealand’s exports reached $50.5 billion in 2020. This market therefore offers significant potential to develop the credit insurance solutions and adjacent specialty services.

3.3Comments on the results as at December 31, 2022

3.3.1Group performance

Consolidated turnover amounted to €1,812.0 million, up 13.4% on 2021 at constant FX and perimeter. The net combined ratio stood at 64.9%, or 0.3 points above the level recorded in 2021 (64.6%). This breaks down into a 2.7-point increase in the loss ratio to 36.0% and a 2.5-point decline in the cost ratio to 28.8% compared with 2021. The Group ended the year with net income (Group share) up 26% at €283.1 million (vs. €223.8 million in 2021) and return on equity of 15.6%.

The target solvency ratio ranges between 155% and 175%. The solvency ratio is estimated at 200.53% at December 31, 2022 (1). Coface will propose the payment of a dividend (2) of €1.52 per share to shareholders, representing a payout ratio of 80%.

The changes at constant FX and perimeter, presented for comparison purposes in the tables below, take into account the integration of the following entities:

  • in 2021: Coface Poland Insurance Services, Coface Romania Insurance Services, Coface Finance Israel and Coface Servicios Mexico;
  • in 2022: Coface Norden Services (Denmark), Coface Sverige Services (Sweden), Coface Services Suisse, Coface Baltic Services (Lithuania) and Coface Servicios Argentina.

3.3.2Turnover

The Group’s consolidated turnover increased by 13.4% at constant FX and perimeter (+15.6% at current FX and perimeter), to €1,812.0 million at December 31, 2022, mainly due to a rebound in client activity in the insurance business.

The table below shows changes in the Group’s consolidated turnover by business line as of December 31, 2021 and 2022:

Change in consolidated turnover by business line

(in millions of euros)

As at Dec. 31

Change

2022

2021

(in €m)

as a %

as a %: at constant FX and perimeter

Insurance

1,741.6

1,503.5

238.1

15.8%

13.5%

o/w Gross earned premiums*

1,527.5

1,312.6

214.8

16.4%

14.4%

o/w Services**

214.1

190.8

23.3

12.2%

8.0%

Factoring

70.4

64.4

6.0

9.3%

10.0%

Consolidated turnover

1,812.0

1,567.9

244.1

15.6%

13.4%

*     Gross earned premiums-credit, Single Risk and surety bond insurance.

**   Sum of turnover from services related to credit insurance (“Fee and commission income” and “Other insurance-related services”) and services provided to customers without credit insurance (access to information on corporate solvency and marketing information – “Information and other services”, and debt collection services – “Receivables management”).

Insurance

Turnover from the insurance business (including surety bond and Single Risk insurance) was up 13.5% at constant FX and perimeter (+15.8% at current FX and perimeter), at €1,741.6 million in 2022, compared with €1,503.5 million in 2021.

Gross earned premiums increased by 14.4% at constant FX and perimeter (+16.4% at current FX and perimeter), to €1,527.5 million in 2022, compared with €1,312.6 million in 2021.

This growth was mainly due to the sharp increase in activity for Coface’s clients throughout 2022 (+80.3%), reflecting the rebound in the global economy and high inflation.

The production of new contracts totalled €110 million, down by €18.7 million from 2021.

The contract retention rate (ratio between the annual value of renewed policies and the value of policies to be renewed during the year) reached a record level of 92.9% over the year for the Group (compared with 91.6% at December 31, 2021). All regions contributed to this high retention rate with the exception of Central and Eastern Europe, which was impacted by the reduction in exposures to Russia.

The price effect was negative, at -3.04%, in a market with low claims volumes and following the selective repricing policy applied in 2021 (+0.7%).

Turnover from the services business was up by 8% at constant FX and perimeter (up +12.2% at current FX and perimeter), rising from €190.8 million in 2021 to €214.1 million in 2022. The debt collection business was impacted by the low loss experience. The business information sales activity grew sharply (+11.6% at constant FX and perimeter) following investments in this business.

COA2022_URD_EN_G016_HD.png
Factoring

Factoring turnover (only in Germany and Poland) increased by 10.0% at constant FX (+9.3% at current FX), from €64.4 million in 2021 to €70.4 million in 2022.

In Germany, revenue was up 5.1% due to a rebound in volumes financed. Poland was also impacted by this rebound and it recorded an increase in factoring revenue of 32.2% at constant FX (+28.7% at current FX).

Change in turnover by region

The table below shows trends in Coface Group’s consolidated turnover in its seven geographic regions for the financial years ended December 31, 2021 and 2022:

Change in consolidated turnover by invoicing region

(in millions of euros)

As at Dec. 31

Change

2022

2021

(in €m)

as a %

as a %: at constant FX

as a %: at constant FX and perimeter

Western Europe

359.6

316.7

43.0

13.6%

12.9%

12.7%

Northern Europe

372.3

331.5

40.8

12.3%

12.3%

11.3%

Mediterranean and Africa

480.6

429.4

51.2

11.9%

13.8%

13.8%

North America

168.0

137.5

30.5

22.2%

9.3%

9.3%

Central Europe

178.5

156.3

22.3

14.3%

14.3%

13.4%

Asia-Pacific

151.3

123.2

28.1

22.8%

14.6%

14.6%

Latin America

101.6

73.3

28.3

38.5%

30.0%

29.0%

Consolidated turnover

1,812.0

1,567.9

244.1

15.6%

13.8%

13.4%

All regions achieved growth in turnover at constant FX and perimeter, ranging from +9.3% for Northern Europe to +29.0% for Latin America.

In Western Europe, turnover was up 12.7% at constant FX and perimeter, buoyed by the growth in short term credit insurance. This positive change was strongly linked to the economic rebound and high inflation, which generated an increase in policyholders’ revenue. Conversely, new contract production declined in 2022 compared to 2021.

In Northern Europe, turnover rose by 11.3% at constant FX and perimeter (12.3% at current FX and perimeter). Credit insurance and fee and commission income were the main contributors to this growth thanks to the rebound in policyholders’ activity.

Turnover in the Mediterranean & Africa region grew by 13.8% at constant FX and perimeter, confirming the strong sales momentum in this region (high retention rate and new contract production) and the development of the Information Services activity. This good commercial performance was boosted by strong activity levels for Coface’s policyholders.

In North America, turnover increased by 9.3% at constant FX and perimeter. The credit insurance portfolio is growing mainly due to the high client activity.

Central Europe posted an increase in turnover of 13.4% at constant FX and perimeter (+14.3% at current FX and perimeter). The increase in credit insurance premiums and factoring revenues were the main drivers of turnover growth in 2022. Gross insurance premiums (+11.9% at constant FX and perimeter) were impacted by the rebound in policyholder activity.

Asia-Pacific recorded a 14.6% increase in turnover at constant FX and perimeter. This growth was driven by credit insurance, with the development of the portfolio linked to the sharp increase in client activity, despite a decline in new business. Single Risk insurance grew sharply for the Singapore entity.

Latin America posted an increase in turnover of 29.0% at constant FX and perimeter (+38.5% at current FX) due to the sharp rebound in activity in the commodities sector and inflation.

3.3.3Underwriting income

Underwriting income before reinsurance

Underwriting income before reinsurance stood at €529.1 million, down 10.0% compared to end-December 2021 (€588.2 million), reflecting the increase in the loss ratio.

The 10.3-point increase in the combined ratio before reinsurance to 64.7% in 2022 (from 54.4% in 2021) was attributable to a 9.8-point rise in the loss ratio and a slight increase in the cost ratio of 0.4 point.

Loss experience

The Group’s loss ratio before reinsurance, including claims handling expenses, increased by 9.8 points, from 21.4% for 2021 to 31.2% in 2022. This increase in claims is explained by a gradual normalisation of the loss experience compared to 2021, which recorded a particularly low loss experience.

(in millions of euros and as a %)

As at Dec. 31

Change

2022

2021

(in €m)

as a %

Claims expenses incl. claims handling costs

476.8

280.5

196.3

70.0%

Loss ratio before reinsurance

31.2%

21.4%

-

9.8 pts

Earned premiums

1,527.5

1,312.6

214.8

16.4%

In Western Europe, the loss ratio increased by 13 points to 37.3%. This increase is explained by the anticipation of claims in France and the United Kingdom, partly linked to the Russia-Ukraine context.

Impacted by extremely high claims in the Netherlands and Germany and the anticipation of future claims, Northern Europe recorded a loss ratio of 35% compared with 18.2% in 2021.

The loss ratio in the Mediterranean & Africa region increased by 7.2 ppts compared to 2021 and stood at 34.6%. The main countries in the region are seeing a normalisation in the loss experience compared to 2021.

In North America, the loss ratio rose by 9 points to 23.4%, vs. 14.4% in 2021. This region, which is more responsive to the economic environment, saw the loss experience decline very sharply in 2021 and gradually return to normal levels in 2022.

The loss ratio in Central Europe improved by 4.3 points to 14.5%, vs. 18.8% in 2021. The evolution remains favourable despite the anticipation of losses linked to the Russian-Ukrainian context.

The Asia-Pacific loss ratio rose by 1.1 points to 9.9%. Record reserve levels, taking into account a volatile loss experience, were partially reversed for the oldest underwriting years. The region’s loss ratio stabilised in line with good trends in the loss experience.

Latin America’s loss ratio increased by 32.9 points to 39.8% compared with 6.9% in 2021. This region is suffering from the impact of extremely high claims at the end of 2022.

Change in loss experience by invoicing region

(as a%)

As at Dec. 31

Change in points

2022

2021

Western Europe

37.0%

24.3%

12.7 pts

Northern Europe

35.0%

18.2%

16.8 pts

Mediterranean and Africa

34.6%

27.4%

7.2 pts

North America

23.4%

14.4%

9.1 pts

Central Europe

14.5%

18.8%

(4.3 pts)

Asia-Pacific

9.9%

8.8%

1.0 pts

Latin America

39.8%

6.9%

32.9 pts

Loss ratio before reinsurance

31.2%

21.4%

9.8 pts

/Overheads

Overheads

(in millions of euros)

As at Dec. 31

Change

2022

2021

(in €m)

as a %

as a %: at constant FX and perimeter

Internal overheads

649.4

572.7

76.6

13.4%

10.9%

o/w claims handling expenses

39.9

36.2

3.7

10%

10%

o/w internal investment management expenses

4.3

4.0

0.3

7.1%

6.9%

Commissions

201.2

166.8

34.4

20.6%

18.2%

Total overheads

850.5

739.5

111.0

15.0%

12.6%

Total overheads, which include claims handling expenses and internal investment management expenses, increased by 12.6% at constant FX and perimeter (15% at current FX and perimeter), from €739.5 million at December 31, 2021 to €850.5 million at December 31, 2022.

Policy acquisition commissions rose by 18.2% at constant FX and perimeter (20.6% at current FX and perimeter), from €166.8 million in 2021 to €201.2 million in 2022. This increase is explained by the growth in premiums as well as the increase in bonuses in connection with a reduced claims experience.

Internal overheads, which include claims handling and investment expenses, increased by 10.9% at constant FX and perimeter (13.4% at current FX and perimeter), from €572.7 million in 2021 to €649.4 million in 2022.

Payroll costs increased by 7.1% at constant FX and perimeter (+9.3% at current FX and perimeter), from €337.7 million in 2021 to €369.3 million in 2022. New hires relating to the resumption of transformation projects and the development of adjacent business account for this increase.

IT costs were up 5.3% at constant FX and perimeter (6.1% at current FX and perimeter), from €53.9 million in 2021 to €57.2 million in 2022. Transformation projects and investments were re-prioritised to adapt to the crisis in 2021 and resumed in 2022.

Other expenses (taxes, information costs, rent) rose by 19.7% at constant FX and perimeter (23.3% at current FX and perimeter), from €181.1 million in 2021 to €223.4 million in 2022. This increase is mainly explained by the development of business information services.

The cost ratio before reinsurance increased by 0.4 points, from 33.1% in 2021 to 33.5% in 2022.

COA2022_URD_EN_G017_HD.png
Underwriting income after reinsurance

Underwriting income after reinsurance totalled €382.5 million, up by 39.7% compared with 2021 (€273.9 million).

The sharp decrease in the cost of reinsurance to -€146.6 million at December 31, 2022 (-€314.3 million at December 31, 2021) can be explained by the contribution of government reinsurance schemes in 2021.

(in thousands of euros and %)

As at Dec. 31

Change

2022

2021

(in €k)

(as a%)

Turnover

1,811,970

1,567,858

244,112

15.6%

Claims expenses

(476,779)

(280,456)

(196,323)

70.0%

Contract acquisition costs

(304,747)

(259,317)

(45,430)

17.5%

Administration costs

(314,460)

(270,990)

(43,470)

16.0%

Other expenses from insurance activities

(69,824)

(66,243)

(3,581)

5.4%

Expenses from banking activities, excluding cost of risk

(14,331)

(13,103)

(1,228)

9.4%

Cost of risk

308

76

233

307.3%

Expenses from other activities

(102,998)

(89,674)

(13,325)

14.9%

Underwriting income before reinsurance

529,138

588,150

(59,012)

(10.0%)

Income and expenses after ceded reinsurance

(146,610)

(314,288)

167,679

(53.4%)

Underwriting income after reinsurance

382,529

273,862

108,667

39.7%

Net combined ratio

64.9%

64.6%

-

-

The amount of ceded premiums under government reinsurance schemes renewed until June 30, 2021 came to €227.6 million in 2021, representing 44.4% of the total amount of ceded premiums.

The impact of government schemes on the Group’s ratios in 2021 is shown in the following chart:

COA2022_URD_EN_G018_HD.png

3.3.4Investment income, net of management expenses (excluding financing costs)

Trends in the financial markets

Russia’s invasion of Ukraine in February 2022 was a key event of the year. It exacerbated the inflationary pressure already being felt at the end of 2021 and significantly accelerated the pace and level of interest rate hikes by central banks. The Ukrainian crisis worsened the economic situation in the United States and even more so in Europe. Record inflation has reduced consumers’ purchasing power and the crisis led central banks to raise their key rates very quickly. Central banks were more concerned about a possible de-anchoring of inflation expectations than about the risks to growth. Europe is also suffering from the dramatic rise in gas prices as a result of the war. However, the majority of economic figures published during the fourth quarter were not quite as bad as expected. In China, the improvement that followed the easing of anti-Covid lockdowns was short-lived and further difficulties emerged in the real estate sector. The bond market crashed hard, with long-term yields rising by more than 2%, driving up the equity markets for most of the year.

In 2022, the US economy slowed on the back of lower real household income (due to very high inflation) and rising interest rates. The main economic indicators for businesses, such as the ISM indices, entered recession territory in November after slowing for a year. Despite a slight rebound, consumer confidence indicators fell sharply. In the real estate sector, which is highly sensitive to interest rates, figures were particularly disappointing. In contrast, job creation remained strong, the unemployment rate low and the working population saw the return of many workers who had stopped seeking work during the Covid-19 crisis. Inflation has fallen from its peak of 9% in June, while remaining very high (core inflation also peaked in September). The fixed income markets were extremely volatile. In 2022, the Federal Reserve made five rate hikes and clearly indicated its intention to prioritise the fight against inflation even if this were to have negative consequences on the labour market. Against this background, the US 10-year yield increased by 236 bp to 3.87% at the end of 2022. On the equity side, the S&P 500 fell by -19.4% over the year. Companies’ excellent quarterly earnings in Q3 triggered a rally at the beginning of Q4. However, US equities corrected in December in response to a surge in bond yields.

In Europe, the sharp rise in natural gas prices following the drastic reduction in Russian deliveries contributed to rising inflation and monetary tightening. Business climate indicators moved into negative territory in March, hitting a low in October, while consumer confidence collapsed with the Russian invasion and recovered slightly in the last quarter. However, the labour market remained strong, with the unemployment rate at its lowest level since the creation of the eurozone. Inflation exceeded 10% in September. After raising its key rates by 0.50% in July (the first increase since 2011), the ECB followed with three further increases over the rest of the year. The ECB president also indicated that the bank intends to continue this upward cycle to combat inflation despite the weakening growth outlook. Sovereign yields rose sharply over 2022, with the German 10-year yield adding 275 bps to end the year at 2.57%. On the equity markets, the Eurostoxx 50 was down -11.7% over the year.

Overall, the growth outlook for emerging markets has been revised downwards on the back of high inflation, slowing global trade and tighter global and domestic monetary conditions. The slowdown was more pronounced in Eastern Europe due to the European energy crisis and rising prices. Inflation is still very high and generally rising, although there has been a stabilisation in a few countries such as Brazil. Unsurprisingly, emerging market central banks continued their rate hikes (except Russia and Turkey) and some laggards finally joined the trend (Thailand, Indonesia). In China, while the economy recorded weak growth in the second quarter due to Covid restrictions, it could recover in 2023 with the easing of both these measures and monetary and fiscal policies.

Financial income

In this risk-off environment (high inflation, economic slowdown, war in Ukraine), Coface Group decided to reduce the risk in its portfolio in 2022 by lowering its exposure to assets the most at risk from the economic slowdown (equities, emerging markets and real estate) in favour of developed countries’ sovereign bonds. Finally, cash levels remained high throughout the year as a precautionary measure.

With regard to real assets, some real estate assets were reallocated from offices and retail to logistics and residential.

Over 2022, the overall value of the portfolio decreased by €198 million due to the decline in the equity and bond markets.

To adapt the investment strategy to the new IFRS 9, the listed equity portfolio was restructured to become a long-term investment segment that will be measured at fair value through non-recyclable other comprehensive income (FV OCI-NR). Bond investments will be recognised at fair value through recyclable other comprehensive income (FV OCI-R).

The following table shows the financial portfolio by main asset class:

/Market value

(in millions of euros)

As at Dec. 31

2022

2021

Listed shares

77

224

Unlisted shares

8

9

Bonds

2,265

2,115

Loans, deposits and money market mutual funds

367

507

Real estate

220

213

Total investment portfolio

2,937

3,068

Non-consolidated companies

85

152

Total

3,022

3,220

/Investment portfolio income

Income from the investment portfolio amounted to €62.3 million, including €17.7 million in capital gains on disposals, impairment/reversals and equity/interest rate derivatives (representing 2.1% of average annual assets in 2022 and 1.5% excluding capital gains, impairment/reversals and equity/interest rate derivatives). This compares with €36.7 million, including €3.6 million in capital gains on disposals, impairment/reversals and equity/interest rate derivatives in 2021 (representing 1.2% of average annual assets in 2021 and 1.1% excluding capital losses, impairment/reversals and equity/interest rate derivatives). The change in market values between 2021 and 2022 is mainly due to the first-time consolidation of non-consolidated entities. Finally, the FX effect was negative for €15.8 million in 2022 vs. +€7.0 million in 2021. This amount includes €13.3 million related to IAS 29 – hyperinflation (Coface is operating in Argentina and in Turkey).

In the current economic environment, the Group increased and reallocated its bond portfolio to protect and improve the portfolio’s return.

(in millions of euros)

As at Dec. 31

2022

2021

Equities*

37.9

(0.9)

Fixed income**

(0.6)

23.6

Investment property

25.1

14.0

Investment income

62.3

36.7

o/w realised gains, impairment and reversals, derivatives (equity and interest rate)

17.7

3.6

- o/w disposals

8.7

9.3

- o/w impairment and reversals

(0.1)

(1.2)

- o/w derivatives (equity and interest rate)

9.1

(4.5)

Investment income excluding realised gains

44.6

33.1

Foreign exchange income

(15.8)

7.0

- o/w foreign exchange

(29.6)

15.5

- o/w currency derivatives

13.9

(8.5)

Other

(6.4)

(1.6)

- o/w non-consolidated subsidiaries

2.7

6.2

- o/w financial and investment charges

(9.0)

(7.8)

Net income from investments

40.2

42.2

*   Including equity derivatives.

**  Including interest rate derivatives.

After income from equity securities, foreign exchange income, income from derivatives, and financial and investment expenses, the Group’s net financial income for 2022 totalled €40.2 million.

3.3.5Operating income

(in millions of euros)

As at Dec. 31

Change

2022

2021

(in €m)

(as a%)

(as a%: at constant FX and perimeter)

Consolidated operating income

413.5

312.9

100.7

32.2%

29.8%

Operating income including finance costs

383.9

291.4

92.5

31.8%

29.3%

Other operating income and expenses

(9.1)

(3.2)

(5.9)

187%

184%

Operating income including finance costs and excluding other operating income and expenses

393.0

294.6

98.5

33.4%

30.9%

Consolidated operating income increased by 29.8% at constant FX and perimeter, from €312.9 million for the year ended December 31, 2021 to €413.5 million for the year ended December 31, 2022.

Current operating income, including financing costs and excluding non-recurring items (other operating income and expenses), rose by 30.9% at constant FX and perimeter, from €294.6 million in 2021 to €393.0 million in 2022.

The net combined ratio increased by 0.3 percentage points, from 64.6% in 2021 to 64.9% in 2022, including a +2.8 percentage point increase in the net loss ratio and a decline of -2.5 percentage points in the cost ratio.

Other operating income and expenses amounted to -€9.1 million, comprising mainly the following:

  • expenses linked to investments for the implementation of IFRS 17 of €7.4 million;
  • income from the entry of five service entities into the scope of consolidation for €1.6 million;
  • provisions for restructuring costs of €3 million.

Change in operating income by invoicing region

(in millions of euros)

As at Dec. 31

Change

Share of annual total at Dec. 31, 2022

2021

2021

Western Europe

58.6

46.2

12.4

13%

Northern Europe

95.9

49.0

46.8

22%

Mediterranean and Africa

126.3

75.1

51.2

28%

North America

39.2

44.2

(4.9)

9%

Central Europe

74.0

58.0

15.9

17%

Asia-Pacific

42.1

41.5

0.6

9%

Latin America

9.7

25.6

(15.9)

2%

Total (excluding interregional flows)

445.7

339.6

106.1

100%

3.3.6Net income (Group share)

Coface Group’s effective tax rate rose from 23.2% in 2021 to 26.2% in 2022, an increase of 3.0 points.

Net income (Group share) amounted to €283.1 million, up 26.5% in relation to the year ended December 31, 2021 (€223.8 million).

This record level can be explained in part by the very atypical nature of the last three years, which have seen significant government involvement in the management of the economy.

(1)
This estimated solvency ratio is a preliminary calculation made according to Coface’s interpretation of Solvency II Regulations, using the Partial Internal Model. The final calculation may differ from this preliminary calculation. The estimated solvency ratio is not audited.
(2)
The proposed dividend is subject to the approval of the Annual General Shareholders’ Meeting of May 16, 2023.

3.4Group cash and capital resources

Information in this section is derived from the statement of cash flows in the consolidated financial statements and from Note 9 “Cash and cash equivalents” in the Company’s consolidated financial statements.

(in millions of euros)

As at Dec. 31

2022

2021

Net cash flows generated from operating activities

449.2

327.0

Net cash flows generated from investment activities

(124.4)

(207.9)

Net cash flows generated from financing activities

(142.7)

(134.4)

(in millions of euros)

As at Dec. 31

2022

2021

Cash and cash equivalents at beginning of period

362.4

401.0

Cash and cash equivalents at end of period

553.8

362.4

Net change in cash and cash equivalents

191.3

(38.5)

3.4.1 Coface Group debt and sources of financing

The Group’s debt comprises financial debt (financing liabilities) and operating debt linked to its factoring activities (composed of “Amounts due to banking sector companies” and “Debt securities”).

(in millions of euros)

As at Dec. 31

2022

2021

Subordinated borrowings

534.3

390.6

Sub-total financial debt

534.3

390.6

Amounts due to banking sector companies

743.2

822.9

Debt securities

1,794.9

1,498.8

Sub-total operating debt

2,538.1

2,321.7

Financial debt

For the year ended December 31, 2022, the Group’s financing liabilities, totalling €534.3 million, are comprised of two subordinated loans.

  • A fixed-rate issue (4.125%) of subordinated notes carried out by COFACE SA on March 27, 2014 for a nominal amount of €380 million, maturing on March 27, 2024.
  • The securities are irrevocably and unconditionally guaranteed on a subordinated basis by Compagnie française d’assurance pour le commerce extérieur, the Group’s main operating entity.
  • COFACE SA redeemed €153 million of the subordinated bonds issued in 2014 at a fixed price of 103.625% on September 21, 2022.
  • The nominal amount after this redemption stands at €227 million, still maturing on March 27, 2024.
  • A new fixed-rate issue (6.000%) of subordinated notes on September 22, 2022, for a nominal amount of €300 million, maturing on September 22, 2032.
Operating debt linked to the factoring business

The Group’s operating debt is mainly linked to financing for its factoring activities.

This debt, which includes the “Amounts due to banking sector companies” and “Debt securities” items, provides refinancing for the Group’s factoring companies (Coface Finanz in Germany and Coface Poland Factoring in Poland).

Amounts due to banking sector companies, which correspond to drawdowns on the bilateral credit lines (see “Bilateral credit lines” below) set up with various banking partners of Coface Finanz and Coface Poland Factoring and the Group’s local banks, amounted to €743.2 million for the financial year ended on December 31, 2022.

Debt securities amounted to €1,794.9 million for the financial year ended on December 31, 2022, including:

  • senior units issued by the VEGA securitisation fund under the Coface Finanz factoring receivables securitisation programme (see “Securitisation programme” below), in the amount of €1,180.5 million; and
  • commercial paper issued by COFACE SA (see “Commercial paper programme” below) to finance the activity of Coface Finanz in the amount of €614.3 million.
Coface Group’s main sources of operational financing

To date, the Coface Group’s main sources of operational financing are:

  • a securitisation programme to refinance its factoring receivables for a maximum amount of €1,200 million;
  • a commercial paper programme for a maximum amount of €700 million; and
  • bilateral credit lines for a maximum total amount of €1,676.6 million.

In 2022, the securitisation programme was increased to €1,200 million and renewed early in March; the senior one-year units were renewed in December. Coface Poland Factoring’s syndicated multi-currency loan was renewed early in the amount of €310 million. This loan has a two-year maturity with two options for a one-year extension, at the lenders’ discretion. In May, the option to extend the fourth year of the syndicated loan serving as a back-up to COFACE SA’s €700 million commercial paper programme was exercised.

At December 31, 2022, Coface Group’s debt linked to its factoring activities amounted to €2,538 million.

a)Securitisation programme

To refinance its factoring activities, in February 2012 the Group set up a securitisation programme for its factoring trade receivables, guaranteed by Compagnie française d’assurance pour le commerce extérieur. In March 2022, the securitisation programme was renewed early and its maximum amount was increased to €1,200 million. USD units were created (maximum amount equal to 25% of the total maximum amount of the transaction) following the inclusion of US clients and debtors in the transaction.

At December 31, 2022, €1,180.5 million had been used under this programme.

This securitisation programme includes a number of standard acceleration clauses associated with such a programme, concerning the financial position of Coface Finanz (the ceding company) and other Group entities (including certain indicators regarding the quality of the ceded receivables), and linked to the occurrence of various events, such as:

  • payment default of Coface Finanz or of Compagnie française d’assurance pour le commerce extérieur for any sum due under the securitisation fund;
  • the cross default of any Group entity pertaining to debt above €100 million;
  • closure of the asset-backed commercial paper market for a consecutive period of 180 days;
  • winding-up proceedings concerning Coface Finanz, Coface Poland Factoring, the Company or Compagnie française d’assurance pour le commerce extérieur;
  • the discontinuance of or substantial change to the activities practised by Coface Finanz or by Compagnie française d’assurance pour le commerce extérieur;
  • a downgrading of the financial rating of Compagnie française d’assurance pour le commerce extérieur to below BBB- for the main funding (maximum amount of €1,200 million) and to below A for additional funding (maximum amount of €100 million);
  • non-compliance with one of the covenants linked to the quality of the portfolio of ceded factoring receivables.

The securitisation programme does not contain a change of control clause for the Company, but contains restrictions regarding a change of control in Compagnie française d’assurance pour le commerce extérieur and the factoring companies resulting in their exit from the Group.

The three covenants set by the securitisation programme include:

Covenant

Definition

Trigger threshold

Default ratio

Three-month moving average of the rate of unpaid receivables beyond 60 days after their due date

> 2.24%

Delinquency ratio

Three-month moving average of the rate of unpaid receivables beyond 30 days after their due date

> 5.21%

Dilution ratio

Three-month moving average of the dilution ratio

> 9.71%

At December 31, 2022, the Group complied with all of these covenants.

b)Commercial paper programme

The Group has a €700 million commercial paper issuance programme under which the Company frequently issues securities with due dates ranging generally between one and six months. At December 31, 2022, securities issued under the commercial paper programme totalled €614.3 million. The programme was rated P-2 by Moody’s and F1 by Fitch.

Should the commercial paper market shut down, since July 28, 2017 the Group has had a currently unused syndicated loan covering the maximum amount of the commercial paper issue programme (€700 million since August 2021). The agreement regulating this syndicated loan contains the usual restrictive clauses (such as a negative pledge clause, prohibition from assigning the assets outside the Group above a specified threshold or restrictions related to the discontinuance or any substantial change in the Group’s business activities) and early repayment clauses (payment default, cross default, non-compliance with representations, warranties and commitments, significant adverse change affecting the Company and its capacity to meet its obligations under these bilateral credit lines, insolvency and winding-up proceedings), in line with market practices. This syndicated loan was renewed in August 2021 for three years with two possibilities for an extension of one year each. The first extension option was exercised in 2022.

c)Bilateral credit lines

To refinance its factoring business, the Group also set up a number of bilateral credit lines and overdraft facilities, mainly through its subsidiaries, for a total maximum amount of €1,676.6 million:

  • bilateral credit lines and overdraft facilities with local banks for a maximum of €592.7 million, of which €32.9 million had been drawn in Germany and €0.9 million in Poland at December 31, 2022
  • bilateral credit lines concluded with banks:
    • six lines for a maximum total amount of €425 million for Coface Finanz (with maturities ranging between one and three years), of which €314 million had been drawn down as of December 31, 2022,
    • five lines (including a syndicated loan) for a maximum total amount of €658.9 million for Coface Poland Factoring (with maturities ranging between one and three years), of which €394 million had been drawn down as of December 31, 2022

3.4.2Group solvency

The Group measures its financial strength based on the capital requirement (amount of equity required to cover its managed risks) according to the Solvency II Regulation for its insurance business and according to banking regulations for the Group’s financing companies. The change in capital requirement depends on numerous factors and parameters linked to changes in the loss ratio, underwriting volumes, risk volatility, the sequencing of loss settlement and the asset types invested in the Company’s balance sheet.

For insurance activities, pursuant to the Solvency II Regulation which became effective on January 1, 2016, the Group proceeded with the calculation of the solvency capital requirement (SCR) on December 31, 2022, using the partial internal model introduced by European Directive No. 2009/138/EC. The Group’s SCR evaluates the risks linked to pricing, underwriting, establishment of provisions, as well as market risks and operational risks. It takes account of frequency risks and major risks. This calculation is calibrated to cover the risk of loss corresponding to a 99.5% quantile at a one-year horizon. At December 31, 2022, the estimated capital required for the two Group businesses amounted to €1,199 million, compared with €1, 263 million at the end of 2021.

At December 31, 2022, the required capital for the factoring business was estimated at €223.2 million by applying a rate of 10.5% to the risk-weighted assets, or RWA. The Group has reported its capital requirements using the standard approach since December 31, 2019. It should be noted that the local regulators for Germany and Poland (the two countries in which the Group operates its factoring business) have not defined specific mandatory capital requirements for factoring companies.

The sum of the capital requirement for the insurance business and the capital requirement for the factoring business is compared with the estimated available capital, which totalled €2,404 million as of December 31, 2022.

At this date, the solvency ratio (ratio between the Group’s available capital and its capital requirement for insurance and factoring) was estimated at 201% (2), compared to 196% (2) at the end of 2021.

The table below presents the items for calculating the Group’s capital requirement:

(in millions of euros)

As at December 31, 2022

As at December 31, 2021

Total equity

1,962

2,141

- Goodwill and other intangible assets (net of deferred taxes)

(217)

(209)

+ Revaluation of provisions using the best estimate method (net of deferred tax assets)

424

554

+/- Other adjustments

(53)

(198)

- Dividend payments

(226)

(224)

+ Subordinated debt (valued at market value)

515

407

= Solvency II available own funds (A)

2,404

2,471

Capital requirement – Insurance (B)

976

1,055

Capital requirement – Factoring (C)

223

209

Capital requirement (D) = (B) + (C)

1,199

1,263

Solvency ratio (E) = (A)/(D)

201%

196%

COA2022_URD_EN_G019_HD.png

3.4.3Return on equity

The return on equity ratio is used to measure the return on the Group’s invested capital. Return on average tangible equity (or RoATE) is the ratio between net income (Group share) and average accounting equity (Group share) restated for intangible items (intangible asset values).

The table below presents the elements used to calculate the Group’s RoATE over the 2021-2022 period:

(in millions of euros)

As at Dec. 31

2022

2021

Accounting equity (Group share) – A

1,960

2,141

Intangible assets – B

239

230

Equity, net of intangible assets – C (A - B)

1,722

1,911

Average equity, net of intangible assets – D ([Cn + Cn-1]/2)

1,816

1,839

Net income (Group share) – E

283.1

223.8

RoATE – E/D

15.6%

12.2%

3.4.4Off-balance sheet commitments

Most of the Group’s off-balance sheet commitments concern certain credit lines, guarantees received (pledged securities received from reinsurers corresponding to deposits made by reinsurers under commitments binding them to the Coface Group) and transactions on financial markets.

The table below presents the details of the Group’s off-balance sheet commitments for the 2021-2022 period:

(in thousands of euros)

Dec. 31, 2022

Total

Related to financing

Related to activity

Commitments given

1,447,127

1,360,427

86,700

Endorsements and letters of credit

1,360,427

1,360,427


Property guarantees

3,500


3,500

Financial commitments in respect of equity interests

83,200


83,200

Commitments received

1,974,035

1,378,614

595,421

Endorsements and letters of credit

146,290


146,290

Guarantees

449,131


449,131

Credit lines linked to commercial paper

700,000

700,000


Credit lines linked to factoring

678,614

678,614


Financial commitments in respect of equity interests

0


0

Guarantees received

320,478


320,478

Securities lodged as collateral by reinsurers

320,478


320,478

Financial market transactions

105,965


105,965

(in thousands of euros)

Dec. 31, 2021

Total

Related to financing

Related to activity

Commitments given

1,137,652

1,126,000

11,651

Endorsements and letters of credit

1,126,000

1,126,000


Property guarantees

7,500


7,500

Financial commitments in respect of equity interests

4,151


4,151

Commitments received

1,397,644

853,084

544,561

Endorsements and letters of credit

141,291


141,291

Guarantees

403,270


403,270

Credit lines linked to commercial paper

700,000

700,000


Credit lines linked to factoring

153,084

153,084


Financial commitments in respect of equity interests

0


0

Guarantees received

323,314


323,314

Securities lodged as collateral by reinsurers

323,314


323,314

Financial market transactions

211,543


211,543

Endorsements and letters of credit totalling €1,360.427 million for the financial year ended December 31, 2022 correspond mainly to:

  • a joint surety bond for investors in COFACE SA’s subordinated bonds for €226.6 million (maturing in 10 years). Following the redemption of subordinated bonds on September 21, 2022 for €153.4 million, the initial joint surety bond of €380 million was adjusted by an amendment.
  • The new subordinated bond issued on September 22, 2022, for an amount of €300 million, was not the subject of a joint surety bond;
  • various joint surety bonds totalling €1,042 million given by the Group, in particular to banks financing the factoring business.

Collateral concerns Coface Re for €302.297 million and Compagnie française pour le commerce extérieur for €18.181 million.

The syndicated loan for a maximum amount of €700 million for the financial year ended December 31, 2022 includes coverage of the Group’s commercial paper issuance programme for €700 million (see Section 1.4.1 “Group debt and sources of financing”).

(1)
Solvency information is not audited.
(2)
This estimated solvency ratio is a preliminary calculation made according to Coface’s interpretation of Solvency II Regulations, using the Partial Internal Model. The result of the definitive calculation may differ from the preliminary calculation. The estimated solvency ratio is not audited.

3.5Post-closing events at December 31, 2022

3.5.1Acquisition of North America data analytics boutique Rel8ed

On January 30, 2023, Coface announced the acquisition of North American data analytics boutique Rel8ed. The acquisition brings new, rich data sets and analytics capabilities, which will benefit Coface trade credit insurance as well as the company’s business information customers and teams.

3.6Outlook

3.6.1Economic environment

In 2023, global economic growth is expected to slow to 1.9% from 2.9% in 2022. Emerging countries, with the exception of China, should be the main contributors to growth. The major advanced economies, excluding Japan and Australia, are expected to see their growth slow sharply to between -1% and +1%. This decline will be due in part to sluggish growth in Europe at the turn of 2022-2023, as well as in the United States starting in the second quarter of 2023.

The general context will continue to be dominated by the fallout from the war in Ukraine and, to a lesser extent, the impact of weather events. In economic terms, this will translate into price increases in food, energy, materials, industrial components and in certain services such as transport, restaurants and trade. In turn, inflation and the associated tightening of credit will continue to put pressure on global activity by weighing on demand (consumption, investment) and supply (industrial production and services).

Global inflation is expected to fall to 6% in 2023 after 8% in 2022. This decline will be largely due to a favourable base effect. Moreover, the inflation profile is not expected to be uniform over 2023, with – barring a marked fall in temperatures in Europe – a drop in the energy component until the summer. This phase will be followed by a recovery in the second half of the year, when China’s activity accelerates and its need for energy, particularly for liquefied natural gas, increases.

While Russian oil refused by Europe has been able to find alternative buyers in Asia (China and India in particular) thanks to the availability of oil ships, substitution should not be as easy for gas. Gas not being exported to Europe is in fact mainly located in the western part of Russia, the few pipelines to Asia are saturated, and few LNG tankers are accessible to Russia. The same problem could arise when the European embargo on refined petroleum products, particularly diesel, takes effect in February 2023.

For gas and diesel, Europe and China are likely to be in competition to buy the small quantities that are available. However, no significant additional production of these products is expected worldwide in 2023, at least not in sufficient quantities. The installation of floating storage and regasification units along northern European coasts will only enable the replacement of gas transported by pipeline with liquefied natural gas. A cessation of hostilities in Ukraine would not change the situation on the energy (and metals) market, as Europe could refuse to lift its sanctions or resume its purchases of products from Russia.

However, it could further ease pressure on agricultural markets and fertilizers by facilitating their production in Ukraine and their transport through the Black Sea. The availability of agricultural products will, however, continue to depend on weather conditions, which appear to be more favourable in terms of rainfall in the major producing regions. Finally, restricted by worsening public finances, governments could gradually reduce measures to protect consumers and businesses from price rises, thereby fuelling inflation. Similarly, low unemployment in advanced regions will encourage wage growth, sustaining inflationary dynamics yet failing to safeguard purchasing power.

This relatively more favourable inflationary dynamic should allow advanced economies’ central banks to curb their monetary tightening, or even stop raising interest rates. They can rightly consider that the return to previous levels of inflation would be too costly in social terms, since inflation has spread beyond the products first affected and has grown increasingly opaque, and due to the unavoidable rise in costs resulting from the securisation of supply chains. However, this easing in monetary policy will not prevent the 2022 rate hikes from impacting activity, given the 6-9 month lag generally observed in economies with developed financial systems.

It could have a significant impact on housing and office construction. Markets where housing prices have risen sharply, while household debt is high and home loan interest rates variable, such as North America, Northern Europe and Australia, are the most exposed. Office construction is likely to suffer the effects of widespread remote working. Emerging economies are also likely to ease their monetary policy, especially as they began to tighten policy before the advanced economies. In addition to the reasons already given, it should be added that the dollar’s rise (and the concomitant depreciation of emerging currencies), which is probably a more pressing concern for these countries than inflation, seems to have ended.

After the shock of the pandemic, higher energy prices and rising interest rates, many governments’ public and external debt is also likely to attract attention. In addition to those that have already defaulted, such as Sri Lanka and Ghana, and/or benefited from debt restructuring, a few countries (especially in Africa, Asia and America), facing rising food and energy bills, may encounter difficulties in servicing their debt. Fortunately, the injection of funds by their foreign partners and multilateral funded programmes will reduce the risk of default.

It will be important to distinguish between winners and losers from the new global economic conditions. In an environment of high commodity prices, it is important to differentiate between net exporters and importers of energy, minerals, metals and agricultural products. Some countries enjoy near-energy and/or agricultural independence, which protects them in part from the rise in global prices. Others will start or ramp up their production of raw materials. This will be the case for hydrocarbons and for the essential elements of renewable energies: the mining of the minerals needed for batteries (lithium, cobalt, nickel, manganese, etc.), the production of solar, wind and hydraulic energy, as well as green hydrogen. For these countries, it will be an opportunity to attract strong domestic or foreign investment.

Countries that rely on tourism should benefit as international tourism returns to normal as already observed in some countries. Finally, the disruption in supply chains during the Covid crisis and the desire to decrease dependency on China may be an opportunity for some countries (Turkey, Mexico, North Africa, Eastern Europe, South and South-East Asia) to gain new business.

The Chinese growth profile will have an impact on global inflation through its imports of energy and minerals, and on growth in many commodities-exporting countries as well as those that export capital goods and high-tech products. It is likely that China will manage to curb the Covid wave in the second half of the year and that its growth will then accelerate. Indeed, the worst affected are mostly older people, which allows others to ensure production and spend.

The authorities have opted to lift most restrictions on movement, which was not the case in Western countries. Activity is also expected to be boosted by the accommodative economic policy adopted in autumn 2022. The real estate sector, which accounts for a huge part of the economy, could nevertheless remain a burden. Indeed, even if the authorities have bailed out major developers, the very strict rules (“red lines”) adopted in December 2021 will continue to apply. Construction, for its part, should continue to benefit from public sector orders for social housing and infrastructure.

Apart from China, the G20 economies are split between those from the Asia-Pacific region, which will be resilient, and the rest, which will decline, although all but four (Italy, France, India and Japan) should see a fall in inflation. Moreover, the performances of economies exporting goods or services (including tourism) to China are still dependent on the country.

  • South Korea (2.0% growth expected in 2023 after 2.6% in 2022), Japan (1.5% after 1.1%), India (5.9% after 6.8%) and Indonesia (5.1% after 5.3%) will benefit from domestic demand being supported by the authorities and from a post-Covid catch-up, while their exports will weaken.
  • Australia (2.2% after 3.4%) will continue to profit from its coal and gas, while wage increases linked to labour market tensions will mitigate the impact of the credit crunch on consumption and housing.
  • Saudi Arabia (4.0% after 7.0%) will benefit from its oil and a generous budget.
  • Turkey (3.5% after 5.5%) will benefit from a strong performance in tourism, but will have to face a domestic demand dragged down by inflation and external demand impacted by the slowdown in Europe.
  • South Africa (1.4% after 2.1%) will continue to suffer from electrical blackouts and tighter credit.
  • Mexico (1.0% after 2.6%) will see domestic demand suffer from the cost of credit, but will be buoyed by an increase in public spending.
  • Brazil (0.7% after 2.9%) will see increased social and infrastructure spending hit by rising rates, while excellent harvests will offset the decline in prices.
  • In Argentina (-0.5% after 5.1%), soaring inflation, fiscal tightening, capital and import controls and drought will lead the economy into recession.
  • In Germany (-0.2% after 1.8%), government support for businesses and consumers will marginally mitigate sluggish exports and consumption owing to inflation.
  • France (0.3% after 2.5%) will see consumer spending undermined by inflation.
  • While Italy (-0.6% after 3.4%) will also suffer from Germany’s poor form.
  • Spain (1.0% after 4.7%) will be able to rely on its energy independence and tourism to alleviate weak consumer spending.
  • In the United Kingdom (-1.0% after 4.4%), consumption, investment and construction will remain under pressure.
  • In the United States (0.8% after 1.9%), the rise in interest rates is finally expected to have an impact on employment and wages, while the savings built up during the Covid crisis will run out. Contrary to public sector construction, housing construction will continue to suffer. Negative growth is possible in Q2/Q3.
  • Finally, in Canada (1.1% after 3.5%), investment in energy will only marginally offset the impact of the slowdown in the United States.

3.6.2Outlook for the Coface Group

The end of 2022 showed that the worst-case scenario is never assured. Some of the political and economic risks that were weighing on the global economy fared better than expected, with, for example the reopening of the Chinese economy and reduced pressure on energy markets owing to exceptionally high temperatures in Europe.

These temperatures remind us of the need to reduce our CO2 emissions. As a responsible company, Coface has set its roadmap through to 2050 with five-year goals for reducing its emissions.

However, in the medium term, the level of public debt and its sharp increase over the past three years leave governments little leeway to take massive action in the economy. The financing of the energy transition and the rebuilding of previously overlooked defence forces will account for a large portion of spending, limiting the ability to react in the event of a new external shock.

Lastly, interest rates and energy prices will remain higher than in the recent past for some time, impacting the margins and financial strength of many businesses.

The current easing in inflation should slow the pace of growth in premiums for Coface, as these are mostly indexed to its policyholders’ turnover.

Coface continues to expect a further normalisation in the risk environment and has prepared accordingly.

(1)
Group estimates.

3.7Key financial performance indicators

3.7.1Financial indicators

Consolidated turnover

The composition of the Group’s consolidated turnover (premiums, other revenue) is described under “Accounting principles and methods” in the notes to the consolidated financial statements.

Claims expenses

“Claims expenses” correspond to claims paid under credit insurance contracts, Single Risk policies and surety bonds, less changes in recoveries following recourse (amounts recovered from the debtor after paying the policyholder for the claim) during the financial year, and to the change in claims provisions during the financial year, and the handling expenses for these claims, which cover the costs of processing and managing policyholders’ claims declarations, and those generated by monitoring recovery procedures (charges and provisions for internal and external debt collection fees).

Claims paid correspond to compensation paid under the policies during the financial year, net of collections received, plus costs incurred to ensure their management, regardless of the financial year during which the claim was declared or during which the event producing the claim took place, less amounts recovered during the financial year for claims previously indemnified, regardless of the year the indemnification was paid.

Claims provisions are established for claims reported but not yet settled at financial year end, as well as for claims that have not yet been reported, but which have been deemed probable by the Group, given the events that have arisen during the financial year (incurred but not reported (IBNR) provisions). The amounts thus provisioned also take into consideration a forecast of the amount to be collected for these claims. These provisions are decreased each year by reversals made following the payment of compensation or the estimate of potential losses for reported or potential claims. The difference between the amount of provisions in a given financial year (established during the first year of underwriting a policy) and the amounts revalued the following years is either a liquidation profit (revaluation downward) or loss (upwards revaluation) (see Note 23 to the consolidated financial statements).

Operating expenses

“Operating expenses” correspond to the sum of the following items:

  • “Contract acquisition costs”, consisting of:
    • external acquisition costs, namely commissions paid to business contributors (brokers or other intermediaries) and which are based on the turnover contributed by such intermediaries,
    • and internal acquisition costs, which are essentially fixed costs related to payroll expenses for contract acquisition and the costs of the Group’s sales network;
  • “Administration costs” (including Group operating costs, payroll costs, IT costs, etc., excluding employee profit sharing and incentive schemes). Contract acquisition costs as well as administration costs primarily include costs linked to the credit insurance business. However, due to pooling, costs related to the Group’s other businesses are also included in these items;
  • “Other current operating expenses” (expenses that cannot be allocated to any of the functions defined by the chart of accounts, including in particular general management expenses);
  • “Expenses from banking activities” (general operating expenses, such as payroll costs, IT costs, etc. relating to factoring activities); and
  • “Expenses from other activities” (overheads related exclusively to information and debt collection for customers without credit insurance).

As such, “Operating expenses” consist of all overheads, with the exception of internal investment management expenses for insurance – which are recognised in the “Investment income, net of management expenses (excluding financing costs)” aggregate – and claims handling expenses, with the latter included in the “Claims expenses” aggregate.

Total internal overheads (i.e. overheads excluding external acquisition costs (commissions)), are analysed by function, regardless of the accounting method applied to them, in all of the Group’s countries. This presentation enables a better understanding of the Group’s savings and differs on certain points from the presentation of the income statement, which meets the presentation requirements of the accounting standards.

Cost of risk

“Cost of risk” corresponds to expenses and provisions linked to covering the ceding company risk (inherent to the factoring business) and credit risk, net of credit insurance coverage.

Underwriting income

Underwriting income is an intermediate balance of the income statement which reflects the operational performance of the Group’s activities, excluding the management of business investments. It is calculated before and after recognition of the income or loss from ceded reinsurance:

  • “Underwriting income before reinsurance” (or underwriting income gross of reinsurance) corresponds to the balance between consolidated turnover and the total sum of claims expenses, operating expenses and cost of risk;
  • “Underwriting income after reinsurance” (or underwriting income net of reinsurance) includes, in addition to the underwriting income before reinsurance, the income or loss from ceded reinsurance, as defined below.
Income (loss) from ceded reinsurance (expenses or income net of ceded reinsurance)

“Reinsurance income” (or income and expenses net of ceded reinsurance) corresponds to the sum of income from ceded reinsurance (claims ceded to reinsurers during the financial year under the Group’s reinsurance treaties, net of the change in the provision for claims net of recoveries that was also ceded, plus the reinsurance commissions paid by reinsurers to the Group for proportional reinsurance), and charges from ceded reinsurance (premiums ceded to reinsurers during the financial year for the Group’s reinsurance treaties, net of the change in provisions for premiums also ceded to reinsurers).

Investment income, net of management expenses (excluding financing costs)

“Investment income, net of management expenses (excluding financing costs)” combines the result of the Group’s investment portfolio (investment income, net gains on disposals and addition to/reversals of provisions for impairment), exchange rate differences and investment management expenses.

Operating income

“Current operating income (loss)” corresponds to the sum of “Underwriting income after reinsurance”, “Net investment income excluding financing costs” and non-current items, namely “Other operating income and expenses”.

In the presentation of operating income by region, the amounts are represented before turnover from interregional flows and holding costs not charged back to the regions have been eliminated.

Income tax

Tax expenses include tax payable and deferred tax that results from consolidation restatements and temporary tax differences, insofar as the tax position of the companies concerned so justifies (as more extensively described under “Accounting principles and methods” and in Note 29 to the consolidated financial statements).

Net income (Group share)

Net income (Group share) corresponds to the amount of “Net income from continuing operations” (corresponding to “Operating income”, net of “Financing costs”, “Share in net income of associates” and “Income tax”), “Net income from discontinued operations” and “Non-controlling interests”.

3.7.2Operating indicators

As part of its business operations, in addition to the financial aggregates published in accordance with the International Financial Reporting Standards (IFRS), the Group uses four operational indicators to track its commercial performance. They are described below:

Production of new contracts

The production of new contracts corresponds to the annual value of credit insurance policies taken out by new customers during the period. The Group generally records a higher production of new contracts during the first quarter of a given financial year.

Retention rate

The retention rate corresponds to the ratio between the annual value of the policies actually renewed and that of the policies that were due to be renewed at the end of the preceding period. The annual value of the policies corresponds to the value of the credit insurance policies over a 12-month period according to an estimate of the volume of related sales and the level of the rate conditions in effect at the time the policy is taken out.

Price effect of credit insurance policies

The price effect of the credit insurance policies corresponds to the difference between the annual value of the policies, calculated based on the tariffs in effect at the time the policy is taken out, and the annual value of the policies for the preceding period (calculated based on the rate conditions of the preceding period and excluding any volume effect related to policyholders’ actual revenue).

Volume effect

The method for calculating premiums on the Group’s turnover produces its effects throughout the life of the policies, and not for a single financial year. When the volume of a policyholder’s actual sales is higher than what was taken into consideration to determine the amount of premiums billed during the period covered by the policy, this difference produces a positive effect on the earned premiums recorded by the Group with a one-year lag. Conversely, when the volume of the policyholder’s sales is less than what was used as the basis for calculating the flat rate, this difference does not produce any effect on the Group’s turnover for the following financial year.

3.7.3Breakdown of the calculation of ratios as of December 31, 2022

Earned Premiums

(in thousands of euros)

FY-2022

FY-2021

Gross earned premiums [A]

1,527,464

1,312,637

Ceded premiums

(410,339)

(512,098)

Net earned premiums [D]

1,117,125

800,539


Claims expenses

(in thousands of euros)

FY-2022

FY-2021

Claims expenses [B]

(476,779)

(280,456)

Ceded claims

81,935

119,395

Change in claims provisions

(7,819)

(105,272)

Net claims expenses [E]

(402,663)

(266,333)


Technical expenses

(in thousands of euros)

FY-2022

FY-2021

Operating expenses

(806,361)

(699,327)

Employee profit sharing and incentive plans

10,120

9,898

Other revenue

284,506

255,221

Operating expenses, net of revenues from other services before reinsurance [C]

(511,734)

(434,208)

Commissions received from reinsurers

189,613

183,686

Operating expenses, net of revenues from other services after reinsurance [F]

(322,121)

(250,522)

Gross comined ratio = gross loss ratio

CH03_COA2020_Ratios_B-A_HD.png

+ gross cost ratio

CH03_COA2020_Ratios_C-A_HD.png

Net combined ratio = net loss ratio

CH03_COA2020_Ratios_E-D_HD.png

+ net cost ratio

CH03_COA2020_Ratios_F-D_HD.png

Ratios

FY-2022

FY-2021

Loss ratio before reinsurance

31.2%

21.4%

Loss ratio after reinsurance

36.0%

33.3%

Cost ratio before reinsurance

33.5%

33.1%

Cost ratio after reinsurance

28.8%

31.3%

Combined ratio before reinsurance

64.7%

54.4%

Combined ratio after reinsurance

64.9%

64.6%

3.7.4Alternative performance measures (APM)

This section takes a look at KPIs not defined by accounting standards but used by the Company for its financial communications.

This section is a follow-up to the AMF’s position – IAP DOC 2015-12.

The indicators below represent indicators listed as belonging to the category of Alternative Performance Measures.

a)Alternative performance measures related to turnover and its constituent items

Definition


Explanation

Reconciliation with the financial statements

N/N-1 comparison – €m

2022

2021

Turnover with restated items


[1] Two types of restatements on turnover:

i. Calculation of turnover growth percentages, like-for-like:

  • Year N recalculated at the exchange rate of year N-1;
  • Year N-1 at the Group structure of year N

i. Historic method used by Coface to calculate pro forma %.

i. (Current turnover N - FX Impact N-1)/(Current turnover N-1 + Perimeter impact N) -1

i. +13.4%

= (1,812.0 - 28.3)/(1,567.9 +5.3 scope impact) -1

i. +8.3%

= (1,567.9 +14.0)/(1,450.9 +9.5 scope impact) -1

ii. Removal or addition of turnover in value (€) considered as extraordinary in the current year.

The term “extraordinary” refers to impacts on turnover which do not occur every year.

ii. Item considered as extraordinary, i.e. which will only occur in the current financial year (year N).

ii. Current turnover N +/- Restatements/Additions of extraordinary items N

ii. 1,812.0 +/ .0

ii. 1,567.9 +/-0.0

Fee and commission income/Gross earned premiums – (current – like-for-like)


Weight of fee and commission income over earned premiums on like-for-like basis:

  • Year N at the exchange rate of year N-1
  • Year N-1 at the Group structure of year N

Fee and commission income corresponds to the turnover invoiced on additional services.

Indicator used to monitor changes in fee and commission income compared with the main turnover item at constant scope.

Fee and commission income/Earned premiums – Like-for-like

Current:

10.4%

= 158.6/1,527.5

Like-for-like: 10.5%

= 157.6/1,501.1

Current:

10.7%

= 140.8/1,312.6

Like-for-like: 10.6%

= 141.2/1,326.3

Internal overheads excluding extraordinary items


[2] Restatement or Addition of items considered as extraordinary with respect to internal overheads. The term “extraordinary” refers to impacts on expenses which do not occur every year.

Indicator used to compare changes in internal overheads by excluding extraordinary items.

Current internal overheads +/- Restatements +/- Additions of extraordinary items

€649.4m

= 649.4

+/-0.0

€572.7m

= 572.7

+/-0.0

b)Alternative performance measures related to operating income

Definition

Explanation

Reconciliation with 
the financial statements

N/N-1 comparison – €m

2022

2021

Operating income excluding restated extraordinary items (including financing costs and excluding other operating income and expenses)

Restatement or Addition of items considered as extraordinary to operating income: these include extraordinary income and expenses impacting either turnover (see definition above, [1]) or overheads (see definition above [2]).

Indicator used to compare changes in operating income by excluding extraordinary items.

Operating income +/- Financing expenses +/- Addition of extraordinary items

€393.0m

= 413.5 + (-29.6) - (-9.1 Non-recurring items)

€294.6m

= 312.9 + (-21.5) - (-3.2 Non-recurring items)

c)Alternative performance measures related to net income

Definition


Explanation

Reconciliation with 
the financial statements

N/N-1 comparison – €m

2022

2021

Net income excluding extraordinary items


Restatement or Addition of items considered as extraordinary with respect to net income.

This includes extraordinary income and expenses likely to impact either turnover (see definition above [1]) or overheads (see definition above [2]).

This aggregate is also restated for “current operating income and expenses”, which are recorded after operating income in the management income statement.

Indicator used to compare changes in net income by excluding extraordinary items.

Current operating income +/- Restatements +/- Additions of extraordinary items net of tax

Not applicable for this reporting date

Not applicable for this reporting date

d)Alternative performance measures related to the combined ratio

Definition

Explanation

Reconciliation with 
the financial statements

N/N-1 comparison – €m

2022

2021

Loss ratio gross of reinsurance (loss ratio before reinsurance) and gross loss ratio with claims handling expenses refer to the same indicator

Ratio of claims expenses to gross earned premiums (the sum of gross earned premiums and unearned premium provisions), net of premium refunds.

Indicator for monitoring the level of loss borne by the Group with respect to premiums, after ceded reinsurance.

- Claims expenses/Gross earned premiums

See 4.3 Appendix – Breakdown of the calculation of ratios at December 31

Loss ratio net of reinsurance (loss ratio after reinsurance)


Ratio between claims expenses net of claims expenses ceded to reinsurers under reinsurance treaties entered into by the Group, and total earned premiums net of premiums ceded to reinsurers.

Indicator for monitoring the level of loss borne by the Group with respect to premiums, after ceded reinsurance.

- (Claims expenses + Ceded claims + Change in provisions on claims net of recourse)/(Gross earned premiums + Expenses from ceded reinsurance)

See 4.3 Appendix – Breakdown of the calculation of ratios at December 31

Cost ratio before reinsurance


Ratio between operating expenses (net of employee profit sharing) less other income* and earned premiums.

Indicator for monitoring the level of operating expenses (insurance contracts portfolio acquisition and management) borne by the Group with respect to premiums.

- (Operating expenses – Employee profit sharing – Other income)/Gross earned premiums

See 4.3 Appendix – Breakdown of the calculation of ratios at December 31

Cost ratio after reinsurance


Ratio between operating expenses (net of employee profit sharing) less other income* net of commissions received from reinsurers under reinsurance treaties entered into by the Group, and the total of earned premiums net of premiums ceded to reinsurers.

Indicator for monitoring the level of operating expenses (insurance contracts portfolio acquisition and management) borne by the Group with respect to premiums after ceded reinsurance.

- (Operating expenses – Employee profit sharing – Other income – Commissions received from reinsurers)/(Gross earned premiums + Expenses from ceded reinsurance)

See 4.3 Appendix – Breakdown of the calculation of ratios at December 31

Combined ratio before/after reinsurance


The combined ratio is the sum of the loss ratios (before/after reinsurance) and cost ratios (before/after reinsurance) as defined above.

Overall profitability indicator of the Group’s activities and of its technical margin before and after ceded reinsurance.

Loss ratio (before/after reinsurance) + Cost ratio (before/after reinsurance)

See 4.3 Appendix – Breakdown of the calculation of ratios at December 31

Net combined ratio excluding restated and extraordinary items [A]


Restatement or Addition of items considered as extraordinary with respect to combined ratio after reinsurance. This includes extraordinary income and expenses impacting either turnover (see definition above, [1]) or overheads (see definition above [2]).

Indicator used to compare changes in combined ratios after reinsurance by excluding extraordinary items.

Combined ratio after reinsurance +/- Restatements +/- Additions of extraordinary items

Not applicable for this reporting date

[A] = [B] + [C]

54.5%

= 23.2% + 31.3%

Loss ratio excluding extraordinary items [B]


Restatement or Addition of items considered as extraordinary with respect to loss ratio net of reinsurance.

Indicator used to compare changes in loss ratios after reinsurance by excluding extraordinary items.

Loss ratio after reinsurance +/- Restatements/Additions of extraordinary items

Not applicable for this reporting date

23.2%

= 33.3% - 10.1 pts

Net cost ratio excluding restated and extraordinary items [C]


Restatement or Addition of items considered as extraordinary to cost ratio after reinsurance: these include extraordinary income and expenses impacting either turnover (see definition above, [1]) or overheads (see definition above [2]).

Indicator used to compare changes in cost ratios after reinsurance by excluding extraordinary items.

Cost ratio after reinsurance +/- Restatements/Additions of extraordinary items

Not applicable for this reporting date

23.2%

= 33.3% - 10.1 pts

Current year gross loss ratio - before reinsurance excluding claims handling expenses [D]


Ultimate claims expense (after recoveries) over earned premiums (after premium refunds) for the current year. The insurance period is exclusively the current year N.

Indicator used to calculate the loss ratio before reinsurance excluding claims handling expenses.

Claims for the current year/Earned premiums for the current year

see ultimate loss ratios development triangle

80.2%

66.3%

Prior year gross loss ratio - before reinsurance excluding claims handling expenses [E]


Corresponds to gains/losses for insurance periods prior to current year N excluded. A gain or loss corresponds to an excess or deficit of claims provisions compared with the loss ratio actually recorded.

Indicator used to calculate the loss ratio before reinsurance excluding claims handling expenses.

[E] = [F-D]

-51.6%

= 28.6% - 80.2%

-47.7%

= 18.6% - 66.3%

Comprehensive gross loss ratio - before reinsurance excluding claims handling expenses [F]


Corresponds to the accounting loss ratio for all insurance periods (current year N and its prior years). This concerns the loss ratio before reinsurance excluding claims handling expenses.

Key indicator in loss monitoring.

- (Claims paid net of recourse + Change in claims provisions)/Earned premiums

28.2%

= - (-436.9/1,527.5)

18.6%

= - (-244.3/1,312.6)

*    Operating expenses include overheads linked to the execution of additional services (business information and debt collection) inherent to the credit insurance business. These also include overheads for service businesses carried out by the Group, such as factoring.

      In order for the cost ratio calculated by the Group to be comparable to the cost ratio calculated by other main market players, “Other revenue”, namely the revenue generated by the additional businesses (non-insurance), is deducted from overheads.

e)Alternative performance measures related to equity

Definition


Explanation

Reconciliation with 
the financial statements

N/N-1 comparison – €m

2022

2021

RoATE – Return on average tangible equity

Net income (Group share) over average tangible equity (average equity (Group share) for the period restated for intangible assets)

The RoATE is used to measure the return on the Coface Group’s invested capital.

Net income (Group share) for year N/[(Equity (Group share) N-1, restated for intangible assets N-1 + Equity (Group share) restated for intangible assets N)/2]

15.6%

= 283.1/[(1,911 +1,721)/2]

12.2%

= 223.8/[(1,767 +1,911)/2]

RoATE excluding non-recurring extraordinary items

The calculation of RoATE (see definition of RoATE above) is based on net income excluding extraordinary items and average tangible equity (see RoATE definition above) excluding extraordinary items. For this calculation, interest or commissions linked to capital management instruments (such as hybrid debt, contingent capital) are not considered as extraordinary items.

RoATE excluding extraordinary items is used to monitor the Group’s profitability between two reporting periods.

Net income (Group share) for year N excluding extraordinary items/[Equity (Group share) excluding extraordinary items N-1, restated for intangible assets N-1 + Equity (Group share) excluding extraordinary items N restated for intangible assets N)/2]

Not applicable for this reporting date

Not applicable for this reporting date

f)Alternative performance measures related to the investment portfolio

Definition


Explanation

Reconciliation with 
the financial statements

N/N-1 comparison – €m

2022

2021

Accounting rate of return of financial assets

Investment income after income from equity and interest rate derivatives and before income from equity securities, currencies and currency derivatives and financial expenses divided by the balance sheet total of financial assets excluding equity securities.

Indicator used to monitor the accounting performance of the financial assets portfolio.

Investment portfolio income/((market value of financial assets (shares excluding equity securities, real estate, fixed income instruments) year N + market value of financial assets (shares excluding equity securities, real estate, fixed income instruments) year N-1)/2)

2.1%

= 62.3/(((3,022 - 85) + (3,220 - 152))/2)

1.2%

= 36.7/(((3,220 - 152) + (2,984 - 150))/2)

Accounting rate of return of financial assets excluding income from disposals

Investment income before net gains on disposals, impairment and reversals, income from equity and interest rate derivatives, equity securities, currencies, currency derivatives and financial expenses, divided by the balance sheet total of financial assets excluding equity securities.

Indicator used to monitor the recurring accounting performance of the financial assets portfolio.

Investment portfolio income excluding net gains on disposals/((market value of financial assets (shares excluding equity securities, real estate, fixed income instruments) year N + market value of financial assets (shares excluding equity securities, real estate, fixed income instruments) year N-1)/2)

1.5%

= (62.3 - 17.7)/(((3,022 - 85) + (3,220 - 152))/2)

1.1%

= (36.7 - 3.6)/(((3,220 - 152) + (2,984 - 150))/2)

Economic rate of return of financial assets

Economic performance of the asset portfolio. Thus, the change in revaluation reserves for the year over the balance sheet total of financial assets is added to the accounting rate of return.

Indicator used to monitor the economic performance of the financial assets portfolio.

Accounting rate of return on financial assets + (revaluation reserves of financial assets (shares excluding equity securities, real estate, fixed income instruments) year N - revaluation reserves of financial assets (shares excluding equity securities, real estate, fixed income instruments) year N-1)/((market value of financial assets (shares excluding equity securities, real estate, fixed income instruments) year N + market value of financial assets (shares excluding equity securities, real estate, fixed income instruments) year N-1)/2)

-6.5%

= (62.3 + -151.5 -106.0)/(((3,022 - 85) + (3,220 - 152))/2)

1.6%

= (36.7 + 106.0 - 96.2)/(((3,220 - 152) + (2,984 - 150))/2)

Investment portfolio income


Investment portfolio income (shares/fixed income instruments and real estate).

Used to monitor income from the investment portfolio only.

Income from shares excluding equity securities + income from fixed income instruments + real estate income + income from equity and interest rate derivatives

€62.3m

= 34.6 + -6.4 +25.1 +9.1

€36.7m

= 4.0 + 23.2 +14.0 -4.5

Other


Income from derivatives excluding currency derivatives, income from equity securities and investment fees

Used to monitor income from equity securities, derivatives excluding currency derivatives and fees relating to investments

Income from derivatives excluding currencies + income from equity securities + investment fees

-€22.1m

= -15.8 +2.7 + -9.0

€5.5m

= 7.0 +6.2 -7.8

g)Alternative performance measures linked to reinsurance

Definition

Explanation

Reconciliation with 
the financial statements

N/N-1 comparison – €m

2022

2021

Ceded premiums/Gross earned premiums (rate of ceded premiums)

Weight of ceded premiums compared with earned premiums. Ceded premiums correspond to the share of earned premiums that Coface cedes to its reinsurers under reinsurance treaties signed with them. Earned premiums correspond to the sum of written premiums and provisions on earned premiums not yet written.

Indicator used to monitor changes in reinsurance income.

- (Ceded premiums (including change in premiums provisions)/Earned premiums)

26.9%

= - (-410.3/1,527.5)

39.0%

= - (-512.1/1,312.6)

Ceded claims/Total claims (rate of ceded claims)

Weight of ceded claims compared with total claims. Ceded claims correspond to the share of claims that Coface cedes to its reinsurers under reinsurance treaties signed with them.

Indicator used to monitor changes in reinsurance income.

- Ceded claims (including change in claims provisions after recourse)/Total claims (including claims handling expenses)

15.5%

= -74.1/[(-436.9) + (-39.9)]

5.0%

= -14.1/[(-244.3) + (-36.2)]

Underwriting income before/after reinsurance (underwriting income gross/net of reinsurance)

See definition above (Financial indicators)

Underwriting income before and after reinsurance is now reported directly in the income statement following changes in its presentation.

3.8Investments outside the investment portfolio

Information can be found in Note 6 “building used in the business and other property, plant and equipment” of the Group’s consolidated financial statements.

CONSOLIDATED BALANCE SHEET 
& INCOME STATEMENT

SIGNIFICANT EVENTS  
& SCOPE OF CONSOLIDATION

notes AND APPENDICES 
CONSOLIDATED AND
PARENT COMPANY FINANCIAL STATEMENTS

(1)
Group estimates.
(2)
According to UNCTAD (estimate at November 30, 2022)
(3)
According to the WTO (estimates in November and December 2022).
(4)
Source: FMI for 2021, Coface estimates and forecasts for 2022 and 2023
(5)
This estimated solvency ratio is a preliminary calculation made according to Coface’s interpretation of Solvency II Regulations, using the Partial Internal Model. The final calculation may differ from this preliminary calculation. The estimated solvency ratio is not audited.
(6)
The proposed dividend is subject to the approval of the Annual General Shareholders’ Meeting of May 16, 2023.
(7)
Solvency information is not audited.
(8)
This estimated solvency ratio is a preliminary calculation made according to Coface’s interpretation of Solvency II Regulations, using the Partial Internal Model. The result of the definitive calculation may differ from the preliminary calculation. The estimated solvency ratio is not audited.
(9)
Group estimates.

4. FINANCIAL ITEMS

4.1Consolidated financial statements

4.1.1Consolidated balance sheet

Asset

(in thousands of euros)

Notes

Dec. 31, 2022

Dec. 31, 2021

Intangible assets


238,835

229,951

Goodwill

1

155,960

155,529

Other intangible assets

2

82,876

74,423

Insurance business investments

3

3,021,805

3,219,430

Investment property

3

288

288

Held-to-maturity securities

3

1,842

1,833

Available-for-sale securities

3

2,902,405

3,115,154

Trading securities

3

26

15

Derivatives

3

10,330

10,458

Loans and receivables

3

106,914

91,683

Receivables arising from banking activities

4

2,906,639

2,690,125

Reinsurers’ share of insurance liabilities

17

508,881

512,187

Other assets


1,220,666

1,024,871

Buildings used for operations purposes and other property, plant and equipment

6

94,613

105,809

Deferred acquisition costs

8

46,427

38,900

Deferred tax assets

19

88,755

58,345

Receivables arising from insurance and reinsurance operations

7

664,460

511,038

Trade receivables arising from service activities

8

50,062

59,489

Current tax receivables

8

66,612

75,682

Other receivables

8

209,736

175,609

Cash and cash equivalents

9

553,786

362,441

Total assets


8,450,613

8,039,006

Liability

(in thousands of euros)

Notes

Dec. 31, 2022

Dec. 31, 2021

Equity attributable to owners of the parent


1,960,465

2,141,041

Share capital

10

300,360

300,360

Additional paid-in capital


723,501

810,420

Retained earnings


742,270

644,807

Other comprehensive income


(88,773)

161,638

Consolidated net income of the year


283,107

223,817

Non-controlling interests


1,746

309

Total equity


1,962,211

2,141,351

Provisions for liabilities and charges

13

68,662

85,748

Financing liabilities

15

534,280

390,553

Lease liabilities

16

74,622

81,930

Liabilities relating to insurance contracts

17

2,056,267

1,859,059

Payables arising from banking activities

18

2,927,389

2,698,525

Amounts due to banking sector companies

18

743,230

822,962

Amounts due to customers of banking sector companies

18

389,300

376,788

Debt securities

18

1,794,858

1,498,775

Other liabilities


827,180

781,841

Deferred tax liabilities

19

105,142

120,326

Payables arising from insurance and reinsurance operations

20

318,810

286,583

Current taxes payables

21

61,681

80,712

Derivatives

21

222

3,480

Other payables

21

341,326

290,739

Total equity and liabilities

21

8,450,613

8,039,006

4.1.2Consolidated income statement

(in thousands of euros)

Notes

Dec. 31, 2022

Dec. 31, 2021

Gross written premiums


1,698,270

1,462,424

Premium refunds


(142,109)

(121,336)

Net change in unearned premium provisions


(28,697)

(28,451)

Earned premiums

22

1,527,464

1,312,637

Fee and commission income


158,582

140,691

Net income from banking activities


70,414

64,400

Income from services activities


55,510

50,130

Other revenue

22

284,506

255,221

Revenue


1,811,970

1,567,858

Claims expenses

23

(476,779)

(280,456)

Policy acquisition costs

24

(304,747)

(259,317)

Administrative costs

24

(314,460)

(270,990)

Other insurance activity expenses

24

(69,824)

(66,243)

Expenses from banking activities, excluding cost of risk

24/25

(14,331)

(13,103)

Expenses from services activities

24

(102,998)

(89,674)

Operating expenses

24

(806,361)

(699,327)

Risk cost

25

308

76

Underwriting income before reinsurance


529,138

588,150

Income and expenses from ceded reinsurance

26

(146,610)

(314,288)

Underwriting income after reinsurance


382,529

273,862

Investment income, net of management expenses (excluding finance costs)

27

40,105

42,177

Current operating income


422,634

316,039

Other operating income and expenses

28

(9,116)

(3,177)

Operating income


413,518

312,862

Finance costs


(29,605)

(21,477)

Share in net income of associates


0

0

Badwill


0

0

Income tax expense

29

(100,561)

(67,511)

Consolidated net income before non-controlling interests


283,352

223,874

Non-controlling interests


(244)

(57)

Net income for the year


283,107

223,817

Earnings per share (€)

31

1.90

1.50

Diluted earnings per share (€)

31

1.90

1.50

4.1.3Consolidated statement of comprehensive income

(in thousands of euros)

Notes

December 31, 2022

December 31, 2021

Net income of the period


283,107

223,817

Non-controlling interests


244

57

Other comprehensive income


Currency translation differences reclassifiable to income


5,170

4,956

Reclassified to income


0

0

Recognised in equity


5,170

4,956

Fair value adjustments on available-for-sale financial assets

3; 12; 19

(264,947)

10,252

Recognised in equity – reclassifiable to income – gross


(310,341)

23,488

Recognised in equity – reclassifiable to income – tax effect


54,626

(5,873)

Reclassified to income – gross


(12,861)

(9,185)

Reclassified to income – tax effect


3,629

1,822

Fair value adjustments on employee benefit obligations

3; 12; 19

9,310

1,622

Recognised in equity – not reclassifiable to income – gross


13,015

2,349

Recognised in equity – not reclassifiable to income – tax effect


(3,705)

(727)

Other comprehensive income of the period, net of tax


(250,467)

16,830

Total comprehensive income of the period


32,884

240,704

  • attributable to owners of the parent


32,697

240,648

  • attributable to non-controlling interests


187

56

4.1.4Statement of changes in equity

(in thousands of euros)

Notes

Share
 capital

Premiums

Consolidated reserves

Treasury
 shares

Other comprehensive income

Net income for the period

Equity attributable to owners of the parent

Non-
controlling interests

Total equity

Foreign currency translation reserve

Reclassifiable revaluation reserves

Non-reclassifiable revaluation reserves

Equity at December 31, 2020


304,064

810,420

671,939

(15,822)

(33,560)

202,482

(24,115)

82,900

1,998,308

267

1,998,575

2020 net income to be appropriated


82,900


(82,900)


Payment of 2020 dividends in 2021


(81,976)


(81,976)

4

(81,980)

Total transactions with owners


0

0

924

0

0

0

0

(82,900)

(81,976)

(4)

(81980)

December 31, 2021 net income


223,817

223,817

57

223,874

Fair value adjustments on available-for-sale financial assets recognized in equity


17,106


17,106

1

17,107

Fair value adjustments on available-for-sale financial assets reclassified to income statement


(7,363)


(7,363)

0

(7,363)

Change in actuarial gains and losses (IAS 19R)


1,622


1,622


1,622

Currency translation differences


4,958


4,958

(2)

4,956

Cancellation of COFACE SA shares


(3,704)


(11,298)


(15,002)


(15,002)

Treasury shares elimination


103


103


103

Free share plans expenses


465


465


465

Transactions with shareholders and others


(1,504)


508


(996)

(10)

(1,006)

Equity at December 31, 2021


300,360

810,420

660,526

(15,719)

(28,602)

212,733

(22,493)

223,817

2,141,042

309

2,141,351

2021 net income to be appropriated


223,817


(223,817)


Payment of 2021 dividends in 2022


(86,868)

(137,161)


(224,029)

14

(224,043)

Total transactions with owners


0

(86,868)

86,656

0

0

0

0

(223,817)

(224,029)

(14)

(224,043)

December 31, 2022 net income


283,107

283,107

244

283,351

Fair value adjustments on available-for-sale financial assets recognized in equity

3; 12; 14; 19


(255,684)


(255,684)

(32)

(255,716)

Fair value adjustments on available-for-sale financial assets reclassified to income statement

3; 12; 14; 19


(9,233)


(9,233)

0

(9,233)

Change in actuarial gains and losses (IAS 19R)


9,310


9,310


9,310

Currency translation differences


5,195


5,195

(25)

5,170

Cancellation of COFACE SA shares


0


Treasury shares elimination


(3,430)


(3,430)


(3,430)

Free share plans expenses


2,203


2,203


2,203

Transactions with shareholders and others


(51)

12,035


11,984


13,248

Equity at December 31, 2022


300,360

723,501

761,421

(19,149)

(23,407)

(52,184)

(13,183)

283,107

1,960,466

1,746

1,962,211

4.1.5Consolidated statement of cash flows

(in thousands of euros)

Dec.31, 2022

Dec.31, 2021

Net income for the period

283,107

223,817

Non-controlling interests

244

57

Income tax expense

100,561

67,511

Finance costs

29,605

21,477

Operating income (A)

413,518

312,862

+/- Depreciation, amortization and impairment losses

37,826

30,153

+/- Net additions to/reversals from technical provisions

189,509

106,475

+/- Unrealized foreign exchange income/loss

(17,082)

13,499

+/- Non-cash items

(33,311)

24,219

Total non-cash items (B)

176,942

174,347

Gross cash flows from operations (C) = (A) + (B)

590,460

487,208

Change in operating receivables and payables

(57,964)

(90,077)

Net taxes paid

(95,610)

(87,081)

Net cash related to operating activities (D)

(153,575)

(177,157)

Increase (decrease) in receivables arising from factoring operations

(224,891)

(366,695)

Increase (decrease) in payables arising from factoring operations

308,595

92,618

Increase (decrease) in factoring liabilities

(71,397)

290,984

Net cash generated from banking and factoring operations (E)

12,307

16,907

Net cash generated from operating activities (F) = (C + D + E)

449,193

326,958

Acquisitions of investments

(1,550,398)

(892,110)

Disposals of investments

1,449,816

693,32

Net cash used in movements in investments (G)

(100,581)

(198,789)

Acquisitions of consolidated subsidiaries, net of cash acquired

5,414

7,285

Disposals of consolidated companies, net of cash transferred

(0)

(0)

Net cash used in changes in scope of consolidation (H)

5,414

7,285

Acquisitions of property, plant and equipment and intangible assets

(32,241)

(17,166)

Disposals of property, plant and equipment and intangible assets

3,007

728

Net cash generated from (used in) acquisitions and disposals of property, plant and equipment and intangible assets (I)

(29,234)

(16,438)

Net cash used in investing activities (J) = (G + H + I)

(124,401)

(207,942)

Proceeds from the issue of equity instruments

(0)

(0)

Treasury share transactions

(3,430)

(14,886)

Dividends paid to owners of the parent

(224,029)

(81,976)

Dividends paid to non-controlling interests

(15)

(4)

Cash flows related to transactions with owners

(227,474)

(96,866)

Proceeds from the issue of debt instruments

297,012

(0)

Cash used in the redemption of debt instruments

(162,164)

0

Lease liabilities variations

(17,591)

(16,762)

Interests paid

(32,478)

(20,732)

Cash flows related to the financing of Group operations

84,780

37,494

Net cash generated from (used in) financing activities (K)

(142,694)

(134,360)

Impact of changes in exchange rates on cash and cash equivalents (L)

9,248

(23,187)

Net increase in cash and cash equivalents (F + J + K + L)

191,345

(38,528)

Net cash generated from operating activities (F)

449,193

326,958

Net cash used in investing activities (J)

(124,401)

(207,942)

Net cash generated from (used in) financing activities (K)

(142,694)

(134,360)

Impact of changes in exchange rates on cash and cash equivalents (L)

9,248

(23,187)

Cash and cash equivalents at beginning of period

362,441

400,969

Cash and cash equivalents at end of period

553,786

362,441

Net change in cash and cash equivalents

191,345

(38,528)

4.2Notes to the consolidated financial statements

Basis of preparation

These IFRS consolidated financial statements of the Coface Group as at December 31, 2022 are established in accordance with the International Financial Reporting Standards (IFRS) as published by the IASB and as adopted by the European Union (1). They are detailed in the note “Accounting principles”.

The balance sheet is presented with comparative financial information at December 31, 2021. The income statement is presented with comparative financial information at December 31, 2021.

These IFRS consolidated financial statements for the year ended December 31, 2022 were reviewed by the Coface Group’s Board of Directors on February 16, 2023.

Significant events
Governance evolution
In the Board of Directors

On May 17, 2022, during the Combined General Meeting, Laetitia Léonard-Reuter and Laurent Musy have been elected as independent directors for a term of four years. These appointments follow the expiration of the terms of office of Olivier Zarrouati and Éric Hémar, respectively.

Thus, at the close of the General Meeting, the Board of Directors is composed of ten members, five women and five men, the majority (six) of whom are independent directors.

In the Executive Committee

On May 2, 2022, Hugh Burke has been appointed as the CEO of Coface Asia-Pacific region, effective on April 1, 2022. He joins the Group Executive Committee and reports to Xavier Durand, Coface CEO. He takes over from Bhupesh Gupta.

On September 8, 2022, Matthieu Garnier, Group Information Services Director, joined the Group Executive Committee and will continue to report to Thibault Surer, Group Strategy & Development Director. This decision is part of our strategy to develop information services, one of the major pillars of our Build to Lead plan.

Natixis announces the sale of its residual stake in COFACE SA

On January 6, 2022, Natixis announced the sale of its remaining interest in COFACE SA. This sale represented approximately 10.04% of COFACE SA’s share capital, or 15,078,095 shares. It was carried out by way of an ABB (accelerated book-building) at an average price of €11.55. Following this transaction, Natixis no longer held any shares in COFACE SA.

Anticipated impacts of the Ukraine crisis

The invasion of Ukraine by Russia on February 24, 2022 has triggered a war in Europe for the first time since the Second World War. This armed conflict and the numerous economic sanctions taken against Russia had serious economic, financial an inflationary consequences for the whole world.

In this context, Coface has adjusted its assessments of Russian, Belarusian and Ukrainian risks and reduced its exposure to these countries during 2022. The Group continues to monitor closely the situation on a daily basis and is constantly adjusting its underwriting policy to ensure compliance with international sanctions.

To date, and subject to any changes in the situation, this serious crisis has greatly increased uncertainty and volatility due to its multi-sector and multi-geographical impact.

Coface is not directly exposed to the countries in conflict through its investment portfolio.

Coface Russia Insurance’s earned premiums will amount to €11.6 million in 2022 (vs. €12.5 million in 2021, i.e. 1% of the Group total) and this subsidiary contributed €25.8 million to the Group’s total balance sheet in 2022 (i.e. 0.3% of the consolidated total balance sheet). Losses related to this conflict have increased but remain limited at the Group level.

The Group’s exposure to Russian debtors has decreased from just under 1% of total exposure to 0.1% as at December 31, 2022.

Financial and non-financial rating agency
AM Best affirms Coface’s main operating subsidiaries rating at A (Excellent) with a stable outlook

On April 7, 2022, the rating agency AM Best affirmed the A (Excellent) Insurer Financial Strength – IFS rating of Compagnie française d’assurance pour le commerce extérieur (la Compagnie), Coface North America Insurance Company (CNAIC) and Coface Re. The outlook for these ratings remain “stable”.

MSCI upgrades COFACE SA’s rating from AA to AAA.

On July 14, 2022, COFACE SA’s rating was upgraded to “AAA” by the extra-financial rating agency MSCI, which analyzes the environmental, social and governance (ESG) practices of thousands of companies worldwide.

This places COFACE SA in the top 4% of companies in its industry (“Property & Casualty Insurance” category).

Moody’s affirms Coface’s ratings, changes outlook to positive

On October 11, 2022, the rating agency Moody’s has confirmed the financial strength rating (Insurance Financial Strength Rating – IFSR) for Coface at A2. The agency has also changed the outlook for Coface to positive from stable.

Fitch affirms Coface AA- rating, with ‘stable’ outlook

On November 23, 2022, the rating agency Fitch affirmed Coface AA- Insurer Financial Strength (IFS) rating. The outlook remains stable.

Success of its debt management exercise

On September 21, 2022, COFACE SA announced the results of the tender offer to repurchase its guaranteed subordinated notes of an amount of €380,000,000 bearing a fixed interest rate of 4.125 per cent., due on March 27, 2024. The Company accepted the repurchase of a principal amount of €153,400,000 Notes validly tendered at a fixed purchase price of 103.625 per cent.

COFACE SA also announced the issuance on September 22, 2022 of €300,000,000 tier 2 notes bearing a fixed interest rate of 6.000 per cent., due on September 22, 2032.

Coface New Zealand: new branch opens

On April 4, 2022, Coface announced the opening of an office in New Zealand after the approval from the Reserve Bank of New Zealand. This is in line with its ambitions to grow in new high-potential markets.

According to the World Bank, the value of New Zealand’s exports reached $50.5 billion in 2020. This market therefore offers significant potential to develop the credit insurance solutions and adjacent specialty services.

Scope of consolidation
Change in the scope of consolidation in 2022
First-time consolidation

During the year 2022, six entities that have been exclusively owned for several years were consolidated. These are Coface Services Greece, Coface Norden Services A/S, Coface Sverige Services AB, Coface Services Suisse, Coface Services Argentine et Coface Baltics Services. Coface Nouvelle-Zelande was créated in 2022 and afterward also integrated into the consolidation scope.

Exit from consolidation scope

There was no exit from the scope in 2022.

Merger

Coface Finance Israel was absorbed by Coface Coface Israel.

Coface PKZ subsidiary became a branch in 2022.

Change in interest percentage

Following a local ruling, the percentage of interest of South Africa moved from 97,5% to 75%.

Special purpose entities (SPE)
SPEs used for the credit insurance business

Coface’s credit enhancement operations consist of insuring, via a special purpose entity (SPE), receivables securitised by a third party through investors, for losses in excess of a predefined amount. In this type of operation, Coface has no role whatsoever in determining the SPE’s activity or its operational management. The premium received on the insurance policy represents a small sum compared to all the benefits generated by the SPE, the bulk of which flow to the investors.

Coface does not sponsor securitisation arrangements. It plays the role of mere service provider to the special purpose entity by signing a contract with the SPE. In fact, Coface holds no power over the relevant activities of the SPEs involved in these arrangements (selection of receivables in the portfolio, receivables management, etc.). No credit insurance SPEs were consolidated within the financial statements.

SPEs used for financing operations

Since 2012, Coface has put in place an alternative refinancing solution to the liquidity line granted by Natixis for the Group’s factoring business in Germany and Poland (SPEs used for financing operations).

Under this solution, every month, Coface Finanz – a Group factoring company – sells its factored receivables to a French SPV (special purpose vehicle), the FCT Vega securitisation fund. The sold receivables are covered by credit insurance.

The securitisation fund acquires the receivables at their nominal value less a discount (determined on the basis of the portfolio’s past losses and refinancing costs). To obtain refinancing, the fund issues (i) senior units to the conduits (one conduit per bank) which in turn issue ABCP (asset-backed commercial paper) on the market, and (ii) subordinated units to Coface Factoring Poland. The Coface Group holds control over the relevant activities of the FCT.

The FCT Vega securitisation fund is consolidated in the Group financial statements.

SPEs used for investing operations

The “Colombes” mutual funds were set up in 2013 to centralise the management of the Coface Group’s investments. The administrative management of these funds has been entrusted to Amundi, and Caceis has been selected as custodian and asset servicing provider.

The European branches of Compagnie Française d’Assurance pour le commerce extérieur, which do not have any specific local regulatory requirements, participate in the centralized management of their assets, set up by the Compagnie française d’assurance pour le commerce extérieur. They receive a share of the global income resulting from the application of an allocation key representing the risks subscribed by each branch and determined by the technical accruals.

Fonds Lausanne was created in 2015 in order to allow Coface Re to subcribe for parts in investment funds, the management is delegated to Amundi, the custodian is Caceis Switzerland and the asset servicing provider is Caceis.

The three criteria established by IFRS 10 for consolidation of the FCP Colombes and FCP Lausanne funds are met. Units in dedicated mutual funds (UCITS) have been included in the scope of consolidation and are fully consolidated. They are fully controlled by the Group.

All of Coface entities are consolidated by full integration method.

Country

Entity

Consolidation Method

Percentage

Control

Interest

Control

Interest

Dec. 31, 2022

Dec. 31, 2022

Dec. 31, 2021

Dec. 31, 2021

Northern Europe


Germany

Coface, Niederlassung in Deutschland (ex Coface Kreditversicherung)

-

Branch*

Branch*

Germany

Coface Finanz GMBH

Full

100,00%

100,00%

100,00%

100,00%

Germany

Coface Debitorenmanagement GMBH

Full

100,00%

100,00%

100,00%

100,00%

Germany

Coface Rating Holding GMBH

Full

100,00%

100,00%

100,00%

100,00%

Germany

Coface Rating GMBH

Full

100,00%

100,00%

100,00%

100,00%

Germany

Kisselberg KG

Full

100,00%

100,00%

100,00%

100,00%

Germany

Fct Vega (Fonds de titrisation) 

Full

100,00%

100,00%

100,00%

100,00%

Netherlands

Coface Nederland Services 

Full

100,00%

100,00%

100,00%

100,00%

Netherlands

Coface Nederland

-

Branch*

Branch*

Denmark

Coface Danmark

-

Branch*

Branch*

Denmark

Coface Norden Services (Danmark Services)

Full

100,00%

100,00%

-


Sweden

Coface Sverige

-

Branch*

Branch*

Sweden

Coface Sverige Services AB (Sweden Services)

Full

100,00%

100,00%

-


Norway

Coface Norway - SUCC (Coface Europe)

-

Branch*

Branch*

Western Europe


France

COFACE SA

Parent company

100,00%

100,00%

100,00%

100,00%

France

Compagnie française d'assurance pour le commerce extérieur

Full

100,00%

100,00%

100,00%

100,00%

France

Cofinpar 

Full

100,00%

100,00%

100,00%

100,00%

France

Cogeri 

Full

100,00%

100,00%

100,00%

100,00%

France

Fimipar 

Full

100,00%

100,00%

100,00%

100,00%

France

Fonds Colombes 2 

Full

0,00%

0,00%

0,00%

0,00%

France

Fonds Colombes 2 bis

Full

100,00%

100,00%

100,00%

100,00%

France

Fonds Colombes 3

Full

100,00%

100,00%

100,00%

100,00%

France

Fonds Colombes 3 bis

Full

100,00%

100,00%

100,00%

100,00%

France

Fonds Colombes 3 ter

Full

100,00%

100,00%

100,00%

100,00%

France

Fonds Colombes 3 quater

Full

100,00%

100,00%

100,00%

100,00%

France

Fonds Colombes 4

Full

100,00%

100,00%

100,00%

100,00%

France

Fonds Colombes 5 bis

Full

100,00%

100,00%

100,00%

100,00%

France

Fonds Colombes 6

Full

100,00%

100,00%

100,00%

100,00%

Belgium

Coface Belgium Services

Full

100,00%

100,00%

100,00%

100,00%

Belgium

Coface Belgique 

-

Branch*

Branch*

Switzerland

Coface Suisse 

-

Branch*

Branch*

Switzerland

Coface Services Suisse

Full

100,00%

100,00%

-

Switzerland

Coface Ré

Full

100,00%

100,00%

100,00%

100,00%

Western Europe (2)


Switzerland

Fonds Lausanne 2

Full

100,00%

100,00%

100,00%

100,00%

Switzerland

Fonds Lausanne 2

Full

100,00%

100,00%

100,00%

100,00%

Switzerland

Fonds Lausanne 2 bis

Full

100,00%

100,00%

100,00%

100,00%

Switzerland

Fonds Lausanne 3

Full

100,00%

100,00%

100,00%

100,00%

Switzerland

Fonds Lausanne 3 bis

Full

100,00%

100,00%

100,00%

100,00%

Switzerland

Fonds Lausanne 5

Full

100,00%

100,00%

100,00%

100,00%

Switzerland

Fonds Lausanne 6

Full

100,00%

100,00%

100,00%

100,00%

UK

Coface UK Holdings

Full

100,00%

100,00%

100,00%

100,00%

UK

Coface UK Services

Full

Branch*

Branch*

UK

Coface UK

-

Branch*

Branch*

Central Europe


Austria

Coface Austria Kreditversicherung Service GmbH

Full

100,00%

100,00%

100,00%

100,00%

Austria

Coface Central Europe Holding AG

Full

100,00%

100,00%

100,00%

100,00%

Austria

Compagnie francaise d´assurance pour le Commerce Exterieur SA Niederlassung Austria

-

Branch*

Branch*

Hungary

Compagnie francaise d´assurance pour le commerce extérieur Hungarian Branch Office

-

Branch*

Branch*

Poland

Coface Poland Insurance Services

Full

100,00%

100,00%

100,00%

100,00%

Poland

Coface Poland Factoring Sp. z o.o.

Full

100,00%

100,00%

100,00%

100,00%

Poland

Compagnie francaise d'assurance pour le commerce exterieur Spółka Akcyjna Oddział w Polsce

-

Branch*

Branch*

Czech Republic

Compagnie francaise d'assurance pour le commerce exterieur organizační složka Česko

-

Branch*

Branch*

Romania

Coface Romania Insurance Services 

Full

100,00%

100,00%

100,00%

100,00%

Romania

Compagnie francaise d’assurance pour le commerce exterieur S.A. Bois - Colombes – Sucursala Bucuresti

-

Branch*

Branch*

Romania

Coface Technologie - Roumanie

-

Branch*

Branch*

Slovakia

Compagnie francaise d´assurance pour le commerce extérieur, pobočka poisťovne z iného členského štátu

-

Branch*

Branch*

Slovenia

Coface PKZ

-

Branch*

100,00%

100,00%

Lithuania

Compagnie Francaise d'Assurance pour le Commerce Exterieur Lietuvos filialas

-

Branch*

Branch*

Lithuania

Coface Baltics Services

Full

100,00%

100,00%

-

Bulgaria

Compagnie Francaise d’Assurance pour le Commerce Exterieur SA – Branch Bulgaria

-

Branch*

Branch*

Russia

CJSC Coface Rus Insurance Company

Full

100,00%

100,00%

100,00%

100,00%

Mediterranean & Africa


Italy

Coface Italy (Succursale) 

-

Branch*

Branch*

Italy

Coface Italia

Full

100,00%

100,00%

100,00%

100,00%

Israel

Coface Israel

-

Branch*

Branch*

Israel

Coface Holding Israel 

Full

100,00%

100,00%

100,00%

100,00%

Israel

Coface Finance Israel 

-

0,00%

0,00%

100,00%

100,00%

Israel

BDI – Coface (business data Israel) 

Full

100,00%

100,00%

100,00%

100,00%

South Africa

Coface South Africa 

Full

75,00%

75,00%

97,50%

97,50%

South Africa

Coface South Africa Services

Full

100,00%

100,00%

100,00%

100,00%

Spain

Coface Servicios España, 

Full

100,00%

100,00%

100,00%

100,00%

Spain

Coface Iberica 

-

Branch*

Branch*

Portugal

Coface Portugal 

-

Branch*

Branch*

Greece

Coface Grèce

-

Branch*

Branch*

Greece

Coface Services Grèce

Full

100,00%

100,00%

-

Turquey

Coface Sigorta 

Full

100,00%

100,00%

100,00%

100,00%

North America


United States

Coface North America Holding Company 

Full

100,00%

100,00%

100,00%

100,00%

United States

Coface Services North America 

Full

100,00%

100,00%

100,00%

100,00%

United States

Coface North America Insurance company 

Full

100,00%

100,00%

100,00%

100,00%

Canada

Coface Canada 

-

Branch*

Branch*

Latin America


Mexico

Coface Seguro De Credito Mexico SA de CV

Full

100,00%

100,00%

100,00%

100,00%

Mexico

Coface Holding America Latina SA de CV

Full

100,00%

100,00%

100,00%

100,00%

Mexico

Coface Servicios Mexico. S.A.DE C.V.

Full

100,00%

100,00%

100,00%

100,00%

Brazil

Coface Do Brasil Seguros de Credito

Full

100,00%

100,00%

100,00%

100,00%

Chile

Coface Chile SA

Full

100,00%

100,00%

100,00%

100,00%

Chile

Coface Chile 

-

Branch*

Branch*

Argentina

Coface Argentina 

-

Branch*

Branch*

Argentina

Coface Sevicios Argentina S.A

Full

100,00%

100,00%

-

Ecuador

Coface Ecuador 

-

Branch*

Branch*

Asia-Pacific


Australia

Coface Australia 

-

Branch*

Branch*

Hong-Kong

Coface Hong Kong 

-

Branch*

Branch*

Japan

Coface Japon 

-

Branch*

Branch*

Singapore

Coface Singapour 

-

Branch*

Branch*

New Zealand

Coface New Zealand Branch

-

Branch*

-

Taiwan

Coface Taiwan 

-

Branch*

Branch*

* Branch of Compagnie française d’assurance pour le commerce extérieur

Accounting principles
Applicable accounting standards

Pursuant to European regulation 1606/2002 of July 19, 2002, the consolidated financial statements of Coface as of December 31, 2022 are prepared in accordance with IAS/IFRS and IFRIC interpretations as adopted in the European Union and applicable at that date.

Standards applied since January 1, 2022.

Amendments related to IAS 16, IAS 37 and IFRS 3

The amendments related to IFRS 3 “Business Combinations”, IAS 16 “Property, Plant and Equipment—Proceeds before Intended Use” and IAS 37 “Onerous Contracts—Cost of Fulfilling a Contract”, published on July 2, 2021, are applicable from January 1, 2022 with possible early application. This amendment had no impact on Coface’s accounts.

Standards and amendments published but not yet effective

A number of new standards are effective for annual periods beginning after January 1, 2022 and earlier application is permitted. However, the Group has not early adopted the new standards in preparing its consolidated financial statements.

The Group will apply IFRS 17 and IFRS 9 for the first time on January 1, 2023. For insurance companies listed on the stock exchange, these standards will bring significant changes to the accounting for insurance and reinsurance contracts and financial instruments. However, the application of these standards is not expected to have a material impact on the Group’s consolidated financial statements in the period of initial application.

A. Estimated impact of the adoption of IFRS 17

As requested by the standard, the Group will restate comparative information on adoption of IFRS 17. In that case, the date of transition will be January 1, 2022.

The Group has estimated the impact that the initial application of IFRS 17 will have on its consolidated financial statements. The total adjustment (after tax) to the Group’s equity is an increase of €91 million at January 1, 2022, as summarised below.

(in millions of euro)

Note

January 1, 2022

Estimated increase (reduction) in the Group’s equity


Adjustments due to adoption of IFRS 17

(B)(vi)

119

Deferred tax impacts


(28)

Estimated impact of adoption of IFRS 17 after tax


91

B. IFRS 17 Insurance Contracts

IFRS 17, published on May 18, 2017, and amended on June 25, 2020, replaces IFRS 4 “Insurance Contracts” and is effective for annual periods beginning on or after January 1, 2023, with early adoption permitted.

i. Identifying contracts in the scope of IFRS 17

IFRS 17 establishes the principles for the recognition, measurement, presentation and disclosure of insurance contracts issued, reinsurance contracts and investment contracts with discretionary participating features, provided also insurance contracts are also issued.

When identifying contracts in the scope of IFRS 17, in some cases the Group will have to assess whether a set or series of contracts needs to be treated as a single contract and whether goods and services components have to be separated and accounted for under another standard. The Group does not expect changes arising from the application of these requirements.

ii. Level of aggregation

The standard requires a more detailed level of granularity in the calculations since it requires estimates by group of contracts, without classifying contracts issued more than one year apart in the same group – annual cohorts.

The optional “carve-out” introduced by the European Commission and allowing the annual cohort requirement to be waived, do not apply to the Group as no business is eligible.

Groups of contracts are determined by first identifying portfolios of contracts, each comprising contracts subject to similar risks and managed together. Coface has defined three portfolio: Trade Credit- Insurance business line, Single Risk business line and Bonding business line.

Each portfolio is then divided into annual cohorts (i.e. by year of issue) and each annual cohort into three groups:

  • a group of contracts that are onerous on initial recognition (for which a loss component, if any, will be immediately recognized through profit and loss);
  • a group of contracts that at initial recognition have a possibility of becoming onerous subsequently;
  • a group with the remaining contracts in the portfolio.

Furthermore, IFRS 17 specifies that an entity is permitted to subdivide the groups in order to assess the profitability. Coface has defined 15 group of contracts on Trade Credit-Insurance, one group of contracts on Single Risk and one group of contracts on Bonding.

When a contract is recognised, it is added to an existing group of contracts or, if the contract does not qualify for inclusion in an existing group, it forms a new group to which future contracts may be added.

iii. Contract boundaries and coverage period

Under IFRS 17, the measurement of a group of contracts includes all of the future cash flows within the boundary of each contract in the group. The period covered by the premiums within the contract boundary is the ‘coverage period’, which is relevant when applying a number of requirements in IFRS 17.

The Group considers that the requirements related to the contracts boundaries of insurance contracts are linked to the practical ability to reassess the risks of the policyholders at individual contract and those related to reinsurance contracts are linked to the practical ability for the reinsurer to terminate the reinsurance coverage. According to those requirements, IFRS 17 does not change the scope of cash flows to be included in the measurement of existing recognised contracts.

iv. Coverage period

The coverage period is defined as the period during which the entity provides coverage for insured events. IFRS 17 defines the insured event as “an uncertain future event covered by an insurance contract that creates insurance risk.” The Group has defined the coverage period of Trade Credit-Insurance business line as the period from the beginning of the insurance policy until the potential default due date by the debtor towards the policyholder. In that case, the potential default due date has been defined as the contractual maximum credit period.

v. Measurement – Overview

IFRS 17 requires measurement model at current value, where the general model (or BBA) is based on the following “building block”:

  • the fulfilment cash flows (FCF), which comprise:
    • probability-weighted estimates of future cash flows,
    • an adjustment to reflect the time value of money (i.e. discounting) and the financial risks associated with those future cash flows,
    • and a risk adjustment for non-financial risk;
  • the Contractual Service Margin (CSM). The CSM represents the unearned profit for a group of insurance contracts and will be recognized as the entity provides services in the future.

At the end of each subsequent reporting period the carrying amount of a group of insurance contracts is remeasured to be the sum of:

  • the liability for remaining coverage, which comprises the FCF related to future services and the CSM of the group at that date; and
  • the liability for incurred claims, which is measured as the FCF related to past services allocated to the group at that date.

In addition, a simplified measurement model called Premium Allocation Approach (PAA) is permitted for the measurement of the liability for remaining coverage if it provides a measurement that is not materially different from the general model or if the coverage period is one year or less.

The Group expects that it will apply the PAA to all the insurance and reinsurance portfolios, of which Trade Credit-Insurance representing the major part of its business as the resulting measurement of the asset for remaining coverage would not differ materially from the result of applying the general model.

vi. Measurement – PAA application

With the PAA, the liability for remaining coverage corresponds to premiums received at initial recognition less acquisition costs and amounts already recognized in profit and loss at the closing date. The Group does not elect the option to recognise insurance acquisition commissions cash flows as expenses when they are incurred but amortizes them over the coverage period.

Subsequently, the carrying amount of the liability for remaining coverage is increased by any further premiums received and decreased by the amount recognised as insurance revenue for services provided. If at any time before and during the coverage period, a group of contracts is or becomes onerous, then the Group will recognize a loss in profit or loss and increase the liability for remaining coverage.

The Group expects that the time between providing each part of the services and the related premium due date will be no more than a year. Accordingly, as permitted under IFRS 17, the Group will not adjust the liability for remaining coverage to reflect the time value of money and the effect of financial risk.

The general model remains applicable for the measurement of incurred claims. The future cash flows will be discounted (at current rates).

vii. Measurement – Significant judgements and estimates
Estimates of future cash flows

In estimating future cash flows, the Group will incorporate, in an unbiased way, all reasonable and supportable information that is available without undue cost or effort at the reporting date. This information includes both internal and external historical data about claims and other experience, updated to reflect current expectations of future events.

The estimates of future cash flows will reflect the Group’s view of current conditions at the reporting date, as long as the estimates of any relevant market variables are consistent with observable market prices.

When estimating future cash flows, the Group will take into account current expectations of future events that might affect those cash flows. However, expectations of future changes in legislation that would change or discharge a present obligation or create new obligations under existing contracts will not be taken into account until the change in legislation is substantively enacted.

Cash flows within the boundary of a contract are those that relate directly to the fulfilment of the contract, including those for which the Group has discretion over its amount or timing. These include payments to (or on behalf of) policyholders, insurance acquisition cash flows and other costs that are incurred in fulfilling contracts. Insurance acquisition cash flows and other costs that are incurred in fulfilling contracts comprise both direct costs and an allocation of fixed and variable overheads.

The overheads will be attributed to acquisition activities, other fulfilment activities and other activities at local entity level using activity-based costing techniques. Cash flows attributable to acquisition and other fulfilment activities will be allocated to groups of contracts using methods that are systematic and rational and will be consistently applied to all costs that have similar characteristics.

Discount rates

To determine the yield curve used to discount the cash flows, the standard describes two approaches:

  • a “bottom-up” approach which consists in determining the discount rates by adjusting a liquid risk-free yield curve to reflect the differences between the liquidity characteristics of the financial instruments that underlie the rates observed in the market and the liquidity characteristics of the insurance;
  • a “top-down” approach which consists in determining the discount rates for insurance contracts, based on a yield curve that reflects the current market rates of return implicit in a fair value measurement of a reference portfolio of assets but by adjusting that yield curve to eliminate any factors that are not relevant to the insurance contracts.

The Group will use the methodology of the “bottom-up” approach to determine the yield curves.

Risk adjustments for non-financial risk

Risk adjustments for non-financial risk will be determined to reflect the compensation that the Group would require for bearing non-financial risk and its degree of risk aversion.

The risk adjustment for non-financial risk will be determined using the confidence level technique. The Group will apply this technique to the gross and calculate the amount of risk being transferred to the reinsurer by applying the reinsurance treaties conditions.

Applying a confidence level technique, the Group will estimate the probability distribution of the expected present value of the future cash flows from the contracts at each reporting date and calculate the risk adjustment for non-financial risk as the excess of the value at risk at the target confidence level over the expected present value of the future cash flows allowing for the associated risks over all future years.

viii. Presentation and disclosure

IFRS 17 will significantly change how insurance contracts and reinsurance contracts are presented and disclosed in the Group’s consolidated financial statements.

Under IFRS 17, portfolios of insurance contracts that are assets and those that are liabilities, and portfolios of reinsurance contracts that are assets and those that are liabilities, are presented separately in the statement of financial position. All rights and obligations arising from a portfolio of contracts will be presented on a net basis; therefore, balances such as insurance receivables and payables and policyholder loans will no longer be presented separately. Any assets or liabilities recognized for cash flows arising before the recognition of the related group of contracts (including any assets for insurance acquisition cash flows) will also be presented in the same line item as the related portfolios of contracts.

In terms of presentation, the income and expenses of insurance and reinsurance contracts are broken down in the profit and loss into:

  • an insurance service result, comprising insurance revenue (corresponding to the insurance service provided over the period) and insurance service expenses (i.e. incurred claims and other incurred insurance service expense); Amounts from reinsurance contracts will be presented separately; and
  • insurance and reinsurance finance income or expenses.

The separate presentation of underwriting and financial results under IFRS 17 and IFRS 9 (see (C)) will provide added transparency about the sources of profits and quality of earnings.

Insurance service result

For contracts measured using the PAA, insurance revenue is recognised based on an allocation of expected premium receipts to each period of coverage, which is based on the passage of time. The requirements in IFRS 17 to recognise insurance revenue over the coverage period will result in slower revenue recognition compared with the Group’s current practice based on the contract duration.

Expenses that relate directly to the fulfilment of contracts will be recognised in profit or loss as insurance service expenses, generally when they are incurred. Expenses that do not relate directly to the fulfilment of contracts will be presented outside the insurance service result.

Insurance finance income and expenses

Under IFRS 17, changes in the carrying amounts of groups of contracts arising from the effects of the time value of money, financial risk and changes therein are generally presented as insurance finance income or expenses.

The Group intends to apply the option offered by IFRS 17 to disaggregate the insurance or reinsurance financial expenses between Income Statement and OCI (Other Comprehensive Income). The application of this option leads to the unwinding of discount in the Income Statement based on locked-in discount rates, while the difference between the valuation at current rates and locked-in rates due to changes in discount rates is presented in the OCI. This option allows also the reclassification in OCI of a part of the differences in FCF estimates due to variation of the financial hypothesis.

If the Group derecognises a contract as a result of a transfer to a third party or a contract modification, then any remaining amounts of accumulated OCI for the contract will be reclassified to profit or loss.

Disclosure

IFRS 17 requires extensive new disclosures about amounts recognised in the financial statements, including detailed reconciliations of contracts, effects of newly recognised contracts and information on the expected CSM emergence pattern, as well as disclosures about significant judgements made when applying IFRS 17. There will also be expanded disclosures about the nature and extent of risks from insurance contracts, reinsurance contracts.

Disclosures will generally be made at a more granular level than under IFRS 4, providing more transparent information for assessing the effects of contracts on the financial statements.

ix. Transition

The Group is not concerned by the transition approaches from IFRS 4 to IFRS 17 as described by the standard because they do not apply to the Groups in PAA.

C. IFRS 9 Financial instruments

IFRS 9 replaces IAS 39 Financial Instruments: Recognition and Measurement and is effective for annual periods beginning on or after January 1, 2018, with early adoption permitted. However, the Group has met the relevant criteria and has applied the temporary exemption from IFRS 9 for annual periods before January 1, 2023. Consequently, the Group will apply IFRS 9 for the first time on January 1, 2023 with no pro forma on prior periods in line with option given by the standard.

From 2018, IFRS 9 is already applied for the entities in the factoring business.

Classification

The classification of financial assets under IFRS 9 is generally based on the business model in which a financial asset is managed and its contractual cash flow characteristics. IFRS 9 includes three principal measurement categories for financial assets – measured at amortised cost, FVOCI (2) and FVTPL (3)– and eliminates the previous IAS 39 categories of held-to-maturity investments, loans and receivables, and available-for-sale financial assets.

A financial asset is measured at amortised cost if it meets both of the following conditions and is not designated as measured at FVTPL:

  • it is held within a business model whose objective is to hold assets to collect contractual cash flows; and
  • its contractual terms give rise on specified dates to cash flows that are solely payments of principal and interest on the principal amount outstanding.

A financial asset is measured at FVOCI if it meets both of the following conditions and is not designated as measured at FVTPL:

  • it is held within a business model whose objective is achieved by both collecting contractual cash flows and selling financial assets; and
  • its contractual terms give rise on specified dates to cash flows that are solely payments of principal and interest on the principal amount outstanding.

All financial assets not classified as measured at amortised cost or FVOCI as described above are measured at FVTPL. In addition, on initial recognition the Group may irrevocably designate a financial asset that otherwise meets the requirements to be measured at amortised cost or at FVOCI as measured at FVTPL if doing so eliminates or significantly reduces an accounting mismatch that would otherwise arise.

Nevertheless, on initial recognition of an equity investment that is not held for trading, the Group may irrevocably elect to present subsequent changes in fair value in OCI. The election is made on an instrument-by-instrument basis.

Impact assessment

IFRS 9 will affect the classification and measurement of financial assets held by the Group at January 1, 2023 as follows:

  • derivative assets and liabilities, which are classified as held-for-trading and measured at FVTPL under IAS 39, will also be measured at FVTPL under IFRS 9;
  • debt investments that are classified as available-for-sale under IAS 39 may, under IFRS 9, be measured at FVOCI or FVTPL, depending on the particular circumstances;
  • equity investments that are classified as available-for-sale under IAS 39 will be measured at FVTPL under IFRS 9. However, the current portfolio of equity investments is held for long- term strategic purposes and will be designated as at FVOCI on January 1, 2023; consequently, all fair value gains and losses will be reported in OCI, no impairment losses will be recognised in profit or loss, and no gains or losses will be reclassified to profit or loss on disposal of these investments;
  • held-to-maturity investments measured at amortised cost under IAS 39 will be measured at FVOCI or amortised cost under IFRS 9;
  • loans and receivables measured at amortised cost under IAS 39 will also be measured at amortised cost under IFRS 9.

As a majority of the Group’s financial assets are measured at fair value both before and after transition to IFRS 9, the new classification requirements are not expected to have a material impact on the Group’s total equity at January 1, 2023.

The Group’s total equity is impacted only to the extent of any reclassifications between the amortised cost and fair value measurement categories.

Impairment
Measurement of ECL

ECL are a probability-weighted estimate of credit losses. Credit losses are measured as the present value of all cash shortfalls (i.e. the difference between the cash flows due to the Group in accordance with the contract and the cash flows that the Group expects to receive).

The key inputs into the measurement of ECL are the term structures of the PD, LGD and EAD. ECL for financial assets for which credit risk has not significantly increased are calculated by multiplying the 12-month PD by the respective LGD and EAD. Lifetime ECL are calculated by multiplying the lifetime PD by the respective LGD and EAD.

To determine lifetime and 12-month PDs, the Group will use the PD tables derived from Coface’s credit score (DRA).

LGD (Loss Given Default) is the magnitude of the likely loss if there is a default.

The Group estimates LGD parameters based on historical indemnities and recovery rates of claims against defaulted counterparties.

The liabilities data has been used to model defaults on the assets side and the correspondence mapping between issuers on the assets side and debtors on the liabilities side is done by name of issuer, leading to almost a full coverage for corporate and banks counterparties.

For calibration and modeling purpose, the mapping between issuers and debtors in Coface database is carefully managed by the Investment Department as a preliminary step of the ECL (Expected Credit Loss) calculation. The selected segmentation is the geographical area and the sector of the counterparties. In the absence of robust statistical calibration results for the selected macroeconomic variable, the Group proposed to consider a constant and conservative LGD (i.e. independent of the scenario) for ECL calculation.

EAD represents the expected exposure in the event of a default. The Group will derive the EAD from the current exposure to the counterparty and potential changes to the current amount allowed under the contract, including amortisation, and prepayments. The EAD of a financial asset is its gross carrying amount at the time of default.

Impact assessment

The Group estimates that application of the IFRS 9 impairment requirements at January 1, 2023 will result in additional loss allowances. The recognition of additional loss allowances on adoption of IFRS 9 mainly relates to debt investments measured at FVOCI. There will be no impact on Group’s total equity as the loss recognizes in the result will give rise to an equal and opposite gain in reserves (OCI); the recognition of loss allowances will not reduce the carrying amount of those investments, which will remain at their fair value.

The Group estimates that the application of the IFRS 9 impairment requirements to these investments will result in a non-significant transfer (before tax) from retained earnings to the fair value reserve at January 1, 2023.

Standards applied starting from January 1, 2023

The amendments related to IAS 1 “Disclosure of Material Accounting Policy Information” and IAS 8 “Definition of Accounting Estimates”, published on March 3, 2022, are applicable from January 1, 2023 with possible early application. This amendment had no impact on Coface’s accounts.

The amendments related to IAS 12 “Deferred Tax related to Assets and Liabilities arising from a Single Transaction”, published on August 12, 2022, are applicable from January 1, 2023 with possible early application. This amendment implied in Coface’s accounts.

Consolidation methods used

In accordance with IAS 1 “Presentation of Financial Statements”, IFRS 10 and IFRS 3 on “Business Combinations”, certain interests that are not material in relation to the Coface Group’s consolidated financial statements were excluded from the scope of consolidation.

Materiality is determined based on specific threshold and on a qualitative assessment of the relevance of each entity’s contribution to the consolidated financial statement of Coface.

The main thresholds applicable are as follows:

  • total balance sheet: €40 millions;
  • technical result: €5 millions;
  • net income: +/- €2 millions.

Moreover, under the Coface Group rules, the non-consolidated companies should fully distribute all their distributable profits except in the case of regulatory requirements or exceptional items.

The consolidation methods applied are as follows:

  • companies over which the Coface Group exercises exclusive control are fully consolidated;
  • companies over which the Coface Group exercises significant influence are accounted for by the equity method.

All the entities of the Coface Group scope are fully consolidated.

IFRS 10 supersedes IAS 27 “Consolidated and Separate Financial Statements” in relation to consolidated financial statements as well as SIC-12 on special purpose entities. The control of an entity must now be analysed through three aggregate criteria: the power on the relevant activities of the entity, exposure to the variable returns of the entity and the investor’s ability to affect the variable returns through its power over the entity. The analysis of Special Purpose Entities (SPE’s) from Coface Group is presented in the note Scope of consolidation.

Intercompany transactions

Material intercompany transactions are eliminated on the balance sheet and on the income statement.

Non-current assets held for sale and discontinued operations

In accordance with IFRS 5, a non-current asset (or disposal group) is classified as held for sale if its carrying amount will be recovered principally through a sale transaction. For this to be the case, the asset (or disposal group) must be available for immediate sale in its present condition and it must be highly probable that the sale will take place within 12 months.

A sale is deemed to be highly probable if:

  • management is committed to a plan to sell the asset (or disposal group);
  • a non-binding offer has been submitted by at least one potential buyer;
  • it is unlikely that significant changes will be made to the plan or that it will be withdrawn.

Once assets meet these criteria, they are classified under “Non-current assets held for sale” in the balance sheet at the subsequent reporting date, and cease to be depreciated/amortised as from the date of this classification. An impairment loss is recognised if their carrying amount exceeds their fair value less costs to sell. Liabilities related to assets held for sale are presented in a separate line on the liabilities side of the balance sheet.

If the disposal does not take place within 12 months of an asset being classified as “Non-current assets held for sale”, the asset ceases to be classified as held for sale, except in specific circumstances that are beyond Coface’s control.

A discontinued operation is a clearly identifiable component of an entity that either has been disposed of, or is classified as held for sale, and:

  • the component represents a separate major line of business or geographical area of operations;
  • without representing a separate major line of business or geographical area of business, the component is part of a single coordinated plan to dispose of a separate major line of business or geographical area of operations; or
  • the component is a subsidiary acquired exclusively with a view to resale.

The income from these operations is presented on a separate line of the income statement for the period during which the criteria are met and for all comparative periods presented. The amount recorded in this income statement line includes the net income from discontinued operations until they are sold, and the post -tax net income recognised on the measurement to fair value less costs to sell or on the disposal of the assets or disposal group(s) constituting the discontinued operation.

Year-end and accounting period

All consolidated companies have a December 31 year-end and an accounting period of 12 months.

Foreign currency translation
Translation of foreign currency transactions

At the orginial booking, in accordance with IAS 21, transactions carried out in foreign currencies (i.e., currencies other than the functional currency) are translated into the functional currency of the entity concerned using the exchange rates prevailing at the dates of the transactions. The Group’s entities generally use the closing rate for the month preceding the transaction date, which is considered as approximating the transaction-date exchange rate provided there are no significant fluctuations in rates. At each closing:

  • monetary items are translated at closing rate;
  • non monetary items evaluated at historical cost are translated at the exchange rate prevailing at the date of the transcation;
  • non monetary items evaluated at fair value are translated at exchange rate at the date of which the fair value has been set.
Translation of the financial statements of subsidiaries and foreign branches

Coface’s consolidated financial statements are presented in euros.

The balance sheets of foreign subsidiaries whose functional currency is not the euro are translated into euros at the year-end exchange rate, except for capital and reserves, which are translated at the historical exchange rate. All resulting foreign currency translation differences are recognised in the consolidated statement of comprehensive income.

Income statement items are translated using the average exchange rate for the year, which is considered as approximating the transaction-date exchange rate provided there are no significant fluctuations in rates (see IAS 21.40). All exchange differences arising on translation of these items are also recognised in other comprehensive income.

Hyperinflationary Economies

The application of IAS 29 “Financial Reporting in Hyperinflationary Economies” is required, as of July 1, 2018, for entities whose functional currency is Argentine Peso and, as of January 1, 2022, for the entity whose functional currency is Turkish Lira.

The Group has activities in Argentina and in Turkey.

Thus, the impact of the application of this standard is taken into account in the financial statements as of December 31, 2022.

General principles
The insurance business

An analysis of all of Coface’s credit insurance policies shows that they fall within the scope of IFRS 4, which permits insurers to continue to use the recognition and measurement rules applicable under local GAAP when accounting for insurance contracts.

Coface has therefore used French GAAP for the recognition of its insurance contracts.

However, IFRS 4:

  • prohibits the use of equalisation and natural disaster provisions;
  • and requires insurers to carry out liability adequacy tests.
The services business

Companies engaged in the sale of business information and debt collection services fall within the scope of IFRS 15 “Revenue from contracts with customers”.

Revenue is recognised when: (i) the entity has transferred to the buyer the significant risks and rewards of ownership of the goods; (ii) it is probable that the economic benefits associated with the transaction will flow to the entity; and (iii) the amount of revenue and costs incurred or to be incurred in respect of the transaction can be measured reliably.

The factoring business

Companies engaged in the factoring business apply IFRS 9 “Financial Instruments”. A financial instrument is a contract that gives rise to a financial asset of one entity (contractual right to receive cash or another financial asset from another entity) and a financial liability or equity instrument of another entity (contractual obligation to deliver cash or another financial asset to another entity).

Trade receivables are classified within the “Loans and receivables” category. After initial recognition at fair value, these receivables are measured at amortised cost using the effective interest method (EIM). The financing fee is recorded over the term of the factoring transactions, which is equivalent to it being included in the EIM in view of the short-term nature of the transactions concerned.

IFRS 15 “Revenue from contracts with customers” standard is also applied for factoring business according the same rules as the service business.

Classification of income and expenses for the Group’s different businesses
Breakdown by function of insurance company expenses

The expenses of French and international insurance subsidiaries are initially accounted for by nature and are then analysed by function in income statement items using appropriate cost allocation keys. Investment management expenses are included under investment expenses. Claims handling expenses are included under claims expenses. Policy acquisition costs, administrative costs and other current operating expenses are shown separately in the income statement.

Factoring companies

Operating income and expenses of companies involved in the factoring business are reported as “Income from banking activities” and “Expenses from banking activities” respectively.

Other companies outside the insurance business and factoring business

Operating income and expenses of companies not involved in the insurance or factoring businesses are reported under “Income from other activities” and “Expenses from other activities”, respectively.

Revenue

Consolidated revenue includes:

  • premiums, corresponding to the compensation of the Group’s commitment to cover the risks planned in their insurance policy: credit insurance (short term), Single Risk (medium term) and surety (medium term). The bond is not a credit insurance product because it represents a different risk nature (in terms of the underlying and the duration of the risk), but its remuneration takes the form of a premium; It responds to the definitions of insurance contracts given in IFRS 4;
  • other revenues which include:
    • revenue from services related to credit insurance contracts (“fee and commission income”), corresponding to debtors’ information services, credit limit monitoring, management and debt recovery. They are included in the calculation of the turnover of the credit insurance activity,
    • revenue from services which consist of providing customer access to credit and marketing information and debt collection services to clients without credit insurance contracts,
    • net income from banking activities are revenues from factoring entities. They consist mainly of factoring fees (collected for the management of factored receivables) and net financing fees (financing margin, corresponding to the amount of financial interest received from factoring customers, less interest paid on refinancing of the factoring debt). Premiums paid by factoring companies to insurance companies (in respect of debtor and ceding risk) are deducted from net banking income.

Consolidated revenue is analysed by country of invoicing (in the case of direct business, the country of invoicing is that in which the issuer of the invoice is located and for inward reinsurance, the country of invoicing is that in which the ceding insurer is located) and by business line (credit insurance, bonding, factoring, and information & other services).

Insurance operations
Earned premiums
Gross written premiums

Gross premiums correspond to written premiums, excluding tax and net of premium cancellations. They include an estimate of pipeline premiums and premiums to be cancelled after the reporting date.

The estimate of pipeline premiums includes premiums negotiated but not yet invoiced as well as premium adjustments corresponding to the difference between minimum and final premiums. It also includes a provision for future economic risks that may impact end-of-year premiums.

Premiums invoiced are primarily based on policyholders’ revenue or trade receivables balances, which vary according to changes in revenue. Premium income therefore depends directly on the volume of sales made in the countries where the Group is present, especially French exports and German domestic and export sales.

Premium refunds

Premium refunds include policyholders’ bonuses and rebates, gains and no claims bonus, mechanisms designed to return a part of the premium to a policyholder according to contract profitability. They also include the penalties, taking the form of an additional premium invoiced to policyholders with the loss attributed to the policy.

The “premium refunds” item includes provisions established through an estimation of rebates to be paid.

Reserves for unearned premiums

Reserves for unearned premiums are calculated separately for each policy, on an accruals basis. The amount charged to the provision corresponds to the fraction of written premiums relating to the period between the year-end and the end of the coverage period of the premium.

Gross earned premiums

Gross earned premiums consist of gross premiums issued, net of premium refunds, and variation in reserves for unearned premiums.

Deferred acquisition costs

Policy acquisition costs, including commissions are deferred over the life of the contracts concerned according to the same rules as unearned premium provisions.

The amount deferred corresponds to policy acquisition costs related to the period between the year-end and the next premium payment date. Deferred acquisition costs are included in the balance sheet under “Other assets”.

Changes in deferred acquisition costs are included under “Policy acquisition costs” in the income statement.

Contract service expenses
Paid claims

Paid claims correspond to insurance settlements net of recoveries, plus claims handling expenses.

Claims provisions

Claims provisions include provisions to cover the estimated total cost of reported claims not settled at the year-end. Claims provisions also include provisions for claims incurred but not yet reported, determined by reference to the final amount of paid claims.

The provisions also include a provision for collection costs and claims handling expenses.

Specific provisions are also recorded for major claims based on the probability of default and level of risk exposure, estimated on a case-by-case basis et validated by a committee (special reserves committee)

Concerning bonding business, provisions are recorded for claims of which the Company concerned has been notified by the closing period. However, an additional provision is recorded based on a reserving guideline. This guideline is set for the four most recent attaching years. Regarding prior attaching years, this guideline is applicable until the guarantee is over. Its principle is based on a high level of risk that the guarantee could be called due to the principal (guaranteed) becoming insolvent, even if no related bonds have been called on. This additional provision is calculated based on the probability of default and the level of risk exposure.

Subrogation and salvage

Subrogation and salvage represent estimated recoveries determined on the basis of the total amount expected to be recovered in respect of all open underwriting periods.

The subrogation and salvage includes a provision for debt collection costs.

Reinsurance operations

All of the Group’s inward and ceded reinsurance operations involve transfers of risks.

Inward reinsurance

Inward reinsurance is accounted for on a contract-by-contract basis using data provided by the ceding insurers.

Technical provisions are determined based on amounts reported by ceding insurers, adjusted upwards by Coface where appropriate.

Commissions paid to ceding insurers are deferred and recognised in the income statement on the same basis as reserves for unearned premiums. Where these commissions vary depending on the level of losses accepted, they are estimated at each period-end.

Ceded reinsurance

Ceded reinsurance is accounted for in accordance with the terms and conditions of the related treaties.

Reinsurers’ share of technical provisions is determined on the basis of technical provisions recorded under liabilities.

Funds received from reinsurers are reported under liabilities.

Commissions received from reinsurers are calculated by reference to written premiums. They are deferred and recognised in the income statement on the same basis as ceded reserves for unearned premiums (which are unearned premiums multiplied by reinsurance rate)

Other operating income and expenses

In accordance with Recommendation no. 2013-03 issued by the ANC (the French accounting standards setter), “Other operating income” and “Other operating expenses” should only be used to reflect a major event arising during the reporting period that could distort the understanding of the Company’s performance. Accordingly, limited use is made of this caption for unusual, abnormal and infrequent income and expenses of a material amount which Coface has decided to present separately in the income statement so that readers can better understand its recurring operating performance and to make a meaningful comparison between accounting periods, in accordance with the relevance principle set out in the IFRS Conceptual Framework.

Other operating income and expenses are therefore limited, clearly identified, non-recurring items which are material to the performance of the Group as a whole.

Goodwill

In accordance with the revised version of IFRS 3, the Group measures goodwill at the acquisition date as:

  • the fair value of the consideration transferred;
  • to which we add the amount of any non-controlling interest in the acquiree;
  • and, in a business combination achieved in stages, the acquisition-date fair value of the acquirer’s previously held equity interest in the acquiree;
  • less the net of the acquisition-date amounts of the identifiable assets acquired and the liabilities assumed (generally measured at fair value).

In the case of a bargain purchase, the resulting gain is recognised in net income on the acquisition date.

If new information comes to light within the 12 months following the initial consolidation of a newly-acquired company and that new information affects the initial fair values attributed to the assets acquired and liabilities assumed at the acquisition date, the fair values are adjusted with a corresponding increase or decrease in the gross value of goodwill.

Goodwill is allocated, at the acquisition date, to the cash-generating unit (CGU) or group of CGUs that is expected to derive benefits from the acquisition. In accordance with paragraph 10 of IAS 36, goodwill is not amortised but is tested for impairment at least once a year or whenever events or circumstances indicate that impairment losses may occur. Impairment testing consists of comparing the carrying amount of the CGU or group of CGUs (including allocated goodwill) with its recoverable amount, which corresponds to the higher of value in use and fair value less costs to sell. Value in use is determined using the discounted cash flow method.

Impairment tests on goodwill and intangible assets

In accordance with IAS 36, for the purpose of impairment testing the strategic entities included in the Group’s scope of consolidation are allocated to groups of CGUs.

A group of CGUs is the smallest identifiable group of assets that generates cash inflows that are largely independent of the cash inflows from other groups of assets (other CGUs). Paragraph 80 of IAS 36 stipulates that goodwill acquired in a business combination must, from the acquisition date, be allocated to each of the acquirer’s groups of CGUs that is expected to benefit from the synergies of the combination.

Coface has identified groups of CGUs, based on its internal organisation as used by management for making operating decisions.

The seven groups of CGUs are as follows:

  • Northern Europe;
  • Western Europe;
  • Central Europe;
  • Mediterranean & Africa;
  • North America;
  • Latin America;
  • Asia-Pacific.
Measuring groups of CGUs and performing goodwill impairment tests

Existing goodwill is allocated to a group of CGUs for the purpose of impairment testing. Goodwill is tested for impairment at least once a year or whenever there is an objective indication that it may be impaired.

Goodwill impairment tests are performed by testing the group of CGUs to which the goodwill has been allocated.

If the recoverable amount of the group of CGUs is less than its carrying amount, an impairment loss is recognised and allocated to reduce the carrying amount of the assets of the group of CGUs, in the following order:

  • first, by reducing the carrying amount of any goodwill allocated to the group of CGUs (which may not be subsequently reversed); and
  • then, the other assets of the group of CGUs pro rata to the carrying amount of each asset in the Group.

The recoverable amount is determined using the discounted cash flow method.

Method used for measuring the value of Coface entities
Value in use: Discounted cash flow method

Cash flow projections were derived from the three-year business plans drawn up by the Group’s operating entities as part of the budget process and approved by Coface Group management.

These projections are based on the past performance of each entity and take into account assumptions relating to Coface’s business line development. Coface draws up cash flow projections beyond the period covered in its business plans by extrapolating the cash flows over two additional years.

The assumptions used for growth rates, margins, cost ratios and claims ratios are based on the entity’s maturity, business history, market prospects, and geographic region.

Under the discounted cash flow method, Coface applies a discount rate to insurance companies and a perpetuity growth rate to measure the value of its companies.

Fair value

Under this approach, Coface values its companies by applying multiples of (i) revenue (for services companies), revalued net assets (for insurance companies) or net banking income (for factoring companies), and (ii) net income. The benchmark multiples are based on stock market comparables or recent transactions in order to correctly reflect the market values of the assets concerned.

The multiples-based valuation of an entity is determined by calculating the average valuation obtained using net income multiples and that obtained using multiples of revenue (in the case of services companies), revalued net assets (insurance companies) or net banking income (factoring companies).

Intangible assets

Coface capitalises development costs and amortises them over their estimated useful lives when it can demonstrate:

  • the technical feasibility of completing the intangible asset so that it will be available for use or sale;
  • its intention to complete the intangible asset and use or sell it;
  • its ability to use or sell the intangible asset;
  • how the intangible asset will generate probable future economic benefits;
  • the current and future availability of adequate resources to complete the development; and
  • its ability to reliably measure the expenditure attributable to the intangible asset during its development.

Internally generated software is amortised over its useful life, which is capped at 15 years.

Property, plant and equipment

Property, plant and equipment are measured using the amortised cost model. Coface applies this model to measure its property, plant and equipment, including buildings used in the business. IFRS requires the breakdown of these buildings into components where the economic benefits provided by one or more components of a building reflect a pattern that differs from that of the building as a whole. These components are depreciated over their own useful life.

Coface has identified the following components of property assets:

Land

Not depreciated

Enclosed/covered structure

Depreciated over 30 years

Technical equipment

Depreciated over 15 years

Interior fixtures and fittings

Depreciated over 10 years

Properties acquired under finance leases are included in assets and an obligation in the same amount is recorded under liabilities.

An impairment loss is recognised if the carrying amount of a building exceeds its market value.

Financial assets

Except factoring companies, the Group classifies the financial assets under IAS 39.

The Group classifies its financial assets into the following five categories: available-for-sale financial assets, financial assets held for trading, held-to-maturity investments, financial assets at fair value through income, and loans and receivables.

The date used by Coface for initially recognising a financial asset in its balance sheet corresponds to the asset’s trade date.

Available-for-sale financial assets (AFS)

Available-for-sale financial assets are carried at fair value plus transaction costs that are directly attributable to the acquisition (hereafter referred to as the purchase price). The difference between the fair value of the securities at year-end and their purchase price (less actuarial amortisation for debt instruments) is recorded under “Available-for-sale financial assets” with a corresponding adjustment to revaluation reserves (no impact on net income). Investments in non-consolidated companies are included in this category.

Financial assets held for trading

Financial assets held for trading are recorded at the fair value of the securities at year-end. Changes in fair value of securities held for trading during the accounting period are taken to the income statement.

Held-to-maturity investments (HTM)

Held-to-maturity investments are carried at amortised cost. Premiums and discounts are included in the calculation of amortised cost and are recognised over the useful life of the financial asset using the yield-to-maturity method.

Financial assets at fair value through profit or loss

Financial assets at fair value through income are accounted for in the same way as securities held for trading.

Loans and receivables

The “Loans and receivables” category includes cash deposits held by ceding insurers lodged as collateral for underwriting commitments. The amounts recognised in relation to these deposits corresponds to the cash amount actually deposited.

Non-derivative financial assets with fixed or determinable payments that are not quoted on an active market are also included in this caption. These assets are recognised at amortised cost using the effective interest method.

Loans and receivables also include short-term deposits whose maturity at the date of purchase or deposit is more than three months but less than 12 months.

Fair value

The fair value of listed securities is their market price at the measurement date. For unlisted securities fair value is determined using the discounted cash flow method.

Impairment test

Available-for-sale financial assets are tested for impairment at each period-end. When there is objective evidence that such an asset is impaired and a decline in the fair value of that asset has previously been recognised directly in equity, the cumulative loss is reclassified from equity to income through “Investment income, net of management expenses”.

A multi-criteria analysis is used to assess whether there is any objective indication of impairment. An independent expert is used for these analyses, particularly in the case of debt instruments.

Impairment indicators include the following:

  • for debt instruments: default on the payment of interest or principal, the existence of a mediation, alert or insolvency procedure, bankruptcy of a counterparty or any other indicator that reveals a significant decline in the counterparty’s financial position (such as evidence of losses to completion based on stress tests or projections of recoverable amounts using the discounted cash flow method);
  • for equity instruments (excluding investments in unlisted companies): indicators showing that the entity will be unable to recover all or part of its initial investment. In addition, an impairment test is systematically performed on securities that represent unrealised losses of over 30% or which have represented unrealised losses for a period of more than six consecutive months. This test consists of carrying out a qualitative analysis based on various factors such as an analysis of the equity instrument’s market price over a given period, or information relating to the issuer’s financial position. Where appropriate, an impairment loss is recognised based on the instrument’s market price at the period-end. Independently of this analysis, an impairment loss is systematically recognised when an instrument represents an unrealised loss of over 50% at the period-end, or has represented an unrealised loss for more than 24 months;
  • for investments in unlisted companies: an unrealised loss of over 20% over a period of more than 18 months, or the occurrence of significant changes in the technological, market, economic or legal environment that have an adverse effect on the issuer and indicate that the amount of the investment in the equity instrument will not be recovered.

If the fair value of an instrument classified as available-for-sale increases in a subsequent period, and the increase can be objectively related to an event occurring after the impairment loss was recognised in income, the impairment loss is reversed, with the amount of the reversal recognised in:

  • equity, for equity instruments;
  • income, for debt instruments, in an amount corresponding to the previously-recognised impairment loss.

In accordance with IFRIC 10, impairment losses recognised on equity instruments in an interim reporting period are not reversed from income until the securities concerned are divested.

Derivatives and hedging transactions

A derivative is a financial instrument (IAS 39):

  • whose value changes in response to the change in the interest rate or price of a product (known as the “underlying”);
  • that requires no or a very low initial net investment; and
  • that is settled at a future date.

A derivative is a contract between two parties – a buyer and a seller – under which future cash flows between the parties are based on the changes in the value of the underlying asset.

In accordance with IAS 39, derivatives are measured at fair value through income, except in the case of effective hedges, for which gains and losses are recognised depending on the underlying hedging relationship.

Derivatives that qualify for hedge accounting are derivatives which, from their inception and throughout the hedging relationship, meet the criteria set out in IAS 39. These notably include a requirement for entities to formally document and designate the hedging relationship, including information demonstrating that the hedging relationship is effective, based on prospective and retrospective tests. A hedge is deemed to be effective when changes in the actual value of the hedge fall within a range of 80% and 125% of the change in value of the hedged item.

  • For fair value hedges, gains or losses from remeasuring the hedging instrument at fair value are systematically recognised in income. These amounts are partially offset by symmetrical gains or losses on changes in the fair value of the hedged items, which are also recognised in income. The net impact on the income statement therefore solely corresponds to the ineffective portion of the hedge.
  • For cash flow hedges, the portion of the gain or loss on the hedging instrument that is determined to be an effective hedge is recognised directly in equity and the ineffective portion of the gain or loss on the hedging instrument is recognised in income.

Coface’s derivatives were used for hedging purposes, notably to hedge currency risks, interest rate risks and changes in fair value of equities in the portfolios of the “Colombes” funds. Coface does not carry out any hedging transactions within the meaning of IAS 39. The financial instruments that it does use are recognised at fair value through income.

Financing liabilities

This item mainly includes the subordinated debt.

Borrowings are initially recognised at fair value after taking account of directly-attributable transaction costs.

They are subsequently measured at amortised cost using the effective interest method. Amortised cost corresponds to:

  • the measurement of the financial liability on initial recognition; minus
  • repayments of principal; plus or minus
  • cumulative amortisation (calculated using the effective interest rate) and any discounts or premiums between the initial amount and the maturity amount.

Premiums and discounts are not included in the initial cost of the financial liability. However, they are included in the calculation of amortised cost and are recognised over the life of the financial liability using the yield-to-maturity method. As and when they are amortised, premiums and discounts impact the amortised cost of the financial liability.

Accounting treatment of debt issuance costs

Transaction costs directly attributable to the issuance of financial liabilities are included in the initial fair value of the liability. Transaction costs are defined as incremental costs directly attributable to the issuance of the financial liability, i.e., that would not have been incurred if the Group had not acquired, issued or disposed of the financial instrument.

Transaction costs include:

  • fees and commissions paid to agents, advisers, brokers and other intermediaries;
  • levies by regulatory agencies and securities exchanges;
  • and transfer taxes and duties.

Transaction costs do not include:

  • debt premiums or discounts;
  • financing costs;
  • internal administrative or holding costs.
Payables arising from banking sector activities

This item includes:

  • amounts due to banking sector companies: corresponds to bank credit lines. They represent the refinancing of the credit extended to factoring clients;
  • amounts due to customers of banking sector companies, corresponding to payables arising from factoring operations. They include:
    • amounts credited to factoring clients’ current accounts that have not been paid out in advance by the factor, and
    • factoring contract guarantee deposits;
  • debt securities. This item includes subordinated borrowings and non-subordinated bond issues. These borrowings are classified as “Payables arising from banking sector activities” as they are used for financing the factoring business line.

All borrowings are initially recognised at fair value less any directly attributable transaction costs. After initial recognition, they are measured at amortised cost using the effective interest method.

Receivables arising from factoring operations

Receivables arising from factoring operations represent total receivables not recovered at the reporting date. They are stated at nominal value, corresponding to the amount of factored invoices, including tax.

Two categories of provisions are recorded and are shown in deduction of the receivables:

  • provisions booked by way of a charge to the income statement (under “Cost of risk”) when it appears probable that all or part of the amount receivable will not be collected;
  • provisions evaluated through expected loss or “ECL” calculation also recorded as an expense in the income statement (under “cost of risk”).

The ECL calculation, introduced by IFRS 9, relies on calculation models using the internal ratings of debtors (“DRA” debtor risk assessment). The methodology for calculating depreciation (“ECL” expected credit loss) is based on the three main parameters: the probability of default “PD”, the loss given default “LGD” and the amount of exposure in case of default “EAD” (exposure at default). The depreciation will be the product of the PD by the LGD and the EAD, over the lifetime of the receivables. Specific adjustments are made to take into account the current conditions and the prospective macroeconomic projections (forward looking).

The net carrying amount of receivables arising from factoring operations is included in the consolidated balance sheet under “Receivables arising from banking and other activities”.

Cash and cash equivalents

Cash includes all bank accounts and demand deposits. Cash equivalents include units in money-market funds (SICAV) with maturities of less than three months.

Provisions for liabilities and charges

In accordance with IAS 37 “Provisions, Contingent Liabilities and Contingent Assets”, a provision is recorded at the reporting date if a present obligation towards a third party resulting from a past event exists at that date and it is probable or certain, as of the date when the financial statements are drawn up, that an outflow of resources embodying economic benefits to that third party will be required to settle the obligation and that a reliable estimate can be made of the amount of the obligation.

Provisions are discounted when the effect of the time value of money is material.

The provisions for liabilities and charges include the provisions for tax risks (except income tax risk), for litigations with third-parties and on the vacant premises. These provisions are reviewed at each closing.

The provision for vacant premises is calculated taking into account the future rents that the company committed to pay until the end of the lease, from which are deducted the future income expected from potential subleases.

Employee benefits

In some countries in which Coface operates, employees are awarded short-term benefits (such as paid leave), long-term benefits (including “long-service awards”) and post-employment benefits, such as statutory retirement benefits.

Short-term benefits are recognised as a liability in the accounts of the Coface companies that grant such benefits.

Other benefits, including long-term and post-employment benefits are subject to different coverage and are classified as follows:

  • defined contribution plans: consequently, the Company’s legal or constructive obligation is limited to the amount that it agrees to pay to the fund, whichh will pay due amounts to the employees. These plans are generally state pension plans, which is the case in France;
  • defined benefit plans, under which the employer has a legal or constructive obligation to provide agreed benefits to employees.

In accordance with IAS 19, Coface records a provision to cover its liability, regarding primarily:

  • statutory retirement benefits and termination benefits;
  • early retirement and supplementary pension payments;
  • employer contributions to post-employment health insurance schemes;
  • long-service awards.

Based on the regulations specific to the plan and country concerned, independent actuaries calculate:

  • the actuarial value of future benefits, corresponding to the present value of all benefits to be paid. The measurement of this present value is essentially based on:
    • demographic assumptions,
    • future benefit levels (statutory retirement benefits, long service awards, etc.),
    • the probability that the specified event will occur,
    • an evaluation of each of the factors included in the calculation of the benefits, such as future salary increases,
    • the interest rate used to discount future benefits at the measurement date;
  • the actuarial value of benefits related to service cost (including the impact of future salary increases), determined using the projected unit credit method which spreads the actuarial value of benefits evenly over the expected average remaining working lives of the employees participating in the plan.
Stock options

In accordance with IFRS 2 “Share-based Payment”, which defines the recognition and measurement rules concerning stock options, the options are measured at the grant date. The Group uses the Black and Scholes option pricing model for measuring stock options. Changes in fair value subsequent to the grant date do not impact their initial measurement.

The fair value of options takes into account their expected life, which the Group considers as corresponding to their compulsory holding period for tax purposes. This value is recorded in personnel costs on a straight-line basis from the grant date and over the vesting period of the options, with a corresponding adjustment directly in equity.

In connection with its stock market listing, the Coface Group awarded to certain beneficiaries (employees of COFACE SA subsidiaries) bonus shares (cf. Note 11).

In accordance with the IFRS 2 rules, only stock options granted under plans set up after November 7, 2002 and which had not vested at January 1, 2005 have been measured at fair value and recognised in personnel costs.

Leases

According to IFRS 16 “Leases”, applied since January 1, 2019, the definition of leasing contracts implies, on one hand, the identification of an asset and, on the other hand, the control by lessee of the right to use this asset. The control is established when the lessee has the two following rights during all the time of the use:

  • the right to have almost all economical benefits coming from the asset use;
  • the right to decide the use of the asset.

For the lessee, the standard imposes the accounting on the balance sheet of all leases as a right of use, registered in the tangible and intangible assets and in the liabilities, the accounting of a financial debt for rents and other payments to be made during the rental period. Coface uses the exemptions provided by the standard by not modifying the accounting treatment of short-term leases (less than 12 months) or relating to low-value underlying assets (less than US $5,000).

The right of use is amortized linearly and the financial debt is amortized actuarially over the duration of the lease. The interest expenses on the financial debt and the amortization expenses of the right to use will be made distinctly to the income statement.

Income tax

Income tax expense includes both current taxes and deferred taxes.

The tax expense is calculated on the basis of the latest known tax rules in force in each country where the results are taxable.

On January 1, 2015, COFACE SA opted for the tax integration regime by integrating French subsidiaries held directly or indirectly by more than 95% (Compagnie française d’assurance pour le commerce extérieure, Cofinpar, Cogeri and Fimipar).

Temporal differences between the values of assets and liabilities in the consolidated accounts, and those used to determine the taxable income, give rise to the recording of deferred taxes.

Deferred taxes are recorded by the liability method for temporary differences between the carrying amount of assets and liabilities at each period-end and their tax base.

Deferred tax assets and liabilities are calculated for all temporary differences, based on the tax rate that will be in force when the differences are expected to reverse, if this is known, or, failing that, at the tax rate in force at the period-end.

Deferred tax assets are recorded only when it is probable that sufficient taxable profits against which the asset can be utilised will be available within a reasonable time frame.

Receivables and payables denominated in foreign currencies

Receivables and payables denominated in foreign currencies are translated into euros at the year-end exchange rate.

Unrealised exchange gains and losses on receivables and payables denominated in foreign currencies are recorded in the consolidated income statement, except for those related to the technical provisions carried in the accounts of the subsidiaries of Compagnie française d’assurance pour le commerce extérieur (formerly COFACE SA) and those concerning consolidated companies’ long-term receivables and payables whose settlement is neither planned nor likely to occur in the foreseeable future.

Exchange differences concerning receivables and payables denominated in a foreign currency and relating to a consolidated company are treated as part of Coface’s net investment in that company. In accordance with IAS 21, these exchange differences are recorded in other comprehensive income until the disposal of the net investment.

Segment information

Coface applies IFRS 8 for segment information reporting, which requires an entity’s operating segments to be based on its internal organisation as used by management for the allocation of resources and the measurement of performance.

The segment information used by management corresponds to the following geographic regions:

  • Northern Europe;
  • Western Europe;
  • Central Europe;
  • Mediterranean & Africa;
  • North America;
  • Latin America;
  • Asia-Pacific.

No operating segments have been aggregated for the purposes of published segment information.

The Group’s geographic industry sector segmentation is based on the country of invoicing.

Related parties

A related party is a person or entity that is related to the entity preparing its financial statements (referred to in IAS 24 as “the reporting entity”).

Estimates

The main balance sheet items for which management is required to make estimates are presented in the table below:

Estimates

Notes

Type of information required

Goodwill impairment

1

Impairment is recognised when the recoverable amount of goodwill, defined as the higher of value in use and fair value, is below its carrying amount.

The value in use of cash-generating units is calculated based on cost of capital, long-term growth rate and loss ratio assumptions.

Provision on receivables on banking activity

4

Depreciation of receivables on banking activity includes provision evaluated through expected credit loss (ECL) (introduced by IFRS 9)

Provision for earned premiums not yet written

17

This provision is calculated based on the estimated amount of premiums expected in the period less premiums recognised.

Provision for premium refunds

17; 22

This provision is calculated based on the estimated amount of rebates and bonuses payable to policyholders in accordance with the terms and conditions of the policies written.

Provision for subrogation and salvage

17; 23

This provision is calculated based on the estimated amount potentially recovered on settled claims.

Claims reserves

17; 23; 42

It includes an estimate of the total cost of claims reported but not settled at year end.

IBNR provision

17; 23; 42

The IBNR provision is calculated on a statistical basis using an estimate of the final amount of claims that will be settled after the risk has been extinguished and after any action taken to recover amounts paid out.

Pension benefit obligations

14

Pension benefit obligations are measured in acordance with IAS 19 and annually reviewed by actuaries according to the Group’s actuarial assumptions.

The policies managed by the Coface Group’s insurance subsidiaries meet the definition of insurance contracts set out in IFRS 4. In accordance with this standard, these contracts give rise to the recognition of technical provisions on the liabilities side of the balance sheet, which are measured based on Group principles pending the implementation of IFRS 17 in 2023 that deals with insurance liabilities.

The recognition of technical provisions requires the Group to carry out estimates, which are primarily based on assumptions concerning changes in events and circumstances related to the insured and their debtors as well as to their economic, financial, social, regulatory and political environment. These assumptions may differ from actual events and circumstances, particularly if they simultaneously affect the Group’s main portfolios. The use of assumptions requires a high degree of judgement on the part of the Group, which may affect the level of provisions recognised and therefore have a material adverse effect on the Group’s financial position, results, and solvency margin.

For certain financial assets held by the Group there is no active market, there are no observable inputs, or the observable inputs available are not representative. In such cases the assets’ fair value is measured using valuation techniques which include methods or models that are based on assumptions or assessments requiring a high degree of judgement. The Group cannot guarantee that the fair value estimates obtained using these valuation techniques represent the price at which a security will ultimately be sold, or at which it could be sold at a given moment. The valuations and estimates are revised when circumstances change or when new information becomes available. Using this information, and respecting the objective principles and methods described in the consolidated and combined financial statements, the Group’s management bodies regularly analyse, assess and discuss the reasons for any decline in the estimated fair value of securities, the likelihood of their value recovering in the short term, and the amount of any ensuing impairment losses that should be recognised. It cannot be guaranteed that any impairment losses or additional provisions recognised will not have a material adverse effect on the Group’s results, financial position and solvency margin.

Note 1Goodwill

In accordance with IAS 36, goodwill is not amortised but is systematically tested for impairment at the year-end or whenever there is an impairment indicator.

Breakdown of goodwill by region:

(in thousands of euros)

Dec. 31, 2022

Dec. 31, 2021

Northern Europe

112,603

112,603

Western Europe

5,068

5,068

Central Europe

8,913

8,339

Mediterranean & Africa

22,868

23,374

North America

6,525

6,145

Latin America

(17)

(0)

Total

155,960

155,529

The change in goodwill increased of €431 thousand; this increase is due to the consolidation of Coface Baltics Services and also to the change in exchange rates.

Impairment testing methods

Goodwill and shares in subsidiaries were tested for impairment losses at December 31, 2022. Coface performed the tests by comparing the value in use of the groups of cash-generating units (CGU) to which goodwill was allocated with their carrying amounts.

The value in use corresponds to the present value of the future cash flows expected to be generated by an asset or a CGU. This value is determined using the discounted cash flows method, based on the three-year business plan drawn up by subsidiaries and validated by Management. Cash flows are extrapolated for an additional two years using target loss and cost ratios. Beyond this five-year period, the terminal value is calculated by projecting the final year cash flows to perpetuity.

The main assumptions used to estimate the value in use of the groups of CGUs are a long-term growth rate of 2.0% for all entities and the weighted average cost of capital.

The table below summarizes the key assumptions used for goodwill impairment testing at December 31, 2022:

(in millions of euros)

Northern Europe

Western
 Europe

Central
 Europe

Mediterranean and Africa

North
 America

Cost of capital

10.2%

10.2%

10.2%

10.2%

10.2%

Perpetual growth rate

2.0%

2.0%

2.0%

2.0%

2.0%

Contribution to consolidated net assets

481.2

521.5

104.6

337.1

94.9

The assumptions used in December 2021 were:

(in millions of euros)

Northern Europe

Western
 Europe

Central
 Europe

Mediterranean and Africa

North 
America

Cost of capital

11.1%

11.1%

11.1%

11.1%

11.1%

Perpetual growth rate

1.5%

1.5%

1.5%

1.5%

1.5%

Contribution to consolidated net assets

583.4

473.7

207.7

321.4

71.0

Sensitivity analysis on valuations

Sensitivity analysis were performed on the valuations established for impairment testing. The following factors have been used:

  • long-term growth rate sensitivity: the impairment tests were stressed for a 0.5-point decrease in the perpetual growth rate applied. The analysis showed that such a 0.5-point decrease would not have any impact on the outcome of the impairment tests and therefore on the Group’s consolidated financial statements for the semester ended December 31, 2022;
  • cost of capital sensitivity: the impairment tests were stressed for a 0.5-point increase in the cost of capital applied. The analysis showed that such a 0.5-point increase would not have any impact on the outcome of the impairment tests and therefore on the Group’s consolidated financial statements for the semester ended December 31, 2022;
  • cost and loss ratios sensitivities for the last two years of the business plan (2026 and 2027): The analysis showed that such a 1 at 2-point decrease would not have any impact on the outcome of the impairment tests and therefore on the Group’s consolidated financial statements for the semester ended December 31, 2022.

CGUs valuations sensitivity to selected assumptions is shown in the following table:

Outcome of impairment tests

(in millions of euros)

Northern Europe

Western
 Europe

Central
 Europe

Mediterranean and Africa

North
 America

Contribution to consolidated net assets (1)

481.2

521.5

104.6

337.1

94.9

Value in use of CGU

988.0

1,066.0

380.9

831.4

172.5

Sensitivity: Long-term growth rate -0.5 point (2)

958.4

1,025.5

365.9

801.2

102.9

Sensitivity: WACC +0.5 point (2)

946.3

1,012.8

361.9

790.8

101.5

Sensitivity: Loss/Cost Ratio 2027 +1 point (2)

969.5

1,036.4

393.1

800.6

102.6

Sensitivity: Loss/Cost Ratio 2027 +2 points (2)

950.9

944.8

381.7

769.8

97.9

  • The contribution to the consolidated Group’s net assets corresponds to the book value.
  • Sensitivity analysis were performed on the value in use of each CGU.
Note 2Other intangible assets

(in thousands of euros)

Dec. 31, 2022

Dec. 31, 2021

Net value

Net value

Development costs and software

79,998

71,648

Purchased goodwill

2,480

2,529

Other intangible assets

397

246

Total

82,876

74,423

(in thousands of euros)


Dec. 31, 2022


Gross amount

Amortisation and impairment

Net value

Development costs and software

260,160

(180,162)

79,998

Purchased goodwill

4,119

(1,639)

2,480

Other intangible assets

2,816

(2,419)

397

Total

267,095

(184,219)

82,876

(in thousands of euros)


Dec. 31, 2021


Gross amount

Amortisation and impairment

Net value

Development costs and software

236,507

(164,859)

71,648

Purchased goodwill

4,072

(1,543)

2,529

Other intangible assets

2,930

(2,684)

246

Total

243,509

(169,086)

74,423

The Group’s intangible assets consist mainly of development costs (on several IT projects).

These investments amounted to €22.2 million in 2022 financial year compared to €14.4 million in 2021 financial year.

Change in the gross amount of intangible assets

(in thousands of euros)

Dec. 31, 2021

Scope entry

Increases

Decreases

Curency translation variation

Dec. 31, 2022

Development costs and software

236,507

1

25,627

(233)

(1,742)

260,160

Purchased goodwill

4,072

(0)

(0)

(0)

47

4,119

Other intangible assets

2,930

(0)

50

(5)

(158)

2,816

Total

243,509

1

25,677

(238)

(1853)

267,095

(in thousands of euros)

Dec. 31, 2020

Scope entry

Increases

Decreases

Curency translation variation

Dec. 31, 2021

Development costs and software

22,6421

9

11,460

(3,900)

2,517

236,507

Purchased goodwill

3,680

(0)

(0)

(0)

392

4,072

Other intangible assets

2,944

(0)

20

(14)

(21)

2,930

Total

23,3045

9

11,480

(3,914)

2,888

243,509

Change in accumulated amortisation and impairment of intangible assets

(in thousands of euros)

Dec. 31, 2021

Scope entry

Additions

Reversals

Curency translation variation and other

Dec. 31, 2022

Accumulated amortization – development costs and software

(164,707)

(1)

(16,816)

176

1,330

(180,017)

Accumulated impairment – development costs and software

(150)

(0)

(0)

(0)

7

(143)

Total amortisation and impairment – development costs and software

(164,859)

(1)

(16,816)

176

1,337

(180,160)

Accumulated amortization – purchased goodwill

(1543)

-

59

(59)

(94)

(1,639)

Accumulated impairment – purchased goodwill

0

-

(0)

(0)

(0)

(0)

Total amortization and impairment – purchased goodwill

(1,543)

0

59

(59)

(94)

(1,639)

Accumulated amortization – other intangible assets

(2,683)

-

(99)

4

359

(2419)

Accumulated impairment – other intangible assets

0

-

(0)

(0)

(0)

(0)

Total amortization and impairment – other intangible assets

(2,684)

(0)

(99)

4

359

(2,419)

Total

(169,086)

(1)

(16,856)

121

1602

(184,219)

Note 3Insurance business investments
3.1Analysis by category

At December 31, 2022, the carrying amount of available-for-sale (AFS) securities amounted to €2,902,405 thousand, securities held for trading (“trading securities”) came to €26 thousand and held-to-maturity (HTM) securities was €1,842 thousand.

As an insurance group, Coface’s investment allocation is heavily weighted towards fixed-income instruments, guaranteeing it recurring and stable income.

The distribution of the bonds portfolio by rating at December 31, 2022 was as follows:

  • bonds rated “AAA”: 13.5%;
  • bonds rated “AA” and “A”: 49,8%;
  • bonds rated “BBB”: 32,1%;
  • bonds rated “BB” and lower: 4,7%.

(in thousands of euros)

December 31, 2022

Dec 31, 2021

Amortized cost

Revalu-
ation

Net value

Fair value

Unrealized gains and losses

Amortized cost

Revalu-
ation

Net value

Fair value

Unrealized gains and losses

AFS securities

2,985,841

(83,436)

2,902,405

2,902,405


2,876,416

238,738

3,115,154

3,115,154


Equities and other variable-income securities

105,390

64,703

170,093

170,093


191,074

194,077

385,151

385,151


Bonds and government securities

2,669,385

(156,815)

2,512,570

2,512,570


2,489,251

28,029

2,517,280

2,517,280


o/w direct investments in securities

2,421,341

(158,218)

2,263,122

2,263,122


2,087,552

25,285

2,112,837

2,112,837


o/w investments in UCITS

248,044

1,403

249,447

249,447


401,699

2,745

404,444

404,444


Shares in non-trading property companies

211,066

8,676

219,742

219,742


196,091

16,633

212,724

212,724


HTM securities


Bonds

1,842


1,842

2,015

173

1,833


1,833

2,421

588

Fair value through income – trading securities


Money market funds (UCITS)

26

0

26

26


15


15

15


Derivatives (positive fair value)

0

10,330

10,330

10,330


10,458

10,458

10,458


(derivatives negative fair value for information)


(222)

(222)

(222)


(3,480)

(3,480)

(3,480)


Loans and receivables

106,914


106,914

106,914


91,683


91,683

91,683


Investment property

695

(407)

288

288


695

(407)

288

288


Total

3,095,319

(73,514)

3,021,805

3,021,978

173

2,970,642

248,788

3,219,430

3,220,019

588

(in thousands of euros)

Gross

Dec. 31, 2022

Impairment

Net

Dec. 31, 2022

Net Dec. 31, 2021

AFS securities

2,940,981

(38,575)

2,902,405

3,115,154

Equities and other variable-income securities

202,695

(32,602)

170,093

385,151

Bonds and government securities

2,512,570


2,512,570

2,517,280

o/w direct investments in securities

2,263,122


2,263,122

2,112,837

o/w investments in UCITS

249,447


249,447

404,444

Shares in non-trading property companies

225,716

(5,974)

219,742

212,724

HTM securities


Bond

1,842


1,842

1,833

Fair value through income – trading securities


Money market funds (UCITS)

26


26

15

Derivatives (positive fair value)

10,330


10,330

10,458

(for information, derivatives with a negative fair value)

(222)


(222)

(3,480)

Loans and receivables

106,914


106,914

91,683

Investment property

288


288

288

Total

3,060,381

(38,575)

3,021,805

3,219,430

Impairments

(in thousands of euros)

Dec. 31, 2021

Additions

Reversals

Exchange rate effects and other

Dec. 31, 2022

AFS securities

38,187

730

(320)

(21)

38,575

Equities and other variable-income securities

32,432

510

(320)

(21)

32,602

Bonds and government securities

(0)

(0)

(0)

(0)

(0)

Shares in non-trading property companies

5,754

220

0

0

5,974

Loans and receivables

0

0

0

0

0

Total

38,187

730

(320)

(21)

38,575

Impairment of AFS securities is reversed when the securities are sold.

Change in investments by category


Dec. 31, 2021

Dec 31, 2022

(in thousands of euros)

Carrying amount

Increases

Decreases

Revaluation

Impairment

Other movements

Carrying amount

AFS securities

3,115,154

1,461,272

(1,369,196)

(323,257)

(410)

18,841

2,902,405

Equities and other variable-income securities

385,151

27,322

(113,154)

(131,422)

(190)

2,385

170,093

Bonds and government securities

2,517,280

1,402,171

(1,239,457)

(183,878)


16,456

2,512,570

Shares in non-trading property companies

212,724

31,779

(16,585)

(7,957)

(220)


219,742

HTM securities


Bonds

1,833

10


1,842

Fair value through income – trading securities

15

10


2

26

Loans, receivables and other financial investments

102,430

89,641

(74,397)


(140)

117,532

Total

3,219,430

1,550,933

(1,443,592)

(323,257)

(410)

18,705

3,021,805

The line Fair value though income – trading securities refers to monetary UCITS.

Derivatives

The structural use of derivatives is strictly limited to hedging. The nominal value of the hedge is thus limited to the amount of underlying assets held in the portfolio.

During 2022, most of the transactions carried out concerned systematic currency hedging via the conclusion of swaps or forward currency transactions for bonds issued mainly in USD and present in the investment portfolio.

Investments in equities were subject to systematic partial hedging through purchases of put options. The hedging strategy applied by the Group was aimed at protecting the portfolio against a sharp drop in the equities market in the euro zone. Portfolio equities being nowadays registered as OCI NR in accounting terms, this hedging strategy was cancelled and closed at the beginning of December.

Regarding the bond portfolio, ad hoc interest rate hedges were set up in 2022 by certain managers, in order to hedge the interest rate risk. A few ad hoc interest rate risk hedging operations have been implemented on negotiable debt securities in the monetary portfolio.

None of these transactions qualified for hedge accounting under IFRS as they were mainly currency transactions and partial market hedges.

3.2Financial instruments recognised at fair value

The fair values of financial instruments recorded in the balance sheet are measured according to a hierarchy that categorises into three levels the inputs used to measure fair value. These levels are as follows:

Level 1: Quoted prices in active markets for an identical financial instrument.

Securities classified as level 1 represent 82% of the Group’s portfolio. They correspond to:

  • equities, bonds and government securities listed on organized markets, as well as units in dedicated mutual funds whose net asset value is calculated and published on a very regular basis and is readily available (AFS securities);
  • government bonds and bonds indexed to variable interest rates (HTM securities);
  • French units in money-market funds, SICAV (trading securities).

Level 2: Use of inputs, other than quoted prices for an identical instrument that are directly or indirectly observable in the market (inputs corroborated by the market such as yield curves, swap rates, multiples method, etc.).

Securities classified as level 2 represent 8% of the Group’s portfolio. This level is used for the following instruments:

  • unlisted equities;
  • loans and receivables due from banks or clients and whose fair value is determined using the historical cost method.

Level 3: Valuation techniques based on unobservable inputs such as projections or internal data.

Securities classified as level 3 represent 10% of the Group’s portfolio. This level corresponds to unlisted equities, investment securities and units in dedicated mutual funds, as well as investment property.

Breakdown of financial instrument fair value measurements as at December 31, 2022 by level in the fair value hierarchy

(in thousands of euros)

Carrying amount

Fair value

Level 1

Level 2

Level 3

Fair value determined based on quoted prices in active markets

Fair value determined based on valuation techniques that use observable inputs

Fair value determined based on valuation techniques that use unobservable inputs

AFS securities

2,902,405

2,902,406

2,472,167

119,378

310,859

Equities and other variable-income securities

170,093

170,093

78,951

23

91,117

Bonds and government securities

2,512,570

2,512,570

2,393,216

119,355

0

Shares in non-trading property companies

219,742

219,742


219,742

HTM securities


Bonds

1,842

2,015

2,015


Fair value through income – trading securities


Money market funds (UCITS)

26

26

26


Derivatives

10,330

10,330

1,043

9,177

109

Loans and receivables

106,914

106,914


106,914


Investment property

288

288


288

Total

3,021,805

3,021,978

2,475,252

235,469

311,256

Movements in Level 3 securities as at December 31, 2022

(in thousands of euros)

At Dec. 31, 2021

Gains and losses recognized in the period

Transactions
 for the period

Changes in
 scope of consolidation

Exchange rate effects

At Dec. 31, 2022

In income

Directly in equity

Purchases/
Issues

Sales/
Redemp-
tions

Other movements

AFS securities

370,761

(730)

(74,617)

40,275

(27,154)

0

62

2,264

310,859

Equities and other variable-income securities

158,036

(510)

(66,661)

8,495

(10,570)

0

62

2,264

91,117

Shares in non-trading property companies

212,724

(220)

(7,957)

31,779

(16,585)

0


0

219,742

Derivatives

109


0


0

109

Investment property

288

0

0


(993)

993


288

Total

371,159

(730)

(74,617)

40,275

(28,147)

993

62

2,264

311,256

Breakdown of financial instrument fair value measurements as at December 31, 2021 by level in the fair value hierarchy

(in thousands of euros)

Carrying amount

Fair value

Level 1

Level 2

Level 3

Fair value determined based on quoted prices in active markets

Fair value determined based on valuation techniques that use observable inputs

Fair value determined based on valuation techniques that use unobservable inputs

AFS securities

3,115,154

3,115,154

2,613,799

130,593

370,761

Equities and other variable-income securities

385,151

385,151

227,091

23

158,036

Bonds and government securities

2,517,280

2,517,280

2,386,710

130,570

0

Shares in non-trading property companies

212,724

212,724


212,724

HTM securities


Bonds

1,833

2,421

2,421


JVO – Trading


OPCVM monétaires

15

15

15


Derivatives

10,458

10,458

9,876

473

109

Loans and receivables

91,683

91,683


91,683


Investment property

288

288


288

Total

3,219,430

3,220,019

2,626,111

222,749

371,158

Movements in Level 3 securities as at December 31, 2021

(in thousands of euros)

At Dec. 31, 2020

Gains and losses recognized in the period

Transactions
 for the period

Changes in
 scope of consolidation

Exchange rate effects

At Dec. 31, 2021

In income

Directly in equity

Purchases/
Issues

Sales/
Redemptions

AFS securities

386,055

(1,368)

9,995

2,385

(26,842)

(613)

1,149

370,761

Equities and other variable-income securities

155,775

(222)

4,516

2,385

(4,954)

(613)

1,149

158,036

Shares in non-trading property companies

230,280

(1,146)

5,478

0

(21,888)


0

212,724

Derivatives

109


0


0

109

Investment property

288


0


288

Total

386,452

(1,368)

9,995

2,385

(26,842)

(613)

1,149

371,159

SPPI Financial assets at December 31, 2022 (IFRS 9)

(in thousands of euros)

Fair value

Fair value variation

Direct investments in securities – SPPI financial assets

2,241,059

(218,255)

Direct investments in securities – No SPPI financial assets

22,064

(3,385)

Direct investments in securities

2,263,122

(221,640)

Loans and receivables – SPPI financial assets

106,839


Loans and receivables

106,914

0

Cash and cash equivalents – SPPI financial assets

553,786


Cash and cash equivalents

461,720

0

SPPI financial assets

2,901,684

(218,255)

No SPPI financial assets

22,064

(3,385)

Total

2,923,748

(221,640)

(in thousands of euros)

Gross value

Fair value

SPPI financial assets without a low credit risk

42,321

38,152

Note 4Receivables arising from banking activities
Breakdown by nature

(in thousands of euros)

Dec. 31, 2022

Dec. 31, 2021

Receivables arising from banking sector

2,906,639

2,690,125

Non-performing receivables arising from banking sector

28,189

34,440

Allowances for receivables arising from banking sector

(28,189)

(34,440)

Total

2,906,639

2,690,125

Breakdown by age

Receivables arising from banking and other activities represent receivables acquired within the scope of factoring agreements.

They are recognised at cost within assets in the balance sheet and they are classified as level 1. Factoring receivables include both receivables whose future recovery is guaranteed by Coface and receivables for which the risk of future recovery is borne by the customer.

When applicable, the Group recognises a valuation allowance against receivables to take account of any potential difficulties in their future recovery, being specified that the receivables are also covered by a credit insurance agreement. Accordingly, the related risks are covered by claims provisions.

(in thousands of euros)

Dec. 31, 2022

Due

Not Due

-3 months

3 months to 1 Year

1 to 5 years

+5 years

Total

Receivables arising from banking and other activities

2,669,804

226,821

10,655

0

0

2,907,279

Non-performing receivables arising from banking and other activities

0

0

2,328

23,396

2,465

28,189

Allowances for receivables arising from banking and other activities

0

0

(2,328)

(23,396)

(2,465)

(28,189)

Total receivables arising from banking and other activities

2,669,804

226,821

10,655

0

0

2,907,279

Claims reserve as hedge for factoring receivables

(640)

0

0

0

0

(640)

Total receivables arising from banking and other activities after claims reserves

2,669,164

226,821

10,655

0

0

2,906,639

(in thousands of euros)

Dec. 31, 2021

Due

Not Due

-3 months

3 months to 1 Year

1 to 5 years

+5 years

Total

Receivables arising from banking and other activities

2,235,811

453,181

587

1,194

34

2,690,808

Non-performing receivables arising from banking and other activities

0

0

1,134

22,794

10,513

34,440

Allowances for receivables arising from banking and other activities

0

0

(1,134)

(22,794)

(10,513)

(34,440)

Total receivables arising from banking and other activities

2,235,811

453,181

587

1,194

34

2,690,808

Claims reserve as hedge for factoring receivables

(683)

0

0

0

0

(683)

Total receivables arising from banking and other activities after claims reserves

2,235,811

453,181

587

1,194

34

2,690,125

Note 5Investments in associates

At December 31, 2022, there is no investment in associated companies.

Note 6Tangible assets

(in thousands of euros)

Dec. 31, 2022

Dec. 31, 2021

Net value

Net value

Buildings used for operational purposes

15,677

19,542

Other property, plant and equipment

14,781

14,869

Right-of-use assets for lessees

64,154

71,398

Total

94,613

105,809

(in thousands of euros)

Dec. 31, 2022

Gross amount

Amortisation and impairment

Net value

Buildings used for operational purposes

82,984

(67,306)

15,677

Other property, plant and equipment

50,692

(35,911)

14,781

Right-of-use assets for lessees

137,657

(73,503)

64,154

Total

271,333

(176,720)

94,613

(in thousands of euros)


Dec. 31, 2021


Gross amount

Amortisation and impairment

Net value

Buildings used for operational purposes

85,281

(65,738)

19,542

Other property, plant and equipment

48,184

(33,315)

14,869

Right-of-use assets for lessees

125,797

(54,399)

71,398

Total

259,262

(153,452)

105,809

Change in the gross amount of property, plant and equipment

(in thousands of euros)

Dec. 31, 2021

Scope entry

Increases

Decreases

Currency translation variation and other

Dec. 31, 2022

Land used for operational purposes

7,140

(0)

(0)

(0)

(0)

7,140

Buildings used for operational purposes

78,141

(0)

(0)

(1,261)

(1,035)

75,844

Total buildings used for operational purposes

85,281

(0)

(0)

(1,261)

(1,035)

82,984

Operating guarantees and deposits

3,749

(0)

409

(282)

(351)

3,525

Other property, plant & equipment

44,436

116

4,301

(1,282)

(403)

47,168

Total tangilbe assets

48,184

116

4,710

(1,564)

(754)

50,692

Right-of-use assets for lessees – Equipment leasing

27,445

126

4,931

(0)

(252)

32,251

Right-of-use assets for lessees – Buildings leasing

98,352

136

6,857

(0)

62

105,406

Total Right-of-use

125,797

262

11,788

(0)

(190)

137,657

Total

259,262

378

16,498

(2,825)

(1,979)

271,333

(in thousands of euros)

Dec. 31, 2020

Scope entry

Increases

Decreases

Currency translation variation and other

Dec. 31, 2021

Land used for operational purposes

7,140

(0)

(0)

(0)

(0)

7,140

Buildings used for operational purposes

78,141

(0)

(0)

(0)

(0)

78,141

Right-of-use assets for lessees – Buildings leasing

92,588

501

4,341

(464)

1,386

98,352

Total buildings used for operational purposes

177,869

501

4,341

(464)

1,386

183,633

Operating guarantees and deposits

3,668

(0)

38

(20)

63

3,749

Other property, plant and equipment

45,665

331

4,209

(5,970)

201

44,436

Right-of-use assets for lessees – Equipment leasing

20,742

212

6,360

(6)

137

27,445

Total other property, plant and equipment

70,075

543

10,607

(5,996)

401

75,629

Total

247,943

1,044

14,948

(6,460)

1,787

259,262

Change in accumulated depreciation and impairment of property, plant and equipment

(in thousands of euros)

Dec. 31, 2021

Scope entry

Additions

Reversals

Currency translation variation and other

Dec. 31, 2022

Accumulated amortization – Building used for operational purposes

(65,738)

(0)

(1,679)

69

42

(67,306)

Accumulated impairment – Buildings used for operational purposes

(0)

(0)

(0)

(0)

(0)

(0)

Total buildings used for operational purposes

(65,737)

(0)

(1,679)

69

42

(67,306)

Accumulated amortization other property, plant & equipment

(33,127)

(80)

(3,562)

575

283

(35,911)

Accumulated impairment other property, plant & equipment

(188)

(0)

(0)

(0)

188

0

Total tangilbe assets

(33,315)

(80)

(3,562)

575

471

(35,911)

Accumulated amortization – Right-of-use assets for lessees – Equipment leasing

(17,032)

(27)

(6,107)

(142)

164

(23,144)

Accumulated amortization – Right-of-use assets for lessees – Buildings leasing

(37,366)

(2)

(12,552)

(542)

103

(50,359)

Accumulated impairment – Right-of-use assets for lessees – Equipment leasing


(0)

(0)

(0)

(0)

(0)

Total Right-of-use

(54,399)

(29)

(18,659)

(684)

267

(73,503)

Total

(153,451)

(109)

(23,900)

(40)

780

(176,720)

(in thousands of euros)

Dec. 31, 2020

Scope entry

Additions

Reversals

Currency translation variation and other

Dec. 31, 2021

Accumulated amortization – Building used for operational purposes

(64,085)

(0)

(1,653)

(0)

(0)

(65,738)

Accumulated impairment – Right-of-use assets for lessees – Buildings leasing

(24,632)

(193)

(12,164)

25

(402)

(37,366)

Buildings used for operational purposes

(88,717)

(193)

(13,817)

25

(402)

(103,105)

Accumulated amortization other property, plant & equipment

(35,135)

(175)

(3,454)

5,782

(146)

(33,127)

Accumulated impairment other property, plant & equipment

(157)

(0)

(30)

(0)

(1)

(188)

Accumulated amortization – Right-of-use assets for lessees – Equipment leasing

(11,170)

(72)

(5,703)

6

(93)

(17,032)

Other property, plant and equipment

(46,462)

(247)

(9,187)

5,788

(240)

(50,347)

Total

(135,179)

(440)

(23,004)

5,813

(642)

(153,452)

Market value of buildings used in the business

(in thousands of euros)

Dec. 31, 2022

Dec. 31, 2021

Carrying amount

15,677

19,542

Market value

68,678

73,332

Unrealised gains

53,001

53,790

Buildings held by Coface Group do not represent any unrealised losses; no impairment is therefore recorded at December 31, 2022.

Note 7Receivables arising from insurance and reinsurance operations
Breakdown by nature

(in thousands of euros)

Dec. 31, 2022

Dec. 31, 2021

Gross

Provision

Net

Gross

Provision

Net

Receivables from policyholders and agents

345,234

(37,310)

307,924

306,927

(37,472)

269,455

Earned premiums not written

131,947


131,947

116,894


116,894

Receivables arising from reinsurance operations, net

224,810

(221)

224,589

124,910

(221)

124,689

Total

701,991

(37,531)

664,460

548,731

(37,693)

511,038

Breakdown by age

(in thousands of euros)

Dec. 31, 2022

Due

Not due

-3 months

3 months
 to 1 year

1 to5 years

+5 years

Total

Total receivables arising from insurance and reinsurance operations

356,764

160,411

114,682

28,981

3,623

664,460

(in thousands of euros)

Dec. 31, 2021

Due

Not due

-3 months

3 months
 to 1 year

1 to 5 years

+5 years

Total

Total receivables arising from insurance and reinsurance operations

373,406

79,808

48,025

9,313

487

511,038

The risk of liquidity linked to insurance receivables is considered to be marginal as:

  • the insurance business operates on a reverse production cycle: premiums are earned before claims are paid out;
  • furthermore, Coface primarily bills its clients on a monthly or quarterly basis, which allows it to recognise its receivables with a short-term maturity of less than or equal to three months.
Note 8Other assets

(in thousands of euros)

Dec. 31, 2022

Dec. 31, 2021

Variation

Deferred acquisition costs

46,427

38,900

7,527

Trade receivables arising from other activities

50,062

59,489

(9,427)

Current tax receivables

66,612

75,682

(9,070)

Other receivables

209,736

175,609

34,127

Total

372,838

349,679

23,159

The line “Other receivables” mainly includes:

  • receivables in factoring entities towards credit-insurance entities for €26 million;
  • loans granted to non-consolidated Coface entities for €26 million.
Note 9Cash and cash equivalents

(in thousands of euros)

Dec. 31, 2022

Dec. 31, 2021

Cash at bank and available

519,434

345,061

Cash equivalents

34,353

17,381

Total

553,786

362,441

The increase in cash and cash equivalents is linked to the switch to IFRS 9 for financial investments: in order to allow for an optimal switch, the investment falls and new investments were not made at the end of the year.

These amounts are all available; no amounts are placed in escrow accounts

Note 10Share capital

Ordinary shares

Number of shares

Per value

Share capital
 (in €)

At December 31, 2021

150,179,792

2

300,359,584

Cancellation of shares

(0)

2

(0)

At December 31, 2022

150,179,792

2

300,359,584

Treasury shares deducted

(1,116,118)

2

(2,232,236)

At December 31, 2022 (excluding treasury shares)

149,063,674

2

298,127,348

Shareholders

Dec. 31, 2022

Dec. 31, 2021

Number of shares

%

Number of shares

%

Natixis

(0)

0.00%

15,078,051

10.12%

Arch Capital Group Ltd

44,849,425

30.09%

44,849,425

30.09%

Public

104,214,249

69.91%

89,104,806

59.79%

Total excluding treasury shares

149,063,674

100%

149,032,282

100%

On January 6, 2022, Natixis sold its remaining stake in COFACE SA. This sale represented 10.12% of the share capital excluding treasury shares.

Note 11Share-based payments
Ongoing free share plans

Coface Group awarded, since its stock market listing in 2014, free shares to certain beneficiaries (corporate officers and employees of COFACE SA subsidiaries).

Plan

Allocation date

Number of shares granted

Acquisition period

Acquisition date

Availability date

Fair value of the share at the allocation date

Net expense for the year (in €k)

Long-Term Incentive Plan 2019

Feb. 11, 2019

368,548

3 years

Feb. 14, 2022

Feb. 14, 2022

7.9

122

Long-Term Incentive Plan 2020

Feb. 05, 2020

312,200

3 years

Feb. 06, 2023

Feb. 06, 2023

11.4

950

Long-Term Incentive Plan 2021

Feb. 10, 2021

408,403

3 years

Feb. 12, 2024

Feb. 12, 2024

8.6

912

Long-Term Incentive Plan 2022

Feb. 05, 2022

320,849

3 years

Feb. 15, 2025

Feb. 15, 2025

11.7

913

Change in the number of free shares

Plan

Number of free shares 
at Dec. 31, 2021

Number of new free share grants in 2022

Number of free shares cancelled in 2022

Number of free shares acquired in 2022

Number of shares to be acquired at Dec. 31, 2022

Long-Term Incentive Plan 2019

359,868


(359,868)

(0)

Long-Term Incentive Plan 2020

309,650


(10,259)


299,391

Long-Term Incentive Plan 2021

403,403


(10,000)


393,403

Long-Term Incentive Plan 2022


320,849


320,849

The total number of shares allocated to the Long-Term Incentive Plan 2022 amounts to 425,966 shares; only 405,105 shares were affected nominatively to beneficiaries including 320,849 shares and 84,256 performance units.

The free shares allocated under the LTIP 2019 plan were delivered to the beneficiaries.

Performance units are awarded instead of free shares as soon as the free shares implementation appears complex or irrelevant in terms of the number of beneficiaries. These units are indexed on the share price and subject to the same conditions of presence and performance that shares free but are valued and paid in cash at the end of the vesting period.

Free shares under the Long-Term Incentive Plan are definitely granted based upon presence in the Group and performance achievement.

Measurement of free shares

In accordance with IFRS 2 relating to “Share-based payments”, the award of free shares to employees results in the recognition of an expense corresponding to the fair value of shares granted on the award date adjusted for unpaid dividends during the rights vesting period and transfer restrictions during the holding period, as well as the probability of the materialisation of the performance conditions.

The plans were measured on the assumptions below:

  • discount rate corresponding to a risk-free rate on the plans’ duration;
  • income distribution rate set at 60%;

Based on these assumptions, a total of €2,897 thousand was expensed under the implemented plans at December 31, 2022.

Note 12Revaluation reserves

(in thousands of euros)

Investment instruments

Reserves – gains and losses not reclassifiable to income statement

Income tax

Revaluation reserves attributable to owners of the parent

Non-
controlling interests

Revaluation reserves

At January 1, 2022

250,291

(30,652)

(29,399)

190,240

(115)

190,125

Fair value adjustments on available-for-sale financial assets reclassified to income

(12,861)


3,629

(9,232)

(0)

(9,232)

Fair value adjustments on available-for-sale financial assets recognised in equity

(310,306)


54,623

(255,683)

(32)

(255,715)

Change in reserves – gains and losses not reclassificable to income statement (IAS 19R)


13,015

(3,705)

9,310

(0)

9,310

Transactions with shareholders

1


(0)

1

(1)

(0)

At December 31, 2022

(72,875)

(17,637)

25,148

(65,364)

(148)

(65,512)

(in thousands of euros)

Investment instruments

Reserves – gains and losses not reclassifiable to income statement

Income tax

Revaluation reserves attributable to owners of the parent

Non-
controlling interests

Revaluation reserves

At January 1, 2021

235,988

(33,000)

(24,621)

178,367

(116)

178,251

Fair value adjustments on available-for-sale financial assets reclassified to income

(9,184)


1,821

(7,363)

(0)

(7,363)

Fair value adjustments on available-for-sale financial assets recognised in equity

23,487


(5,873)

17,614

1

17,615

Change in reserves – gains and losses not reclassificable to income statement (IAS 19R)


2,348

(726)

1,622


1,622

Transactions with shareholders

(0)


(0)

(0)

(0)

(0)

At December 31, 2021

250,291

(30,652)

(29,399)

190,240

(115)

190,125

Note 13Provisions for liabilities and charges

(in thousands of euros)

31/12/22

31/12/21

Provisions for disputes

1,985

2,275

Provisions for pension and other post-employment benefit obligations

46,222

61,473

Other provisions for liabilities and charges

20,455

22,000

Total

68,662

85,748

(in thousands of euros)

Dec. 31, 2021

Scope entry

Additions

Reversals (utilised)

Reversals (surplus)

Reclassi-fications

Changes
 in OCI

Currency translation variation

Dec. 31, 2022

Provisions for employee

2,023

(0)

124

0

(231)

15

(0)

41

1,972

Provisions for other disputes

252

(0)

16

0

0

(262)

(0)

9

15

Provisions for disputes

2,275

(0)

140

0

(231)

(247)

0

49

1,985

Provisions for pension

61,473

(0)

3,404

(4,545)

(968)

0

(13,015)

(127)

46,222

Provisions for liabilities

9,813

(0)

0

0

(1)

(0)

(0)

(0)

9,812

Provisions for restructuring

9,721

(0)

4,658

(5,587)

(1,544)

(0)

(0)

(0)

7,248

Provisions for for free share allocation plan

(0)

(0)

(0)

(0)

(0)


(0)

(0)

Provisions for taxes (excl. income taxes)

707

(0)

(0)

(0)

(0)

(0)

(0)

(55)

652

Other provisions for liabilities

1,759

(0)

999

(17)

(0)

(0)

(0)

1

2,742

Other provisions for liabilities and charges

22,000

(0)

5,657

(5,604)

(1,544)

0

0

(54)

20,455

Total

85,748

(0)

9,202

(10,149)

(2,743)

(247)

(13,015)

(132)

68,662

(in thousands of euros)

Dec. 31, 2020

Scope entry

Additions

Reversals (utilised)

Reversals (surplus)

Reclassi-fications

Changes
 in OCI

Currency translation variation

Dec. 31, 2021

Provisions for employee

1,815

(0)

336

(0)

(124)

(0)

(0)

(4)

2,023

Provisions for other disputes

328

(0)

175

(0)

(16)

(202)

(0)

(33)

252

Provisions for disputes

2,143

(0)

512

(0)

(140)

(202)

(0)

(37)

2,275

Provisions for pension

63,619

136

4,069

(3,567)

(392)

0

(2,349)

(45)

61,473

Provisions for liabilities

16,642

(0)

478

0

(7,513)

(0)

(0)

206

9,813

Provisions for restructuring

11,039

(0)

3,847

(2,882)

(2,302)

(0)

(0)

19

9,721

Provisions for for free share allocation plan

0

(0)

0

(0)

(0)

(0)

(0)

(0)

(0)

Provisions for taxes (excl. income taxes)

630

(0)

0

(0)

(0)

202

(0)

(125)

707

Other provisions for liabilities

2,235

(0)

25

(377)

(125)

0

(0)

1

1,759

Other provisions for liabilities and charges

30,546

(0)

4,350

(3,259)

(9,939)

202

(0)

101

22,000

Total

96,307

136

8,934

(6,826)

(10,471)

0

(2,349)

18

85,748

Provisions for liabilities and charges mainly include provisions for pensions and other post-employment benefit obligations, provisions for restructuring and provisions for liabilities. The other provisions for liabilities are essentially made up of Italy (€2,6 million).

The main net change for the year is linked to provisions for pension (€15 million) including change in OCI (€13 million).

Provisions related to the strategic plan amounted to €6.4 million as of December 31, 2022. The net impact over the period corresponds to a €2.8 million reversal.

Note 14Employee benefits

(in thousands of euros)

Dec. 31, 2022

Dec. 31, 2021

Present value of benefit obligation at January 1

63,531

65,775

Acquisitions/mergers/deconsolidations


Current service cost

3,362

3,381

Interest cost

608

560

Actuarial (gains)/losses

(15,625)

(2,521)

Benefits paid

(3,530)

(3,859)

Acquisitions/mergers/deconsolidations

(0)

136

Other

(250)

60

Present value of benefit obligation at December 31

48,095

63,532

Change in plan assets


Fair value of plan assets at January 1

2,057

2,157

Revaluation adjustments – Return on plan assets

(178)

193

Employee contributions

36

6

Employer contributions

2,794

2,754

Benefits paid

(2,839)

(3,053)

Other

(0)

(0)

Fair value of plan assets at December 31

1,871

2,057

Reconciliation


Present value of benefit obligation at December 31

48,095

63,532

Fair value of plan assets

1,871

2,057

(Liability)/Asset recognised in the balance sheet at December

(46,222)

(61,473)

Income statement


Current service cost

3,402

3,381

Benefits paid including amounts paid in respect of settlements

(0)

(0)

Interest cost

608

560

Interest income

(22)

(23)

Revaluation adjustments on other long-term benefits

(2,410)

(343)

Other

(250)

(46)

(Income)/Expenses recorded in the income statement

1,329

3,530

Changes recognised directly in equity not reclassifiable to income


Revaluation adjustments arising in the year

(13,015)

(2,349)

Revaluation adjustments recognised in equity not reclassifiable to income

(13,015)

(2,349)

(in thousands of euros)

Dec. 31, 2022

France

Germany

Austria

Italy

Other

Total

Present value of benefit obligation at January 1

12,588

23,806

17,660

4,210

5,268

63,531

Acquisitions/mergers/deconsolidations

(0)

(0)

(0)

(0)

(0)

(0)

Current service cost

653

1,561

162

354

632

3,362

Interest cost

137

250

191

30

0

608

Actuarial (gains)/losses

(3,691)

(5,186)

(6,426)

(358)

36

(15,625)

Benefits paid

(484)

(1,761)

(1,041)

(50)

(194)

(3,530)

Other

(0)

(0)

(0)

(0)

(250)

(250)

Present value of benefit obligation at December 31

9,202

18,670

10,545

4,186

5,491

48,095

Change in plan assets


Fair value of plan assets at January 1

(0)

995

1,062

(0)

(0)

2,057

Revaluation adjustments – Return on plan assets

(0)

(54)

(124)

(0)

(0)

(178)

Acquisitions/mergers/deconsolidations

(0)

0

0

(0)

(0)

0

Employee contributions

(0)

36

0

(0)

(0)

36

Employer contributions

(0)

1,763

1,031

(0)

(0)

2,794

Benefits paid

(0)

(1,797)

(1,041)

(0)

(0)

(2,839)

Other

(0)

0

0

(0)

(0)

0

Fair value of plan assets at December 31

(0)

943

928

(0)

(0)

1,871

Reconciliation


Present value of benefit obligation at December 31

9,202

18,670

10,545

4,186

5,491

48,095

Fair value of plan assets

0

943

928

0

0

1,871

(Liability)/Asset recognised in the balance sheet at December

(9,202)

(17,727)

(9,617)

(4,186)

(5,491)

(46,224)

Income statement


Current service cost

653

1,601

162

354

632

3,402

Past service cost

(0)

(0)

(0)

(0)

(0)

(0)

Benefits paid including amounts paid in respect of settlements

(0)

(0)

(0)

(0)

(0)

(0)

Interest cost

137

250

191

30

(0)

608

Interest income

(0)

(10)

(12)

0

(0)

(22)

Revaluation adjustments on other long-term benefits

(175)

(2,039)

(27)

(169)

(0)

(2,410)

Other

(0)

(0)

(0)

(0)

(250)

(250)

(Income)/Expenses recorded in the income statement

615

(197)

314

214

382

1,329

Changes recognised directly in equity not reclassifiable to income


Revaluation adjustments arising in the year

(3,517)

(3,083)

(6,264)

(188)

36

(13,015)

Revaluation adjustments recognised in equity not reclassifiable to income

(3,517)

(3,083)

(6,264)

(188)

36

(13,015)

(in thousands of euros)

Dec. 31, 2021

France

Germany

Austria

Italy

Other

Total

Present value of benefit obligation at January 1

13,399

25,944

18,095

4,024

4,313

65,775

Acquisitions/mergers/deconsolidations

(0)

(0)

(0)

(0)

136

136

Current service cost

699

1,711

175

194

602

3,381

Interest cost

63

273

196

28

0

560

Actuarial (gains)/losses

(842)

(1,696)

(183)

42

158

(2,521)

Benefits paid

(731)

(2,426)

(621)

(78)

(2)

(3,859)

Other

(0)

(0)

(0)

(0)

60

60

Present value of benefit obligation at December 31

12,588

23,805

17,660

4,210

5,268

63,532

Change in plan assets


Fair value of plan assets at January 1

(0)

1,202

955

(0)

(0)

2,157

Revaluation adjustments – Return on plan assets

(0)

82

111

(0)

(0)

193

Acquisitions/mergers/deconsolidations

(0)

-

0

(0)

(0)

0

Employee contributions

(0)

6

0

(0)

(0)

6

Employer contributions

(0)

2,136

618

(0)

(0)

2,754

Benefits paid

(0)

(2,432)

(621)

(0)

(0)

(3,053)

Other

(0)

0

0

(0)

(0)

0

Fair value of plan assets at December 31

(0)

994

1,063

(0)

(0)

2,057

Reconciliation


Present value of benefit obligation at December 31

12,588

23,805

17,660

4,210

5,268

63,532

Fair value of plan assets

0

994

1,063

(0)

(0)

2,057

(Liability)/Asset recognised in the balance sheet at December

(12,588)

(22,811)

(16,597)

(4,210)

(5,268)

(61,475)

Income statement


Current service cost

699

1,711

175

194

602

3,381

Past service cost

(0)

(0)

(0)

(0)


(0)

Benefits paid including amounts paid in respect of settlements

(0)

(0)

(0)

(0)


(0)

Interest cost

63

273

196

28


560

Interest income

(0)

(12)

(11)

0


(23)

Revaluation adjustments on other long-term benefits

(42)

(299)

(6)

4


(343)

Other

(0)

(0)

(0)

(0)

(46)

(46)

(Income)/Expenses recorded in the income statement

720

1,673

354

226

557

3,530

Changes recognised directly in equity not reclassifiable to income


Revaluation adjustments arising in the year

(800)

(1,467)

(277)

38

158

(2,349)

Revaluation adjustments recognised in equity not reclassifiable to income

(800)

(1,467)

(277)

38

158

(2,349)

Actuarial assumptions

The discount rate applied to the Group’s employee benefit obligations is based on the Bloomberg Corporate AA curve for French entities and on a basket of international AA-rated corporate bonds for foreign entities.


Dec. 31, 2022

France

Germany

Austria

Italy

Inflation rate

2.25%

2.25%

2.25%

2.25%

Discount rate


Supplementary retirement and other plans

4.00%

4.00%

4.00%

N/A

Statutory retirement benefits

4.00%

N/A

4.00%

4.00%

Long-service awards

4.00%

4.00%

4.00%

4.00%

Other benefits

4.00%

4.00%

N/A

4.00%

Rate of salary increases (including inflation)

2.55%

2.25%

2.00%

2.25%

Rate of increase in medical costs (including inflation)

2.50%

N/A

NA

4.20%

Average remaining working life until retirement


Supplementary retirement and other plans

0.00

3.59

10.03

10.74

Statutory retirement benefits

0.00

N/A

8.70

11.80

Long-service awards

0.00

14.15

19.61

8.25

Other benefits

0.00

2.34

N/A

0.00

Term (years)


Supplementary retirement and other plans

2.47

9.83

10.93

16.49

Statutory retirement benefits

11.92

0.00

7.12

6.65

Long-service awards

6.89

7.94

8.39

7.90

Other benefits

9.71

1.35

N/A

N/A


Dec. 31, 2021

France

Germany

Austria

Italy

Inflation rate

1.75%

1.75%

1.75%

1.75%

Discount rate


Supplementary retirement and other plans

1.10%

1.10%

1.10%

N/A

Statutory retirement benefits

1.10%

N/A

1.10%

1.10%

Long-service awards

1.10%

1.10%

1.10%

1.10%

Other benefits

1.10%

1.10%

N/A

1.10%

Rate of salary increases (including inflation)

2.05%

2.25%

3.00%

1.75%

Rate of increase in medical costs (including inflation)

2.50%

N/A

N/A

4.20%

Average remaining working life until retirement


Supplementary retirement and other plans

0.00

1.13

4.00

6.40

Statutory retirement benefits

13.95

N/A

8.72

10.10

Long-service awards

13.95

14.60

18.94

6.50

Other benefits

0.00

3.09

N/A

0.00

Term (years)


Supplementary retirement and other plans

3.03

12.41

15.61

18.62

Statutory retirement benefits

13.64

0.00

8.21

9.07

Long-service awards

7.38

9.68

10.38

10.16

Other benefits

12.23

1.64

N/A

N/A

Sensitivity tests on the defined benefit obligation


Dec. 31, 2022

Post-employment defined
 benefit obligations

Other long-termbenefits

Supplementary retirement and other plans

Statutory retirement benefits

Long-service awards

Other benefits

+0.25% increase in the discount rate

(2.53)%

(2.31)%

(1.92)%

(0.34)%

-0.25% decrease in the discount rate

2.65%

2.40%

1.98%

0.34%

+0.25% increase in the inflation rate

1.68%

1.71%

(0.48)%

0.34%

-0.25% decrease in the inflation rate

(1.61)%

(1.64)%

0.43%

(0.34)%

+0.25% increase in rate of increase in medical costs

3.09%

0.00%

0.00%

0.00%

-0.25% decrease in rate of increase in medical costs

(2.95)%

0.00%

0.00%

0.00%

+0.25% increase in rate of salary increase (including inflation)

1.81%

2.32%

(0.24)%

0.34%

-0.25% decrease in rate of salary increase (including inflation)

(1.74)%

(2.24)%

0.19%

(0.34)%

Published data


Dec. 31, 2021

Post-employment defined benefit obligations

Other long-term benefits

Supplementary retirement and other plans

Statutory retirement benefits

Long-service awards

Other benefits

+1% increase in the discount rate

(3.32)%

(2.64)%

(2.33)%

(0.41)%

-1% decrease in the discount rate

3.51%

2.75%

2.41%

0.41%

+1% increase in the inflation rate

1.96%

2.09%

0.20%

0.41%

-1% decrease in the inflation rate

(1.63)%

(2.00)%

(0.25)%

(0.40)%

+1% increase in rate of increase in medical costs

3.82%

0.00%

0.00%

0.00%

-1% decrease in rate of increase in medical costs

(3.23)%

0.00%

0.00%

0.00%

+1% increase in rate of salary increase (including inflation)

2.83%

2.77%

0.48%

0.41%

-1% decrease in rate of salary increase (including inflation)

(2.35)%

(2.66)%

(0.53)%

(0.40)%

It should be noted that the IFRIC decision published in May 2021 on IAS 19 “Attribution of post-employment benefits over periods of service” has no impact on COFACE’s consolidated financial statements at December 31, 2022.

Note 15Financing liabilities

(in thousands of euros)

Dec. 31, 2022

Dec. 31, 2021

Due within one year


  • Interest

12,170

11,930

  • Amortization of expenses

(647)

(596)

Total

11,523

11,335

Due between one and five years


  • Amortization of expenses

(1,386)

(781)

  • Nominal

226,600

380,000

Total

225,214

379,218

Due beyond five years


  • Amortization of expenses

(2,457)

(0)

  • Nominal

300,000

(0)

Total

297,543

(0)

Total

534,280

390,553

For the year ended December 31, 2022, the Group’s financing liabilities, totalling €534.3 million, correspond to:

A fixed rate subordinated note 4.125% issued on March 27, 2014 by COFACE SA for a nominal amount of €380 million and maturing on March 27, 2024.

The per-unit bond issue price was €99,493.80, and the net amount received by COFACE SA was €376.7 million, net of placement fees and directly-attributable transaction costs.

The securities are irrevocably and unconditionally guaranteed on a subordinated basis by Compagnie française d’assurance pour le commerce extérieur, the Group’s main operating entity.

COFACE SA has also announced a tender offer on September 21, 2022 to repurchase its guaranteed subordinated notes due on March 27, 2024, for an amount of €153 million, at a fixed purchase price of 103,625 per cent.

The nominal amount after the tender offer is now €227 million, still maturing on March 27, 2024.

A new issuance on September 22, 2022 of €300 million subordinated notes bearing a fixed interest rate of 6.000 per cent., due on September 22, 2032.

The debt issuance costs and the issue premium of both subordinated notes are (-€4,490 thousand), of which (-€466) thousand corresponding to the notes maturing on March 27, 2024, and (-€4,024) thousand for the notes maturing on September 22, 2032.

Accrued interest are €12,170 thousand, of which €7,270 thousand for the on March 27, 2024, €4,900 thousand for the September 22, 2032.

The impact on consolidated income statement income as at December 31, 2022 mainly includes the interest related to the period for €25,530 thousand.

Note 16Lease liabilities

(in thousand of euros)

Dec. 31, 2022

Dec. 31, 2021

Lease liabilities – Real estate leasing

65,449

71,433

Lease liabilities – Equipment leasing

9,173

10,497

Lease liabilities – Leasing

74,622

81,930

Note 17Liabilities relating to insurance contracts

(in thousands of euros)

Dec. 31, 2022

Dec. 31, 2021

Provisions for unearned premiums

317,547

287,499

Claims reserves

1,490,385

1,351,095

Provisions for premium refunds

248,334

220,465

Liabilities relating to insurance contracts

2,056,267

1,859,059

Provisions for unearned premiums

(65,716)

(51,968)

Claims reserves

(374,343)

(382,699)

Provisions for premium refunds

(68,821)

(77,520)

Reinsurers’ share of insurance liabilities

(508,881)

(512,187)

Net technical provisions

1,547,386

1,346,872

Provisions for claims include provisions to cover claims incurred but not reported and shortfalls in estimated provisions for claims reported. These amounted to €980 million at December 31, 2022.

Note 18Payables arising from banking activities

(in thousands of euros)

Dec. 31, 2022

Dec. 31, 2021

Amounts due to banking sector companies

743,230

822,962

Amounts due to customers of banking sector companies

389,300

376,788

Debt securities

1,794,858

1,498,775

Total

2,927,389

2,698,525

The lines “Amounts due to banking sector companies” and “Debt securities” correspond to sources of refinancing for the Group’s factoring entities – Coface Finanz (Germany) and Coface Factoring Poland.

Note 19Deferred tax

(in thousands of euros)

Dec. 31, 2022

Dec. 31, 2021

Deferred tax assets

(88,755)

(58,345)

Deferred tax liabilities

105,142

120,326

Net deferred tax – liabilities

16,387

61,981

Timing differences

(60,770)

(11,680)

Provisions for pensions and other employment benefit obligations

(4,233)

(9,022)

Tax loss carry forwards

(5,252)

(11,514)

Cancellation of the claims equalization provision

86,642

94,197

Net deferred tax – liabilities

16,387

61,981

Deferred tax assets and liabilities are assessed at the rate applicable on the date on which the asset will be realized or the liabilities will be settled.

Each entity is compensating deferred tax assets and liabilities whenever it is legaly authorized to compensate due tax assets and liabilities.

Changes in deferred tax balances by region

Deferred tax with positive signs are deferred tax liabilities. On the other hand, those with negative signs are deferred tax assets.

(in thousands of euros)

Dec. 31, 2021

Change through income statement

Revaluation adjustment on AFS investments

Currency translation variation

Scope entry

Other movements

Dec. 31, 2022

Northern Europe

60,826

1,820

(322)

(172)

(43)

1,114

63,223

Western Europe

25,110

12,865

(49,589)

20

0

(121)

(11,715)

Central Europe

(2,115)

6,124

(658)

(474)

(44)

1,612

4,445

Mediterranean & Africa

(22,826)

(2,947)

0

496

(0)

50

(25,227)

North America

2,197

(2,571)

(2,124)

232

(0)

17

(2,249)

Latin America

2,632

(1,680)

(4,976)

1,644

(299)

(5,930)

(8,609)

Asia-Pacific

(3,843)

664

(495)

193

(0)

(0)

(3,481)

Total

61,981

14,275

(58,164)

1,939

(386)

(3,258)

16,387

(in thousands of euros)

Dec. 31, 2020

Change through income statement

Revaluation adjustment on AFS investments

Currency translation variation

Scope entry

Other movements

Dec. 31, 2021

Northern Europe

57,473

2,661

23

189

(0)

480

60,826

Western Europe

23,722

(1,858)

2,922

16

(0)

308

25,110

Central Europe

77

(2,242)

92

52

(169)

75

(2,115)

Mediterranean & Africa

(18,496)

(4,949)

(0)

611

(0)

8

(22,826)

North America

2,392

(433)

1

230

(0)

7

2,197

Latin America

(2,525)

(489)

1,316

754

(173)

3,749

2,632

Asia-Pacific

(1,387)

(2,079)

(303)

(74)

0

0

(3,843)

Total

61,256

(9,389)

4,051

1,778

(342)

4,627

61,981

The “Other movements” column mainly includes deferred taxes on changes in retirement benefits recognised as equity not reclassifiable to income and a correction on deferred tax in Brazil.

Deferred taxes related to tax losses

The breakdown by region of deferred taxes assets linked to tax deficits is as follows:

(in thousands of euros)

Dec. 31, 2022

Dec. 31, 2021

Northern Europe

2,699

4,735

Western Europe

0

70

Central Europe

157

157

Mediterranean & Africa

245

1,308

North America

(0)

(0)

Latin America

102

(0)

Asia-Pacific

2,049

5,243

Net deferred tax – liabilities

5,252

11,514

The recognition of deferred tax assets on tax losses is subject to a case-by-case recoverability analysis, taking into account the forecasts of the results of each entity. Deferred tax assets on losses are recognized at the level of entity’s income tax results estimated for the period from 2022 to 2027, i.e. a recoverability horizon of five years.

This recognition results from a Business Tax Plan prepared by each entity on the basis of the Business Plan approved by the Management.

Note 20Payables arising from insurance and reinsurance operations

(in thousands of euros)

Dec. 31, 2022

Dec. 31, 2021

Guarantee deposits received from policyholders and other

103

35

Amounts due to policyholders and agents

88,162

57,079

Payables arising from insurance and inward reinsurance operations

88,265

57,114

Amounts due to reinsurers

229,419

226,848

Deposits received from reinsurers

1,126

2,621

Payable arising from ceded reinsurance operations

230,545

229,469

Total

318,810

286,583

Note 21Other liabilities

(in thousands of euros)

Dec. 31, 2022

Dec. 31, 2021

Current tax payables

61,681

80,712

Derivatives and related liabilities

222

3,480

 Accrued personnel costs

82,042

71,706

 Sundry payables

231,159

176,652

 Deferred income

7,773

7,552

 Other accruals

20,351

34,829

Other payables

341,326

290,739

Total

403,228

374,931

Note 22Revenue
Breakdown of consolidated revenue

(in thousands of euros)

Dec. 31, 2022

Dec.31, 2021

Premiums – direct business

1,575,745

1,357,895

Premiums – inward reinsurance

122,525

104,529

Gross written premiums

1,698,270

1,462,424

Premium refunds

(142,109)

(121,336)

Change of provisions for unearned premiums

(28,697)

(28,451)

Earned premiums

1,527,464

1,312,637

Fees and commission income

158,582

140,691

Net income from banking activities

70,414

64,400

Other insurance-related services

39

156

Business information and other services

49,269

42,266

Receivables management

6,202

7,708

Income from other activities

55,510

50,130

Revenue or income from other activities

284,506

255,221

Consolidated revenue

1,811,970

1,567,858

Consolidated revenue by country of invoicing

(in thousands of euros)

Dec. 31, 2022

Dec.31, 2021

Northern Europe

372,337

331,529

Western Europe

359,644

316,684

Central Europe

178,533

156,263

Mediterranean & Africa

480,576

429,399

North America

168,011

137,481

Latin America

101,595

73,330

Asia-Pacific

151,274

123,171

Consolidated revenue

1,811,970

1,567,858

Consolidated revenue by activity

(in thousands of euros)

Dec. 31, 2022

Dec.31, 2021

Earned premiums – Credit

1,444,175

1,242,767

Earned premiums – Single Risk

24,480

15,839

Earned premiums – Credit insurance

1,468,655

1,258,606

Fees and commission income

158,582

140,691

Other insurance-related services

39

156

Revenue of credit insurance activity

1,627,276

1,399,453

Earned premiums – Guarantees

58,809

54,031

Financing fees

32,888

26,409

Factoring fees

41,126

39,712

Other

(3,601)

(1,720)

Net income from banking activities (factoring)

70,414

64,400

Business information and other services

49,269

42,266

Receivables management

6,202

7,708

Revenue of business information and other services activity

55,471

49,974

Consolidated revenue

1,811,970

1,567,858

Note 23Claim expenses

(in thousands of euros)

Dec. 31, 2022

Dec. 31, 2021

Paid claims, net of recoveries

(308,836)

(286,097)

Claims handling expenses

(39,894)

(36,190)

Change in claims reserves

(128,049)

41,831

Total

(476,779)

(280,456)

Claims expenses by period of occurrence

(in thousands of euros)

Dec. 31, 2022

Dec. 31, 2022

Gross

Outward reinsurance and retrocessions

Net

Gross

Outward reinsurance and retrocessions

Net

Claims expenses – current year

(1,013,341)

239,685

(773,655)

(800,187)

255,221

(544,966)

Claims expenses – prior years

536,561

(157,499)

379,062

519,731

(239,011)

280,720

Total

(476,779)

82,186

(394,593)

(280,456)

16,210

(264,246)

Note 24Overheads by function

(in thousands of euros)

Dec. 31, 2022

Dec. 31, 2021

Policy acquisition costs

(304,747)

(259,317)

Administrative costs

(314,460)

(270,990)

Other insurance activity expenses

(69,824)

(66,243)

Expenses from banking activities, excluding cost of risk

(14,331)

(13,103)

Expenses from services activities

(102,992)

(89,674)

Operating expenses

(806,354)

(699,327)

Investment management expenses

(4,294)

(4,010)

Claims handling expenses

(39,894)

(36,190)

Total

(850,543)

(739,527)

of which employee profit-sharing

(10,120)

(9,898)

Total overheads include general insurance expenses (by function), expenses from services activities and expenses from banking activities. It came out at €850,550 thousand as at December 31, 2022 versus €739,527 thousand as at December 31, 2021.

In the income statement, claims handling expenses are included in “Claims expenses” and investment management expenses are shown in “Investment income, net of management expenses (excluding finance costs)”.

Note 25Expenses from banking activities

(in thousands of euros)

Dec. 31, 2022

Dec. 31, 2021

Charges to allowances for receivables

6,463

2,954

Reversal of allowances for receivables

(0)

(0)

Losses on receivables

(6,154)

(2,878)

Cost of risk

308

76

Operating expenses

(14,331)

(13,103)

Total

(14,023)

(13,028)

“Cost of risk” corresponds to the risk-related expense on credit insurance operations conducted by factoring companies, which includes net additions to provisions, receivables written off during the year, and recoveries of amortised receivables.

Note 26Income and expenses from ceded reinsurance

(in thousands of euros)

Dec. 31, 2022

Dec. 31, 2021

Ceded claims

75,772

118,900

Change in claims provisions net of recoveries

(8,314)

(104,777)

Commissions paid by reinsurers

197,752

183,686

Income from ceded reinsurance

265,210

197,810

Ceded premiums

(425,593)

(519,061)

Change in unearned premiums provisions

13,774

6,963

Expenses from ceded reinsurance

(411,819)

(512,098)

Total

(146,610)

(314,288)

Note 27Investment income, net of management expenses (excluding finance costs)

(in thousands of euros)

Dec. 31, 2022

Dec. 31, 2021

Investment income

46,353

38,669

Change in financial instruments at fair value through income

13,224

(6,853)

o/w hedged by currency derivatives on “Colombes” and “Lausanne” mutual funds

(0)

(0)

Net gains on disposals

18,994

(1,365)

o/w hedged by currency derivatives on “Colombes” and “Lausanne” mutual funds

5,198

154

Additions to/(reversals from) impairment

259

3,982

Net foreign exchange gains/losses

(29,636)

15,534

o/w hedged by currency derivatives on “Colombes” and “Lausanne” mutual funds *

(2,623)

(1,534)

Investment management expenses

(9,089)

(7,789)

Total

40,105

42,177

*    The Colombes and Lausanne funds foreign exchange result covered by derivatives amounts to -€2,623 thousand. This amount is broken down into -€14,332 thousand in realized profit and €11,709 thousand in unrealized losses.

Investment income by class

(in thousands of euros)

Dec. 31, 2022

Dec. 31, 2021

Equities

40,227

3,976

Fixed income

(6,447)

23,234

Investment properties

19,456

13,974

Sub-total

53,236

41,185

Associated and non consolidated companies

2,621

6,238

Exchange rate – change profit/loss

(6,663)

2,543

Financial and investment charges

(9,089)

(7,789)

Total

40,105

42,177

Although derivative instruments are used to hedge the overall currency risk, the Coface Group does not apply hedge accounting for accounting purposes.

Note 28Other operating income and expenses

(in thousands of euros)

Dec.31, 2022

Dec.31, 2021

Build to Lead restructuring expenses

(1,887)

(2,503)

Restructuring provision

(327)

(233)

Impact of entry in consolidation scope

(577)

(58)

Other operating expenses

(9,722)

(2,384)

Total other operating expenses

(12,512)

(5,179)

Impact of entry in consolidation scope

2,199

1,461

Other operating income

1,197

541

Total other operating income

3,397

2,002

Total

(9,116)

(3,177)

Other operating income and expenses amounted to -€9.1 million as of December 31, 2022.

The impact of entries into the scope of consolidation is composed of -€557 thousand for Northern America region, €323 thousand for Central Europe region, €888 thousand for Latin America region and €988 thousand for Western Europe region.

The other operating expenses amounted to -€9.7 million mainly include the costs linked to double Run (production of Proforma related to IFRS 17).

Note 29Income tax expense

(in thousands of euros)

Dec. 31, 2022

Dec. 31, 2021

Income tax

(86,286)

(76,900)

Deferred tax

(14,275)

9,389

Total

(100,561)

(67,511)

The income tax expense highly increased because of the better entities results and better forecast on the following years, which allowed to activate more deferred tax related to loss carry forward.

Tax proof

(in thousands of euros)

Dec. 31, 2022

Dec. 31, 2021

Net income

283,107


223,817


Non-controlling interests

(244)


(57)


Income tax expense

(100,561)


(67,511)


Pre-tax income before share in net income of associates and badwill

383,913


291,385


Tax rate


25.83%


+28.4%

Theoretical tax

(99,165)


(82,782)


Tax expense presented in the consolidation income statement

(100,561)

26.19%

(67,511)

+23.2%

Difference

1,396

0.36%

(15,271)

(5.2)%

Impact of differences between Group tax rates and local tax rates

20,981

5.46%

22,715

+7.8%

Specific local taxes

(10,690)

(2).78%

(5,875)

(2.0)%

o/w French Corporate value added tax (CVAE)

(684)

(0).18%

(1,325)

(0.5)%

Tax losses for which no deferred tax assets have been recognised

(14,681)

(3).82%

(3,663)

(1.3)%

Utilisation of previously unrecognised tax loss carryforwards

1,822

0.47%

5,243

+1.8%

Dividends paid in France non deductible for tax purposes (1%)

(8,582)

(2).24%

(6,862)

+2.4%

Liability method impact

8,453

2.20%

(1,600)

(0.5)%

Other differences

1,298

0.34%

(1,548)

(0.5)%

The effective income tax rate increased of 3 points from 26,19% at December 31, 2022 compare to 23,17% at December 31, 2021.

The difference between theoretical tax and tax expense presented in the consolidated income statement comes from a positive impact of differences between Group tax rates and local tax rates partially offset by the negative effect of the non-activation of tax losses.

Note 30Breakdown of net income by segment

Premiums, claims and commissions are monitored by country of invoicing. In the case of direct business, the country of invoicing is the one in which the issuer of the invoice is located and for inward reinsurance, the country of invoicing is the one in which the ceding insurer is located.

Geographic segmentation by billing location does not necessarily correspond to the debtor’s location.

Reinsurance income, which is calculated and recognised for the whole Group at the level of Compagnie française d’assurance pour le commerce extérieur and Coface Re, has been reallocated at the level of each region.

Income taxes by segment have been calculated based on this monitoring framework.

Analysis of December 31, 2022 net income by segment

(in thousands of euros)

Northern
 Europe

Western
 Europe

Central
 Europe

Mediter-
ranean & Africa

North America

Latin America

Asia-Pacific

Group reinsu-
rance

Cogeri

Holding company costs

Inter-zone

Group total

Revenue

377,249

352,479

180,067

482,266

168,011

101,726

151,274

1,190,549

30,917

0

(1,222,568)

1,811,970

o/w Earned Premium

268,032

316,729

141,856

402,204

153,934

97,168

147,540

1,190,549


(1,190,548)

1,527,464

o/w Factoring

59,852

(4,233)

14,795


70,414

o/w Other insurance-related services

49,365

39,983

23,416

80,062

14,077

4,558

3,734


30,917


(32,020)

214,092

Claims-related expenses (including claims handling costs)

(93,871)

(117,700)

(20,620)

(139,980)

(36,088)

(39,020)

(14,533)

(438,215)


(3,951)

427,199

(476,779)

Cost of risk

356

0

(47)

0

0

0

0


(1)

308

Commissions

(27,460)

(45,259)

(15,407)

(50,293)

(19,939)

(14,924)

(27,871)

(467,692)


467,679

(201,166)

Other internal general expenses

(130,565)

(111,542)

(63,250)

(148,377)

(60,909)

(34,682)

(48,979)


(30,420)

(21,879)

45,408

(605,195)

Underwriting income before reinsurance*

125,709

77,978

80,743

143,616

51,075

13,100

59,891

284,642

497

(25,830)

(282,283)

529,138

Income/(loss) on ceded reinsurance

(36,014)

(20,497)

(15,117)

(32,088)

(10,497)

(8,911)

(13,965)

(294,162)


284,642

(146,609)

Other operating income and expenses

(2,469)

(5,776)

272

(1,806)

(133)

965

(169)


(9,116)

Net financial income excluding finance costs

8,873

8,775

8,768

17,385

673

4,703

(3,372)


(178)

(932)

(4,590)

40,105

Finance costs

(203)

(1,918)

(698)

(848)

(1,896)

(202)

(295)


(254)

(25,530)

2,239

(29,605)

Operating income including finance costs

95,896

58,562

73,968

126,259

39,222

9,655

42,090

(9,520)

65

(52,292)

8

383,913

Badwill


0

0


0

Net income before tax

95,896

58,562

73,968

126,259

39,222

9,655

42,090

(9,520)

65

(52,292)

8

383,913

Income tax expense

(25,119)

(15,340)

(19,375)

(33,072)

(10,274)

(2,529)

(11,025)

2,494

(17)

13,697

(1)

(100,561)

Consolidated net income before non-controlling interests

70,777

43,222

54,593

93,187

28,948

7,126

31,065

(7,026)

48

(38,595)

7

283,352

Non-controlling interests

(3)

1

(2)

(237)

(1)

(1)

(1)


(244)

Net income for the period

70,774

43,223

54,591

92,950

28,947

7,125

31,064

(7,026)

48

(38,595)

7

283,107

*     Underwriting income before reinsurance is a key financial indicator used by the Coface Group to analyse the performance of its businesses. Underwriting income before reinsurance corresponds to the sum of revenue, claims expenses, expenses from banking activities, cost of risk, policy acquisition costs, administrative costs, and other current operating expenses, and expenses from other activities.

Analysis of December 31, 2021 net income by segment

(in thousands of euros)

Northern Europe

Western Europe

Central Europe

Mediter-
ranean & Africa

North America

Latin America

Asia-Pacific

Group reinsu-
rance

Cogeri

Holding
 company
 costs

Inter-zone

Group
total

Revenue

331,407

312,806

157,506

430,730

137,481

73,349

123,171

843,309

27,069

0

(868,970)

1,567,858

o/w Earned Premium

233,732

277,352

125,132

361,421

125,571

70,248

119,180

843,309


(843,308)

1,312,637

o/w Factoring

52,111

793

11,496


64,400

o/w Other insurance-related services

45,564

34,661

20,878

69,309

11,910

3,101

3,991


27,069


(25,662)

190,821

Claims-related expenses (including claims handling costs)

(42,506)

(67,677)

(23,580)

(98,850)

(18,060)

(6,160)

(10,169)

(245,705)


(4,592)

236,843

(280,456)

Cost of risk

62

0

14

0

0

0

0


0

76

Commissions

(23,604)

(37,558)

(12,100)

(45,718)

(14,912)

(10,225)

(22,634)

(325,098)


325,055

(166,794)

Other internal general expenses

(120,070)

(98,839)

(55,396)

(127,555)

(48,683)

(27,781)

(40,307)


(25,020)

(25,441)

36,559

(532,533)

Underwriting income before reinsurance*

145,289

108,732

66,444

158,607

55,826

29,183

50,061

272,506

2,049

(30,033)

(270,514)

588,150

Income/(loss) on ceded reinsurance

(94,049)

(86,157)

(10,832)

(88,223)

(13,269)

(8,071)

(10,754)

(275,437)


272,505

(314,288)

Other operating income and expenses

(2,056)

(1,763)

452

(174)

(142)

531

(25)


(3,177)

Net financial income excluding finance costs

1,520

28,539

2,863

6,916

2,649

4,160

2,490


426

(1,098)

(6,288)

42,177

Finance costs

(1,656)

(3,174)

(879)

(2,046)

(897)

(230)

(283)


(224)

(16,420)

4,332

(21,477)

Operating income including finance costs

49,048

46,177

58,048

75,080

44,167

25,573

41,489

(2,931)

2,251

(47,551)

35

291,386

Badwill


0

0


0

Net income before tax

49,048

46,177

58,048

75,080

44,167

25,573

41,489

(2,931)

2,251

(47,551)

35

291,386

Income tax expense

(11,364)

(10,699)

(13,449)

(17,395)

(10,233)

(5,925)

(9,613)

679

(522)

11,017

(8)

(67,511)

Consolidated net income before non-controlling interests

37,684

35,478

44,599

57,685

33,934

19,648

31,876

(2,252)

1,729

(36,534)

27

223,874

Non-controlling interests

(1)

(1)

(2)

(51)

(1)

0

(1)


(57)

Net income for the period

37,683

35,477

44,597

57,634

33,933

19,648

31,875

(2,252)

1,729

(36,534)

27

223,817

*     Underwriting income before reinsurance is a key financial indicator used by the Coface Group to analyse the performance of its businesses. Underwriting income before reinsurance corresponds to the sum of revenue, claims expenses, expenses from banking activities, cost of risk, policy acquisition costs, administrative costs, and other current operating expenses, and expenses from other activities.

Note 31Earnings per share


Dec. 31, 2022

Average number
 of shares

Net income for the period (in €k)

Earnings per share (in €)

Basic earnings per share

149,047,978

283,107

1.90

Dilutive instruments


Diluted earnings per share

149,047,978

283,107

1.90


Dec. 31, 2021

Average number
 of shares

Net income for the period (in €k)

Earnings per share (in €)

Basic earnings per share

149,032,282

223,817

1.50

Dilutive instruments


Diluted earnings per share

149,032,282

223,817

1.50

Note 32Group’s headcount

(in full time equivalent)

Dec. 31, 2021

Dec. 31, 2020

Northern Europe

632

693

Western Europe

994

1,012

Central Europe

753

675

Mediterranean & Africa

678

669

North America

223

206

Latin America

307

303

Asia-Pacific

118

109

Total

3,704

3,667

At December 31, 2022, the number of employees of fully consolidated companies was 3,704 full-time equivalents FTE versus 3,667 at December 31, 2021, up for 37 FTEs.

Note 33Related parties
Ownership structure at December 31, 2022


Number of shares

%

Arch Capital Group Ltd.

44,849,425

30.09%

Natixis

0

0.00%

Public

104,214,249

69.91%

Total

149,063,674

100.00%

Ownership structure at December 31, 2021


Number of shares

%

Arch Capital Group Ltd.

44,849,425

30.09%

Natixis

15,078,051

10.12%

Public

89,104,806

59.79%

Total

149,032,282

100.00%

On January 6, 2022, Natixis announced the sale of its remaining interest in COFACE SA. This sale represented approximately 10.04% of COFACE SA’s share capital, or 15,078,051 shares. Following this transaction, Natixis no longer held any shares in COFACE SA and is no longer a related party.

At December 31, 2022, Arch Capital Group Ltd. held 30.09% of Coface Group’s shares, excluding treasury stock, and 29.86% of the shares including treasury stock.

Relations between the Group’s consolidated entities and related parties

The Coface Group’s main transactions with related parties concern Arch Capital Group and its subsidiaries.

The main related-party transactions are as follows:

  • reinsurance policies between Coface and Arch Reinsurance Group wich is owned by Arch Capital Group Ltd.;
  • Coface’s credit insurance coverage made available to entities related to Coface;
  • recovery of insurance receivables carried out by entities related to Coface on behalf of Coface;
  • rebilling of general and administrative expenses, including overheads, personnel expenses, etc.

These transactions are broken down below as of December 31, 2022:


Dec. 31, 2022

Current operating income (in thousands of euros)

Arch Reinsurance Group

Revenue (net banking income, after cost of risk)

0

Claims expenses

0

Expenses from other activities

0

Policy acquisition costs

0

Administrative costs

0

Other current operating income and expenses

0

Reinsurance result

(1,360)

Operating income/(loss)

(1,360)


31/12/2022

RELATED-PARTY RECEIVABLES AND PAYABLES (in thousands of euros)

Arch Reinsurance Group

Financial investments

0

Other assets

(2)

Reinsurance receivables

0

Cash and cash equivalents

0

Liabilities relating to insurance contracts

0

Amounts due to banking sector companies

0

Reinsurance debts

(421)

Other liabilities

0

These transactions are broken down below as of December 31, 2021:


Dec. 31, 2021

Current operating income (in thousands of euros)

Arch Reinsurance Group

Revenue (net banking income, after cost of risk)

0

Claims expenses

0

Expenses from other activities

0

Policy acquisition costs

0

Administrative costs

0

Other current operating income and expenses

0

Reinsurance result

(1,054)

Operating income/(loss)

(1,054)


Dec. 31, 2021

Related-party receivables and payables (in thousands of euros)

Arch Reinsurance Group

Financial investments

0

Other assets

(7)

Reinsurance receivables

0

Cash and cash equivalents

0

Liabilities relating to insurance contracts

0

Amounts due to banking sector companies

0

Reinsurance debts

(730)

Other liabilities


Note 34Key management compensation

(in thousands of euros)

Dec.31, 2022

Dec. 31, 2021

Short-term benefits (gross salaries and wages, incentives, benefits in kind and annual bonus)

5,586

4,472

Other long-term benefits

1,499

1,241

Statutory termination benefits

(0)

(0)

Share-based payment

976

(0)

Total

7,973

5,713

As of December 31, 2022, the Group Management Committee is composed of Coface CEO and eight members.

The line “Other long-term benefits” corresponds to the free performance shares allocation (fair value IFRS).

For 2022, the line “Share-based payment” corresponds to the free performance shares allocated in the LTIP Plan 2019 and delivered in 2022 (fair value IFRS).

For 2021, as the performance conditions related to the LTIP 2018 were not met, the line “Shared-based payment” is nul.

A total envelope of €427,000 was paid out to the members of the Board of Directors, the Audit, the Risk and the Compensation Committees in 2022.

Note 35Breakdown of audit fees

(in thousands of euros)

Mazars

Deloitte

Total

31/12/22

%

31/12/21

%

31/12/22

%

31/12/21

%

31/12/22

%

31/12/21

%

Statutory and IFRS Audit


COFACE SA

(1,153)

45%

(654)

34%

(1,058)

37%

(620)

26%

(2,210)

41%

(1,274)

29%

Subsidiaries

(1,362)

53%

(1,205)

63%

(1,813)

63%

(1,792)

74%

(3,175)

58%

(2,997)

69%

Sub-total

(2,515)

98%

(1,859)

97%

(2,871)

100%

(2,412)

100%

(5,385)

99%

(4,271)

99%

Other fees than Statutory and IFRS Audit


COFACE SA

(0)

0%

(0)

0%

(0)

0%

(0)

0%

(0)

0%

(0)

0%

Subsidiaries

(55)

2%

(64)

3%

1

0%

(0)

0%

(54)

1%

(64)

1%

Sub-total

(55

2%

(64)

3%

1

0%

(0)

0%

(54)

1%

(64)

1%

Total

(2,569)

100%

(1,923)

100%

(2,870)

100%

(2,412)

100%

(5,439)

100%

(4,335)

100%

Fees for services other than the certification of accounts correspond mainly to 

  • engagements to issue assurance reports on financial or regulatory information, 
  • tax services outside France, such as tax reporting support services, and 
  • other authorised advisory services.
Note 36Off-balance sheet commitments

(in thousands of euros)

Dec. 31, 2022

Total

Related to financing

Related to activity

Commitments given

1,447,127

1,360,427

86,700

Endorsements and letters of credit

1,360,427

1,360,427

0

Property guarantees

3,500

0

3,500

Financial commitments in respect of equity interests

83,200

0

83,200

Commitments received

1,890,984

1,295,563

595,421

Endorsements and letters of credit

146,290

0

146,290

Guarantees

449,131

0

449,131

Credit lines linked to commercial paper

700,000

700,000


Credit lines linked to factoring

595,563

595,563


Financial commitments in respect of equity interests


Guarantees received

320,478

0

320,478

Securities lodged as collateral by reinsurers

320,478

0

320,478

Financial market transactions

105,965

0

105,965

Endorsements and letters of credit correspond mainly to:

  • joint guarantee for €226 million given by Coface Europe to the benefit of investors in the subordinated debt issued by COFACE SA (maturity 10 years);
  • joint guarantees for €1,042 million given by COFACE SA to banks (Natixis, BNPP, Santander, HSBC, Société Générale) financing bilateral lines of Coface Finanz and Coface Poland Factoring.

Securities lodged as collateral by reinsurers concern Coface Re for €302,3 million and Coface Europe for €18,2 million.

(in thousands of euros)

Dec. 31, 2021

Total

Related to financing

Related to activity

Commitments given

1,144,652

1,133,000

11,651

Endorsements and letters of credit

1,133,000

1,133,000

0

Property guarantees

7,500

0

7,500

Financial commitments in respect of equity interests

4,151

0

4,151

Commitments received

1,397,644

853,084

544,561

Endorsements and letters of credit

141,291

0

141,291

Guarantees

403,270

0

403,270

Credit lines linked to commercial paper

700,000

700,000

0

Credit lines linked to factoring

153,084

153,084

0

Financial commitments in respect of equity interests


Guarantees received

323,314

0

323,314

Securities lodged as collateral by reinsurers

323,314

0

323,314

Financial market transactions

211,543

0

211,543

Note 37Operating leases

The Lease contracts for future years are mainly recorded in the balance sheet since the implementation of IFRS 16 on January 1, 2019.

Note 38Relationship between parent company and subsidiaries

The main operational subsidiary of the Coface Group is the Compagnie française d’assurance pour le commerce extérieur (la Compagnie). This subsidiary, which is wholly owned by the Company, is a public limited company (société anonyme) under French law, with share capital of €137,052,417.05, registered in the Nanterre Trade and Companies Registry under number 552,069,791.

The main flows between COFACE SA, the listed parent company, and la Compagnie are as follows:

  • financing:
    • COFACE SA and la Compagnie have granted each other one ten-year loan,
    • in net terms, COFACE SA finances la Compagnie,
    • la Compagnie stands as surety for the bond issue floated by COFACE SA,
    • a two-way cash flow agreement exists between COFACE SA and la Compagnie,
    • COFACE SA delegates to la Compagnie management of its commercial paper programme and of its cash management;
  • dividends:
    • la Compagnie pays dividends to COFACE SA;
  • tax consolidation:
    • la Compagnie forms part of the tax consolidation group headed by COFACE SA.

The table below summarises the interim balance of la Compagnie française d’assurance pour le commerce extérieur and its principal financial flows as of December 31, 2022:

(in thousands of euros)

Listed company

Compagnie française pour le commerce extérieur
 (including branches)

Other entities

Eliminations

Total

Revenue

1,684

1,805,821

1,233,623

(1,229,157)

1,811,970

Current operating income

14,294

220,979

241,678

(54,317)

422,634

Net income

(14,209)

103,027

194,289

0

283,108

Fixed assets

1,968,320

5,396,430

1,475,818

(5,485,315)

3,355,253

Indebtedness outside the group

534,280

0

0

0

534,280

Cash and cash equivalent

1,243

276,580

275,964

0

553,786

Net cash generated from operating activities

(93,728)

232,693

310,229

0

449,193

Dividends paid to the quoted company

0

299,894

47,968

0

347,862

At the end of December 2021, The table wich summarised the interim balance of la Compagnie française d’assurance pour le commerce extérieur and its principal financial flows was:

(in thousands of euros)

Listed company

Compagnie française pour le commerce extérieur (including branches)

Other entities

Eliminations

Total

Revenue

1,966

1,474,147

969,662

(877,917)

1,567,858

Current operating income

13,190

127,529

198,387

(23,067)

316,039

Net income

(5,825)

68,101

161,541

0

223,817

Fixed assets

1,829,457

5,443,686

1,463,610

(5,181,562)

3,555,191

Indebtedness outside the Group

390,553

0

0

0

390,553

Cash and cash equivalent

784

200,646

161,011

0

362,440

Net cash generated from operating activities

28,236

167,929

130,849

0

327,014

Dividends paid to the quoted company

0

74,794

8,980

0

83,774

Note 39Entry into the scope of consolidation

Entries into the scope of consolidation in the year of 2022 concern seven entities Coface Services Greece, Coface Norden Services A/S (Denmark Services), Coface Sverige Services AB (Sweden Services), Coface Services Suisse, Coface Servicios Argentina S.A., Coface Baltics Services and a new branch Coface New Zealand.

In the absence of an IFRS standard covering entries into the scope of consolidation of entities held for several years and in accordance with CRC regulation n° 99-02, the results accumulated by these entities since their takeover have been recorded in the consolidated income, after deduction of dividends received by the Group.

The contribution of new entities to the Coface Group’s consolidated accounts as of December 31, 2022 is presented below:

  • turnover: €10,012 thousand;
  • net income: €4,084 thousand;
  • equity: €3,221 thousand;
  • total balance sheet: €8,463 thousand.
Note 40Events after the reporting period
Acquisition of North America data analytics boutique Rel8ed

On January 30, 2023, Coface announced the acquisition of North American data analytics boutique Rel8ed. The acquisition brings new, rich data sets and analytics capabilities, which will benefit Coface trade credit insurance as well as the company’s business information customers and teams.

Note 41Risk management

The sections which are an integral part of the Group’s financial statements relating to risk management are presented in the sections of Chapter 5 of paragraph 5.1 “Risk management and internal control” and 5.2 “Risk factors”.

4.3Parent company financial statements

4.3.1Balance sheet

Assets

(in thousands of euros)

Notes

Dec. 31, 2022

Dec. 31, 2021

Fixed assets


Intangible assets

4.1.1

-

-

Financial assets


-

-

Interests in related companies

4.1.2

1,502,744

1,502,744

Loans to affiliates and subsidiaries

4.1.3

465,466

324,074


1,968,211

1,826,819

Current assets


French government and other authorities


3,850

9,775

Group and Subsidiaries Tax


0

0

Coface current account


708,498

565,310

Miscellaneous receivables


8,391

8,590


4.1.4

720,739

583,675

Investment securities


Treasury shares

4.1.5

10,900

10,448

Cash at bank and in hand

4.1.6

1,243

784

Prepaid expenses

4.1.7

589

1,106


733,472

596,012

Deferred charges

4.1.8

230

660

Loan repayment premiums

4.1.9

3,681

385

Foreign exchange assets


6,816

503

Total assets


2,712,409

2,424,379

Equity and liabilities

(in thousands of euros)

Notes

Dec. 31, 2022

Dec. 31, 2021

Equity


Capital


300,360

300,360

Share capital premiums


723,517

810,385

Other reserves


31,450

86,387

Income for the year


326,480

82,223


4.2.1-4.2.2

1,381,806

1,279,355

Provisions for liabilities and charges

4.2.3


Provision for liabilities


6,816

503

Provision for charges


5,859

5,745


12,675

6,248

Debts


Bank borrowings and debts (1)


614,343

564,783

Other bond issues


538,770

391,930

Sundry borrowings and debts


150,201

150,201

Coface current account


0

21,398

Trade notes and accounts payable


3,414

1,999

Tax and social security liabilities


0

0

Other payables


0

0

Group and Subsidiaries Tax


4,280

7,941


4.2.4

1,311,008

1,138,252

Foreign currency translation reserve – liabilities


6,920

523

Total equity and liabilities


2,712,409

2,424,379

  • Within 1,476 thousand of euros – accruals of interests.


4.3.2Income statement

(in thousands of euros)

Notes

Dec. 31, 2022

Dec. 31, 2021

Operating income (I)


4,654

1,043

Rebilled expenses and other income


4,654

1,043

Reversals of provisions and expense transfers


0

0

Operating expenses (II)


9,193

3,855

Other purchases and external expenses


5,245

2,660

Income tax, taxes, and similar payments


0

13

Employee-related expenses


0

0

Other expenses


3,518

851

Depreciation and amortisation


430

330

Operating income (I-II)

5.1

(4,539)

(2,811)

Financial income (III)


373,694

107,128

Investment income


347,862

83,773

Other financial income


25,330

18,622

Reversal of provision for exchange


503

4,733

Financial expenses (IV)


43,382

23,695

Interest and similar expenses


36,566

23,192

Charges for FX losses


6,816

503

Financial income (III-IV)

5.2

330,312

83,433

Non-recurring income (V)


0

2

On capital transactions


0

0

On management transactions


0

2

Non-recurring expenses (VI)

5.3

38

96

On capital transactions


0

0

On management transactions


38

96

Non-recurring income (V-VI)


(38)

(93)

Income tax (income)

5.4

745

1,695

Net income for the year


326,480

82,223

4.4Notes to the parent company financial statements

Note 1Significant events
Changes in Governance
Board of Directors

On May 17, 2022, during the Combined General Meeting, Laetitia Léonard-Reuter and Laurent Musy were elected as independent directors for terms of four years. These appointments follow the expiration of the terms of office of Olivier Zarrouati and Éric Hémar, respectively.

Thus, at the close of the General Meeting, the Board of Directors was made up of 10 members – five women and five men – the majority (six) of whom are independent directors.

Executive Committee

On May 2, 2022, Hugh Burke was appointed as the CEO of Coface Asia-Pacific, effective on April 1, 2022. He joins the Group Executive Committee and reports to Xavier Durand, Coface CEO. He takes over from Bhupesh Gupta.

On September 8, 2022, Matthieu Garnier, Group Information Services Director, joined the Group Executive Committee and will continue to report to Thibault Surer, Group Strategy & Development Director. This decision is part of our strategy to develop information services, one of the major pillars of our Build to Lead plan.

Natixis announces the sale of its residual stake in COFACE SA

On January 6, 2022, Natixis announced the sale of its remaining interest in COFACE SA. This sale represented approximately 10.04% of COFACE SA’s share capital, or 15,078,095 shares. The sale was carried out through an ABB (accelerated book-building) at an average price of €11.55. Following this transaction, Natixis no longer holds any shares in COFACE SA.

Success of the debt management exercise

On September 21, 2022, COFACE SA announced the results of the tender offer to repurchase €380 million in guaranteed subordinated notes bearing a fixed interest rate of 4.125%, maturing on March 27, 2024. The Company accepted the repurchase of a principal amount of €153.4 million of notes validly tendered at a fixed purchase price of 103.625%.

COFACE SA also announced the issuance on September 22, 2022 of €300 million in Tier 2 notes bearing a fixed interest rate of 6.000%, maturing on September 22, 2032.

This repurchase of subordinated debt followed by the issuance of new debt meant that COFACE was able to call its 2024 debt ahead of schedule and extend the maturity of the Group’s subordinated debt to 2032, thereby improving its financial strength and solvency.

Note 2Accounting principles
Accounting principles and policies

The financial statements for the year ended have been prepared in accordance with generally accepted accounting principles and the French General Chart of Accounts (Regulation ANC No. 2014-03 of the Accounting Regulation Committee in accordance with the principles of prudence and business continuity).

Financial assets

Equity securities are reported in the balance sheet at cost. A depreciation is recorded when the realisable value (determined according to the restated equity, income, future outlook and value in use for the Company) is less than the acquisition value. The realisable value is determined using a number of indicators (revalued equity, expected results generated by holdings, future outlook, value in use).

The value in use is determined using the discounted cash flow method. Cash flow projections were derived from the three-year business plans drawn up by the Group’s operating entities as part of the budget process and approved by Coface Group management.

These projections are based on the past performance of each entity and take into account assumptions relating to Coface’s business line development. Coface draws up cash flow projections beyond the period covered in its business plans by extrapolating the cash flows over two additional years.

The assumptions used for growth rates, margins, cost ratios and claims ratios are based on the entity’s maturity, business history, market prospects, and geographic region.

Under the discounted cash flow method, Coface applies a discount rate to insurance companies and a perpetuity growth rate to measure the value of its companies.

Receivables and payables are valued at their face value. They are depreciated through a provision to account for potential collection difficulties.

Issuing charges

According to the French General Chart of Accounts (Article 361-2), the costs linked to the hybrid debt issued must, in principle, be distributed according to the characteristics of the loan. These costs were recorded in deferred charges and amortised on a straight-line basis for the term of the loan, i.e. 10 years.

Consistency of methods

The annual financial statements are comparable to those of the previous year (consistency of accounting methods and time period principle).

The balance sheet, income statement and notes are expressed in euros.

Note 3Other disclosures
a)Tax consolidation group

On January 1, 2015, COFACE SA opted for the tax consolidation regime by consolidating French subsidiaries that are more than 95% owned, whether directly or indirectly (Compagnie française d’assurance pour le commerce extérieur, Cofinpar, Cogeri and Fimipar).

The tax consolidation agreements binding the parent company to its subsidiaries are all strictly identical and stipulate that:

  • each company shall calculate its tax as if there were no tax consolidation, and the parent company alone shall be liable for the payment of corporate income tax;
  • the parent company shall recognise tax savings in income and shall not reallocate them to subsidiaries unless the subsidiary leaves the Group.

The option is valid for five years starting from January 1, 2015 with tacit renewal of the option every five years.

b)Staff and managers

COFACE SA has no staff on its payroll and has no pension commitment.

c)Off-balance sheet commitments
  • Commitments received: 
    • €700 million
    • It is about a syndicated loan with seven banks (Société Générale, Natixis, CACIB, BNP Paribas, HSBC, BRED and La Banque Postale), undrawn at December 31, 2022.
    • €226,6 million
    • It is a joint guarantee given by Compagnie Française d’assurance pour le commerce extérieur to the benefit of investors in the subordinated debt (maturity 10 years)
  • Commitments given: €1,542 million.

COFACE SA has given a joint and several guarantee to Coface Finanz, a company indirectly owned by COFACE SA, in respect of amounts due from Coface Poland Factoring in repayment of the loan granted to the latter, up to a maximum of €500 million. This joint and several guarantee has never been exercised since 2012.

COFACE SA has issued a joint and several guarantee to cover the commitments of Coface Finanz and Coface Poland Factoring in respect of the bilateral lines of credit taken out with ten banks. €1,042 million as of December 31, 2022 (€739 million in 2021). This joint and several guarantee has never been exercised.

Note 4Analysis of the main balance sheet items (in euros)
4.1Assets
4.1.1Intangible assets

No intangible assets have been booked in the accounts as of December 31, 2022.

4.1.2Interests in related companies and companies with capital ties

Related companies 
(in thousands of euros)

Dec. 31, 2021

Acquisitions

Disposals

Dec. 31, 2022

Compagnie française d’assurance pour le commerce extérieur

1,337,719


1,337,719

Coface Re

165,025


165,025

Total

1,502,744


1,502,744

4.1.3Loans to affiliates and subsidiaries

Related companies 
(in thousands of euros)

Amount

Interest

Total

Compagnie française d’assurance pour le commerce extérieur (end 2024)

187,000

6,000

193,000

Compagnie française d’assurance pour le commerce extérieur (end 2032)

268,000

4,466

272,466

Total

455,000

10,466

465,466

On March 27, 2014, COFACE SA granted a subordinated intragroup loan to Compagnie française d’assurance pour le commerce extérieur in the amount of €314 million, maturing on March 26, 2024 (10 years) and bearing annual interest at 4.125%, payable at the anniversary date each year. This loan was partially reimbursed (€127 million) in September 2022.

A new loan of €268 million was granted on the same day (September 22, 2022) for 10 years, at an annual interest rate of 6.000%.

4.1.4Other receivables

(in thousands of euros)

Dec. 31, 2022

Up to 1 year

From 1 to 5 years

Dec. 31, 2021

French government and other authorities

3,850

3,850

0

9,775

Coface current account

708,498

708,498

0

565,310

Coface Poland EUR current account

226

226

0

250

Coface Finanz EUR current account

509,926

509,926

0

463,501

Coface Finanz USD current account

108,938

108,938

0

101,559

Compagnie Française d’assurance pour le commerce extérieur EUR current account

89,408

89,408

0

0

Miscellaneous receivables

8,391

5,221

3,169

8,590

Group and Subsidiary in tax consolidation

0

0

0

0

Natixis liquidity agreement

2,519

2,519

0

2,529

Other receivables

5,872

2,702

3,169

6,060

Other receivables

720,739

717,569

3,169

583,675

The “other receivables” item in miscellaneous receivables primarily consists of:

  • expenses of €5,858,694 to be rebilled in connection with the award of bonus shares;
  • costs of €2,519,131 related to the ODDO mandate share buyback.
4.1.5Treasury shares

Number of shares held

Dec. 31, 2021

Acquisitions

Disposals

Dec. 31, 2022

Liquidity agreement

84,441

3,071,539

3,045,543

110,437

Bonus share awards

1,063,069

300,000

357,388

1,005,681

Share buyback plan

0

0

0

0

Total

1,147,510

3,371,539

3,402,931

1,116,118

Liquidity agreement

With effect from July 7, 2014, Coface appointed Natixis to implement a liquidity agreement for COFACE SA shares traded on Euronext Paris, in accordance with the charter of ethics of the French financial markets’ association (Association française des marchés financiers – AMAFI) dated March 8, 2011 and approved by the AMF on March 21, 2011.

The Group had allocated €5 million (reduced by €2 million in 2017) to the liquidity account for the purposes of the agreement, which is for a period of 12 months and has been renewed by tacit agreement annually in July since 2015.

The liquidity agreement is part of the share buy-back programme decided by the Board of Directors’ meeting of June 26, 2014. The liquidity agreement dated July 2, 2014, originally concluded with Natixis, was transferred as of July 2, 2018 to ODDO BHF for a term of twelve (12) months, automatically renewable.

Bonus share award

Since its IPO in 2014, the Coface Group has granted bonus shares to certain corporate officers or employees of COFACE SA subsidiaries.

In 2022, the Board of Directors decided to grant 320,849 free shares. This allocation completes the 2020 and 2021 plans, for which 312,200 and 408,403 shares were allocated respectively.

The 2018 plan was not allocated because the objectives were not met.

Under French standards, the acquisition of shares under a bonus share award constitutes a component of remuneration. The provision should be recognised in staff costs by crediting the line item “Provisions for expenses” and be spread out, where delivery of the shares is conditional upon the beneficiaries working for the Company at the end of a future period set by the plan.

Accordingly, this charge will be recognised in the accounts using the acquisition price spread over the vesting period, namely three years. As COFACE SA did not acquire sufficient shares, it must also take into consideration the number of missing shares multiplied by the share price on the last day of the financial year to calculate the amount of this charge. At the end of 2022, the “Provision for charges” amounted to €5,858,694.

At December 31, 2022, the Group’s treasury shares had a gross and net value of €10,900,420 broken down as follows:

  • liquidity agreement: €1,327,453;
  • bonus share award: €9,572,967.
4.1.6Cash at bank and in hand

(in thousands of euros)

Dec. 31, 2022

Dec. 31, 2021

Natixis

1,243

784

4.1.7Prepaid expenses

(in thousands of euros)

Dec. 31, 2022

Dec. 31, 2021

Expenses related to the syndicated loan

589

1,106

4.1.8Deferred charges

(in thousands of euros)

Gross 2022

Amortisation

Net 2022

Expenses linked to subordinated debt

660

430

230

Deferred charges include costs linked to the issuance of the subordinated debt in 2014 amortised over a period of 10 years.

The residual term at December 31, 2022 is one year and three months.

4.1.9Loan reimbursement premiums

(in thousands of euros)

Gross 2022

Amortisation

Net 2022

Premium linked to subordinated debt (end 2024)

385

251

134

Premium linked to subordinated debt (end 2032)

3,647

100

3,547

Total

4,032

351

3,681

The premium linked to subordinated debt is amortised over ten years.

The residual term at December 31, 2022 is one year and three months for the first loan taken out in March 2014.

It is nine years and nine months for the second loan.

4.2Liabilities
4.2.1Changes in equity

(in euros)

Dec. 31, 2021

Appropriation of earnings

Transactions for the year

Distribution

Income for the year

Dec. 31, 2022

Share capital (NV = €2)

300,359,584


300,359,584

Number of shares

150,179,792


150,179,792

Share premium

810,384,842


(86,867,669)


723,517,174

Legal reserve

31,449,646


31,449,646

Other reserves

0


0

Retained earnings

54,937,672

82,223,318


(137,160,990)


0

Income for the year

82,223,318

(82,223,318)


326,479,873

326,479,873

Total

1,279,355,062

0

0

(224,028,659)

326,479,873

1,381,806,276

COFACE SA’s total equity stands at €1,381,806,276.

The share premiums are made up of contribution premiums and issue premiums (including €471,744,696 in unavailable premiums) and share issuance rights in the amount of €15,725.

In accordance with the vote held at the Annual Shareholders’ Meeting of May 17, 2022, €82,223,318 of 2021’s income were allocated to retained earnings.

It was decided to distribute a dividend of €224,028,659 by drawing on retained earnings and share premiums.

4.2.2Composition of capital

Shareholders

Dec. 31, 2022

Dec. 31, 2021

Financial market and other

68.6%

102,990,329

58.8%

88,247,383

Arch Capital Group

29.9%

44,849,425

29.9%

44,849,425

Natixis

0.0%

0

10.0%

15,078,051

Group Employee funds

0.8%

1,223,920

0.6%

857,423

Treasury shares

0.7%

1,116,118

0.8%

1,147,510

Number of shares


150,179,792


150,179,792

Nominal value (in euros)


2


2

4.2.3Provisions for liabilities and charges

(in thousands of euros)

Dec. 31, 2021

Additions

Reversals

Dec. 31, 2022

Provision for FX losses

503

6,816

(503)

6,816

Provision for bonus share award

5,745

5,859

(5,745)

5,859

Total

6,248

12,675

(6,248)

12,675

4.2.4Debts

(in thousands of euros)

Up to 1 year

From 1 to 5 years

More than 5 years

Dec. 31, 2022

Dec. 31, 2021

Bank borrowings and debts

614,343


614,343

564,783

Commercial paper: discounted fixed rate

615,819


615,819

564,491

CP accrued interest

(1,476)


(1,476)

292

Other bond issues

12,170

226,600

300,000

538,770

391,930

Subordinated bonds


226,600

300,000

526,000

380,000

Accrued interest

12,170


12,170

11,930

Sundry borrowings and debts

201

150,000


150,201

150,201

Coface borrowing (Compagnie française d’assurance 

pour le commerce extérieur)


150,000


150,000

150,000

Accrued interest on Coface borrowing

201


201

201

Coface cash advance and accrued interest

0


21,398

Trade notes and accounts payable

3,414


3,414

1,999

Tax and social security liabilities

0


0

0

Other debts

4,280


4,280

7,941

Total debts

634,408

376,600

300,000

7,941

1,138,252

After approval by the Banque de France on November 6, 2012, COFACE SA issued €250 million in commercial paper (with a maturity of one to three months) on November 13, 2012. The amount raised was fully loaned to Coface Finanz through a cash agreement and all fees incurred were recharged.

The programme’s maximum amount has been increased several times and stands at €700 million as of December 31, 2022.

At the end of 2022, the EUR and USD portions were €508 million and $115 million respectively, equivalent to €614.3 million in total.

On March 27, 2014, COFACE SA completed the issue of subordinated debt in the form of bonds for a nominal amount of €380 million (corresponding to 3,800 bonds with a nominal unit value of €100,000), maturing on March 27, 2024 (10 years), with an annual interest rate of 4.125%.

In December 2014, COFACE SA borrowed €110 million at a rate of 2.30% over a period of 10 years from Compagnie française d’assurance pour le commerce extérieur for the acquisition of Coface Re, followed in June 2015 by a second tranche of €40 million in order to send additional funds to Coface Re (see Note 4.1.2).

For the year ended December 31, 2022, the Group’s financing liabilities, totalling €538.8 million, correspond to:

  • a fixed rate subordinated note (4.125%) issued on March 27, 2014 by COFACE SA for a nominal amount of €380 million and maturing on March 27, 2024.
  • The securities are irrevocably and unconditionally guaranteed on a subordinated basis by Compagnie française d’assurance pour le commerce extérieur, the Group’s main operating entity.
  • COFACE SA also completed a tender offer on September 21, 2022 to repurchase its guaranteed subordinated notes issued in 2014, for an amount of €153.4 million, at a fixed purchase price of 103.625%.
  • The nominal amount after the tender offer is now €226.6 million, still maturing on March 27, 2024;
  • a new issuance on September 22, 2022 of €300 million in subordinated notes at a fixed interest rate of 6.000%, maturing on September 22, 2032.

Rating agency update:

  • on October 11, 2022, Moody’s confirmed Coface’s A2 financial soundness rating (IFS) and raised the outlook for this rating to positive;
  • on November 23, 2022, Fitch confirmed Coface’s Insurer Financial Strength (IFS) rating of ‘AA-’. The outlook remains stable;
  • on April 4, 2022, AM Best confirmed its ‘A’ (Excellent) financial soundness rating (FSR) for Compagnie française d’assurance pour le commerce international (the Company) and Coface Re. These ratings are accompanied by a “stable” outlook.
Note 5Analysis of the main income statement items
Operating income

(in thousands of euros)

Dec. 31, 2022

Dec. 31, 2021

Operating income

4,654

1,043

Commercial paper structuring costs


Rebilling of insurance

1,563

598

Other income

3,091

445

Operating expenses

(9,193)

(3,855)

Other purchases and external expenses

(5,239)

(2,660)

Statutory Auditors’ fees

(2,210)

(969)

Insurance Policy

(1,529)

(592)

Other Fees

(835)

(716)

Financial Information

(217)

(8)

Legal advertising costs

0

(4)

Bank fees

0

0

Marsh Insurance

0

0

JP Morgan Fees

0

0

Fees and commissions on services

(440)

(371)

Expenses related to the issuance of subordinated debt

0

0

Reception fees

(7)

0

Royalty fee

0

0

Income tax, taxes, and similar payments

(6)

(13)

Employee-related expenses

0

0

Social security charges on attendance fees

0

0

Other expenses

(3,518)

(851)

Attendance fees

(427)

(406)

Expenses linked to the bonus share award

(3,091)

(445)

Depreciation and amortisation

(430)

(330)

Amortisation of costs linked to subordinated debt

(430)

(330)

Operating income

(4,539)

(2,811)

The “Statutory Auditors’ fees” item of €2,210,427 is entirely comprised of statutory audit fees.

Financial income

(in thousands of euros)

Dec. 31, 2022

Dec. 31, 2021

Financial income

373,694

107,128

Income from shares

347,862

83,773

Dividend

347,862

83,773

Other financial income

25,330

18,622

Loan interest

16,601

12,970

Interests linked to the CP programme and syndicated loan

6,527

3,461

Income on guarantees

1,714

1,377

Foreign exchange product

206

35

Income of liquidity contract

281

779

Reversal of provision for exchange

503

4,733

Financial expenses

(43,382)

(23,695)

Interest and similar expenses

(36,566)

(23,192)

Fees and commissions linked to the CP programme

(6,530)

(2,872)

Interest on bond loan

(24,639)

(15,849)

Interest on borrowings

(3,450)

(3,450)

Others financial costs

(713)

(63)

Interest on cash advance

0

0

Foreign exchange loss

(206)

(6)

Guarantee expenses

(676)

(760)

Depreciation on redemption premiums

(351)

(192)

Charges for FX losses

(6,816)

(503)

Financial income

330,312

83,433

The amount of dividends is made up of dividends received from Compagnie française pour le commerce extérieur in the amount of €299,893,690 and from COFACE RE in the amount of €47,967,832.

Financial expenses are mainly composed of interest on:

  • the subordinated bond issue in the amount of €380 million. €153.4 million of this loan was repaid in September 2022, and the remaining balance is €226.6 million as a result. A redemption premium of €5.561 million and a coupon of €3.164 million were paid;
  • the new €300 million subordinated loan taken out on September 22, 2022 for ten years;
  • the €150 million loan taken out at the end of 2014 with Compagnie française d’assurance pour le commerce extérieur.
Non-recurring income

(in thousands of euros)

Dec. 31, 2022

Dec. 31, 2021

Non-recurring income

0

2

Miscellaneous

0

2

Non-recurring expenses

(38)

96

Miscellaneous

(38)

96

Total

(38)

(93)

Income tax

(in thousands of euros)

Dec. 31, 2022

Dec. 31, 2021

Accounting income before income tax

325,735

80,528

Deductions:

(354,174)

(92,242)

  • dividend (parent/subsidiary regime)

(347,862)

(83,773)

  • foreign currency translation reserve – liabilities

0

(4,239)

  • foreign currency translation reserve – assets

(6,313)

0

  • provision for exchange

0

(4,229)

Reintegrations:

18,107

5,426

  • share of costs 1% on Group dividend

2,999

748

  • share of costs 5% on Group dividend

2,398

449

  • foreign currency translation reserve – assets

6,313

4,229

  • foreign currency translation reserve – liabilities

6,396

0

Taxable income

(10,333)

(6,287)

  • Corporate tax (rate 33 1/3%)

0

0

  • 3% tax on dividends paid to external (outside the tax consolidation Group)

0

0

Corporate tax before tax consolidation

0

0

Net income from consolidated companies

(745)

(1,695)

Corporate income tax (income)

(745)

(1,695)

The application of the tax consolidation agreement resulted in a consolidation gain of €744,811 for financial year 2022, compared to a gain of €1,695,116 in 2021.

Statutory Auditors’ fees

This information is available in the Coface Group consolidated financial statements as at December 31, 2022, in Note 35.

Note 6Information regarding related companies

The table below presents all items regarding related companies:

(in thousands of euros)

Dec. 31, 2022

Dec. 31, 2021

Balance Sheet – Assets

2,682,459

2,397,748

Interests in related companies

1,502,744

1,502,744

Loans to affiliates and subsidiaries

465,466

324,074

Compagnie française current account

89,408


Coface Finanz current account

618,864

565,060

Coface Poland Factoring current account

226

250

Rebilling of LTIP

5,750

5,620

Cash at bank and in hand


784

Prepaid expenses


Balance Sheet – Equity & Liabilities

154,481

179,540

Sundry borrowings and debts

150,201

150,201

Coface cash advance and accrued interest

0

21,398

Group and Subsidiaries Tax

4,280

7,941

Income statement

370,933

94,742

Operating income

4,654

1,043

Operating expenses

0


Financial income

371,436

99,538

Financial expenses

(5,156)

(5,839)

Note 7Subsidiaries and interests


Year 2022

Turnover

Net earnings
 or loss

Dividends received or recognised
by the Company

Exchange rate Dec. 31, 2022

(in €)

Compagnie française pour le commerce extérieur*

1, place Costes et Bellonte

92270 Bois-Colombes

1,397,247,396

112,919,807

299,893,690

1

Coface Re SA*

Rue Bellefontaine 18

1003 Lausanne – Switzerland

773,595,590

68,363,751

47,967,832

0,9842

* Unaudited accounts, currently in the process of certification.


As of Dec. 31, 2022

Share capital

Reserves and retained earnings

Share of capital held

Value of
 securities held

Outstanding loans and advances granted by the Company

Gross

Net

(in €)

(in currency)

% (reported)

(in €)

Compagnie française d’assurance pour le commerce extérieur*

1, place Costes et Bellonte

92270 Bois-Colombes

137,052,417

2,338,000

99.5%

1,337,719,300

1,337,719,300

150,201,250

Coface Re SA*

Rue Bellefontaine 18

1003 Lausanne – Switzerland

8,320,542

276,706,000

100%

165,025,157

165,025,157

0

* Unaudited accounts, currently in the process of certification.

Note 8Events after the reporting period
Acquisition of North America data analytics boutique Rel8ed

On January 30, 2023, Coface announced the acquisition of North American data analytics boutique Rel8ed. The acquisition brings new, rich data sets and analytics capabilities, which will benefit Coface trade credit insurance as well as the Company’s business information customers and teams.

4.5Five-year summary of Company results

SA SDGP 41 was incorporated on March 23, 2000 and became COFACE SA (at the EGM held on July 26, 2007).

Details (in euros)

FY 2018

FY 2019

FY 2020

FY 2021

FY 2022

I – Year-end Capital


a) Share capital

307,798,522

304,063,898

304,063,898

300,359,584

300,359,584

b) Number of issued shares

153,899,261

152,031,949

152,031,949

150,179,792

150,179,792

c) Number of bonds convertible into shares

-

-

-

-

-

II – Operations and income for the year


a) Revenue excluding tax

358,946

2,477,628

3,734,093

1,043,302

4,653,864

b) Income before tax, depreciation, amortisation and provisions

123,473,002

132,968,042

(17,758,389)

80,528,202

325,735,062

c) Income tax

(1,115,937)

(978,886)

1,179,988

1,695,116

744,811

d) Income after tax, depreciation, amortisation and provisions

122,604,984

132,677,046

(18,938,377)

82,223,318

326,479,873

e) Distributed profits

122,332,846 (1)

(2)

82,900,339 (3)

225,269,688 (4)

226,576,784 (5)

of which interim dividends


III – Earnings per share


a) Income after tax, but before depreciation, amortisation and provisions

0.81

0.88

0.12

0.54

2.17

b) Income after tax, depreciation, amortisation and provisions

0.80

0.87

0.12

0.55

2.17

c) Dividend paid to each share

0.79

-

0.55

1.50

1.52

IV – Personnel


a) Average number of employees in the year

-

-

-

-

-

b) Payroll amount

-

-

-

-

-

c) Amount of sums paid in employee benefits

-

-

-

-

-

  • For 2018, a distribution of €0.79 per share, i.e. €122,332,846 (€119,423,806 excluding treasury shares), was distributed as voted by the Annual Shareholders’ Meeting of May 16, 2019.
  • In view of the scale of the public health crisis and following the vote at the Combined General Meeting of May 14, 2020, it was decided not to pay a dividend in respect of the financial year ending December 31, 2019
  • For 2020, a distribution of €0.55 per share, i.e. €82,900,339 (€81,976,242 excluding treasury shares), was distributed as voted by the Annual Shareholders’ Meeting of May 12, 2021.
  • For 2021, a distribution of €1.50 per share, i.e. €225,269,688 (€224,028,658 excluding treasury shares), was distributed as voted by the Annual Shareholders’ Meeting of May 17, 2022.
  • For 2022, a distribution of €1.52 per share, i.e. €226,576,784, will be submitted to the Annual Shareholders’ Meeting of May 16, 2023.

4.6Other disclosures

Pursuant to Article D.441-6 of the French Commercial Code, the table below sets out the payment terms of COFACE SA’s suppliers showing bills received and not paid at the end of the financial year for which payment is in arrears:

Suppliers’ payment terms


1 to 30 days

31 to 60 days

61 to 90 days

91 days or more

Total (1 day or more)

(A) Late payment tranches


Number of bills affected

-

-

-

-

-

Total amount of bills affected including VAT (in €k)

-

-

-

-

-

Percentage of total amount of purchases during the financial year

-

-

-

-

-

(B) Bills excluded from (A) relating to disputed or unrecognised liabilities and receivables

No bills excluded from these tables relating to disputed or unrecognised liabilities and receivables.

(C) Reference payment terms used (contractual or legal term – Article L.441-6 or Article L.443-1 of the French Commercial Code)

No invoices are overdue.

4.7Statutory auditors' report on the consolidated financial statements

This is a translation into English of the statutory auditors’ report on the financial statements of the Company issued in French and it is provided solely for the convenience of English speaking users.

This statutory auditors’ report includes information required by French law, such as information about the appointment of the statutory auditors or verification of the management report and other documents provided to shareholders.

This report should be read in conjunction with, and construed in accordance with, French law and professional auditing standards applicable in France.

For the year ended December 31, 2022

To the Annual General Shareholder’s Meeting of COFACE S.A.

Opinion

In compliance with the engagement entrusted to us by your Annual General Meeting, we have audited the accompanying consolidated financial statements of COFACE SA. for the year ended December 31, 2022. 

In our opinion, the consolidated financial statements give a true and fair view of the assets and liabilities and of the financial position of the Group as at December 31, 2022 and of the results of its operations for the year then ended in accordance with International Financial Reporting Standards as adopted by the European Union.

The audit opinion expressed above is consistent with our report to the Audit and accounts committee.

Basis for Opinion
Audit Framework

We conducted our audit in accordance with professional standards applicable in France. We believe that the audit evidence we have obtained is sufficient and appropriate to provide a basis for our opinion.

Our responsibilities under those standards are further described in the "Statutory Auditors' Responsibilities for the Audit of the Consolidated Financial Statements" section of our report.

Independence

We conducted our audit engagement in compliance with independence requirements of the French Commercial Code (code de commerce) and the French Code of Ethics (code de déontologie) for statutory auditors, for the period from January 1, 2022 to the date of our report and specifically we did not provide any prohibited non-audit services referred to in Article 5(1) of Regulation (EU) No 537/2014.

Justification of Assessments - Key Audit Matters

In accordance with the requirements of Articles L. 823-9 and R. 823-7 of the French Commercial Code (code de commerce) relating to the justification of our assessments, we inform you of the key audit matters relating to risks of material misstatement that, in our professional judgment, were of most significance in our audit of the consolidated financial statements of the current period, as well as how we addressed those risks.

These matters were addressed in the context of our audit of the consolidated financial statements as a whole, approved in the conditions mentioned above, and in forming our opinion thereon, and we do not provide a separate opinion on specific items of the consolidated financial statements.

Estimation of provisions for late claims

Identified Risk


Our response

Provisions for unknown claims represent an estimation of the claims expense incurred during the year but not yet reported at the balance sheet date. They also include specific provisions recorded for claims that have not yet been proven but whose probability of occurrence is high and for which the compensation that would potentially be paid would be significant. These provisions also include a recovery reserve, assessed separately, corresponding to the amounts that will ultimately be recovered by the group for these claims.

As at December 31, 2022, these provisions amounted to €980 million in the consolidated financial statements. As indicated in the section accounting principles – Insurance operations of the notes to the Consolidated Financial Statements, these provisions are determined on the one hand by the application of deterministic statistical methods on the basis of historical data and on the other hand, by the use of assumptions arising from expert judgment to estimate the final amount of the claim (corresponding to the costs borne until the end of the claim lifecycle). The recovery reserve is determined by applying an ultimate rate to all unsettled underwriting years.

Thus, as the provision for unknown claims includes accounting estimates with a high degree of uncertainty, we considered this aggregate as a key audit matter.


To assess the reasonableness of the estimation of the provision for late claims and based on information communicated to us, we implemented the following approach:

Works carried out at central team level:

  • We assessed the relevance of the method used to determine the ultimate claims charge, in conjunction with our actuaries;
  • We identified the risk related to the evaluation of provisions for late claims as a significant risk in the set of instructions communicated to auditors of in-scope entities and we reviewed their conclusions.

Work carried out at the level of each entity included in the audit scope:

  • We reviewed the internal control framework implemented to estimate provisions for claims and the expected ultimate cost of claims, and we tested the design and the implementation;
  • We assessed the relevance of methods and actuarial parameters used, as well as assumptions that were retained with regards to the applicable regulation, market practices, and the entity's economic and financial context.
  • We assessed any changes in claims indemnification processes and procedures that could affect the assumption of reproducibility of the past in the future and we drew the consequences on assumptions used to calculate the ultimate cost of claims; 
  • We tested the reliability of underlying claims data used in the actuarial calculations;
  • We performed an independent recalculation, when needed, and for some business lines we verified that Group methodology was correctly applied;
  • We analyzed the retrospective review of technical provisions by comparing provisions from the opening balance with actual claims.
Measurement of Insurance business investments

Identified Risk


Our response

Insurance business investments account for one of the most important items on the consolidated balance sheet. At December 31, 2022, the net book value of these investments amounts to 3 022 million euros. 

As indicated in the section accounting principles standards – Financial Assets, rules and methods of the notes to the Consolidated financial statements, the insurance business investments are determined at the end of the financial year, based on their classification associated with the management intention selected for each line of security by the Group.

A level of judgment is required to determine this measurement for: 

  • Impairment tests realized by the Management and
  • the valuation of unlisted securities, in particular non-consolidated equity investments and shares in SCI / SCPI (Real Estate Investment trust).

Given the amount involved and the judgment made by the Management to detect the impairment of the securities in the portfolio, we deemed this to be a key audit matter.


To assess the measurement of the insurance business investment, our audit work consisted mainly in verifying that the valuation used by the Management were based on an appropriate valuation method and quantified elements used, according to the type of security:

For market-based valuations:

  • We verified the stock prices used.

For evaluations based on forecast elements:

  • We obtained and analyzed business plans established by the Management and assessed the relevance and the justification of the assumptions made;
  • We verified the consistency of the main assumptions used with the economic environment;
  • We compared the consistency of the forecasts retained for the previous periods with the corresponding outcomes on a sample of assets; 
  • We compared the underlying documentation to the impairment evidences, and we validated the numbers in the aforementioned documentation referring to external sources.
Estimation of provisions for earned premiums not written - EPNW

Identified Risk


Our response

As at December 31, 2022, earned premiums not written amounted to € 132 million in the financial statements at December 31, 2022.

As indicated in the section Accounting principles standards - Insurance operations, rules and methods of the notes to the financial statements, earned premiums not written are determined based on an estimate of expected premiums over the period. The provision is the difference between this estimate, and invoiced premiums.

This provision presents a significant risk of material misstatement given inherent uncertainties in some elements considered in the estimates. The risk particularly lies in the factors used to determine the ultimate value (i.e. once premiums would been written for their final amount) which relies on statistical methods.

Thus, we consider this to be a key audit matter even though the change in the provision from one year to the another is generally limited.


In order to assess whether the earned premiums not written estimation was reasonable and based on information communicated to us, we implemented the following audit approach:

Works carried out at central team level:

  • We assessed the relevance of the method used by Coface to determine ultimate premiums;
  • We identified the risk related to the evaluation of earned premiums not written as a significant risk in the set of instructions communicated auditors of in-scope entities and we reviewed their conclusions.

Work carried out at the level of each entity included in the audit scope:

  • We reviewed the internal control framework related to premium estimation process and we tested the design and the implementation;
  • We assessed any changes in the invoicing processes and procedures that could affect the assumption of reproducibility of the past in the future and we drew the consequences on the assumptions used for the calculation of the ultimate value;
  • We verified the consistency of assumptions used to determine the forecasts;
  • We reconciled calculation bases with accounting figures;
  • We compared earned premiums not written booked in the opening balance of the financial year with actual results to assess the relevance of the implemented method.
Specific Verifications

We have also performed, in accordance with professional standards applicable in France, the specific verifications required by laws and regulations of the information pertaining to the Group presented in the management report.

We precise that it is not our role to report the matters related to the sincerity and the concordance with the consolidated financial statements of Solvency II information extracted from the report required under the article L.356-23 of the insurance code (code des assurances).

We have no matters to report as to its fair presentation and its consistency with the consolidated financial statements.

We attest that the consolidated declaration of extra-financial performance, required under Article L.225-102-1 of the French Commercial Code (code de commerce), is included in the Group management report, it being specified that, in accordance with the provisions of Article L.823-10 of the code, we have not verified the fair presentation and the consistency with the consolidated financial statements of the information provided in this declaration and this information must be reported by an independent third party.

Other Legal and Regulatory Verifications or Information
Format of presentation of the consolidated financial statements intended to be included in the annual financial report

We have also verified, in accordance with the professional standard applicable in France relating to the procedures performed by the statutory auditor relating to the annual and consolidated financial statements presented in the European single electronic format, that the presentation of the consolidated financial statements intended to be included  in the annual financial report mentioned in Article L. 451-1-2, I of the French Monetary and Financial Code (code monétaire et financier), prepared under the responsibility of the Chief Executive Officer, complies with the single electronic format defined in the European Delegated Regulation No 2019/815 of 17 December 2018. As it relates to consolidated financial statements, our work includes verifying that the tagging of these consolidated financial statements complies with the format defined in the above delegated regulation. 

Based on the work we have performed, we conclude that the presentation of the consolidated financial statements intended to be included in the annual financial report complies, in all material respects, with the European single electronic format.

Due to the technical limitations inherent to the block-tagging of the consolidated financial statements according to the European single electronic format, the content of certain tags of the notes may not be rendered identically to the accompanying consolidated financial statements.

Moreover, we have no responsibility to verify that the consolidated financial statements that will ultimately be included by your company in the annual financial report filed with the AMF are in agreement with those on which we have performed our work.

Appointment of the Statutory Auditors

We were appointed as statutory auditors of COFACE SA by the Annual General Meeting, on May 14, 2020 for Mazars and on May 3, 2007 for Deloitte & Associés. The previous auditors were Deloitte & Associés or another entity of the Deloitte network, whose original appointment details could not be determined. 

As at December 31, 2022, Mazars was in the 3rd year of total uninterrupted engagement and Deloitte & Associés was in the 16th year and 9th year since securities of the Company were admitted to trading on a regulated market.

Responsibilities of Management and Those Charged with Governance for the Consolidated Financial Statements

Management is responsible for the preparation and fair presentation of the consolidated financial statements in accordance with International Financial Reporting Standards as adopted by the European Union, and for such internal control as management determines is necessary to enable the preparation of consolidated financial statements that are free from material misstatement, whether due to fraud or error.

In preparing the consolidated financial statements, management is responsible for assessing the Company’s ability to continue as a going concern, disclosing, as applicable, matters related to going concern and using the going concern basis of accounting unless it is expected to liquidate the Company or to cease operations.

The Audit and accounts committee is responsible for monitoring the financial reporting process and the effectiveness of internal control and risks management systems and where applicable, its internal audit, regarding the accounting and financial reporting procedures.

The consolidated financial statements were approved by the Board of Directors.

Statutory Auditors’ Responsibilities for the Audit of the Consolidated Financial Statements
Objectives and audit approach

Our role is to issue a report on the consolidated financial statements. Our objective is to obtain reasonable assurance about whether the consolidated financial statements as a whole are free from material misstatement. Reasonable assurance is a high level of assurance, but is not a guarantee that an audit conducted in accordance with professional standards will always detect a material misstatement when it exists. Misstatements can arise from fraud or error and are considered material if, individually or in the aggregate, they could reasonably be expected to influence the economic decisions of users taken on the basis of these consolidated financial statements.

As specified in Article L. 823-10-1 of the French Commercial Code (code de commerce), our statutory audit does not include assurance on the viability of the Company or the quality of management of the affairs of the Company.

As part of an audit conducted in accordance with professional standards applicable in France, the statutory auditor exercises professional judgment throughout the audit and furthermore:

  • Identifies and assesses the risks of material misstatement of the consolidated financial statements, whether due to fraud or error, designs and performs audit procedures responsive to those risks, and obtains audit evidence considered to be sufficient and appropriate to provide a basis for his opinion. The risk of not detecting a material misstatement resulting from fraud is higher than for one resulting from error, as fraud may involve collusion, forgery, intentional omissions, misrepresentations, or the override of internal control.
  • Obtains an understanding of internal control relevant to the audit in order to design audit procedures that are appropriate in the circumstances, but not for the purpose of expressing an opinion on the effectiveness of the internal control.
  • Evaluates the appropriateness of accounting policies used and the reasonableness of accounting estimates and related disclosures made by management in the consolidated financial statements.
  • Assesses the appropriateness of management’s use of the going concern basis of accounting and, based on the audit evidence obtained, whether a material uncertainty exists related to events or conditions that may cast significant doubt on the Company’s ability to continue as a going concern. This assessment is based on the audit evidence obtained up to the date of his audit report. However, future events or conditions may cause the Company to cease to continue as a going concern. If the statutory auditor concludes that a material uncertainty exists, there is a requirement to draw attention in the audit report to the related disclosures in the consolidated financial statements or, if such disclosures are not provided or inadequate, to modify the opinion expressed therein.
  • Evaluates the overall presentation of the consolidated financial statements and assesses whether these statements represent the underlying transactions and events in a manner that achieves fair presentation.
  • Obtains sufficient appropriate audit evidence regarding the financial information of the entities or business activities within the Group to express an opinion on the consolidated financial statements. The statutory auditor is responsible for the direction, supervision and performance of the audit of the consolidated financial statements and for the opinion expressed on these consolidated financial statements.
Report to the Audit and accounts committee

We submit a report to the Audit and accounts committee which includes in particular a description of the scope of the audit and the audit program implemented, as well as the results of our audit. We also report, if any, significant deficiencies in internal control regarding the accounting and financial reporting procedures that we have identified.

Our report to the Audit and accounts committee includes the risks of material misstatement that, in our professional judgment, were of most significance in the audit of the consolidated financial statements of the current period and which are therefore the key audit matters, that we are required to describe in this report.

We also provide the Audit and accounts committee with the declaration provided for in Article 6 of Regulation (EU) N° 537/2014, confirming our independence within the meaning of the rules applicable in France such as they are set in particular by Articles L.822-10 to L.822-14 of the French Commercial Code (code de commerce) and in the French Code of  Ethics (code de déontologie) for statutory auditors. Where appropriate, we discuss with the Audit and accounts committee the risks that may reasonably be thought to bear on our independence, and the related safeguards.

Paris La Défense, on April 5th, 2023

The Statutory Auditors

French original signed by

Deloitte & Associés

Jérôme LEMIERRE

Partner

Mazars

Jean-Claude PAULY

Partner

4.8Statutory auditors' report on the statutory financial statements

This is a translation into English of the statutory auditors’ report on the statutory financial statements of the Company issued in French and it is provided solely for the convenience of English speaking users.

This statutory auditors’ report includes information required by European regulation and French law, such as information about the appointment of the statutory auditors or verification of the management report and other documents provided to shareholders.

This report should be read in conjunction with, and construed in accordance with, French law and professional auditing standards applicable in France.

For the year ended December 31, 2022

To the Annual General Shareholders’ Meeting of COFACE SA.

Opinion

In compliance with the engagement entrusted to us by your annual general meeting, we have audited the accompanying statutory financial statements of COFACE SA for the year ended December 31, 2022. 

In our opinion, the statutory financial statements give a true and fair view of the assets and liabilities and of the financial position of the COFACE SA as at December 31, 2022 and of the results of its operations for the year then ended in accordance with French accounting principles.

The audit opinion expressed above is consistent with our report to the Audit and accounts committee.

Basis for Opinion
Audit Framework

We conducted our audit in accordance with professional standards applicable in France. We believe that the audit evidence we have obtained is sufficient and appropriate to provide a basis for our opinion.

Our responsibilities under those standards are further described in the "Statutory Auditors' Responsibilities for the Audit of the statutory financial statements" section of our report.

Independence

We conducted our audit engagement in compliance with independence requirements of the French Commercial Code (Code de Commerce) and the French Code of Ethics (code de déontologie) for statutory auditors, for the period from January 1, 2022 to the date of our report and specifically we did not provide any prohibited non-audit services referred to in Article 5(1) of Regulation (EU) No 537/2014 or in the French Code of ethics (code de déontologie) for statutory auditors.

Justification of Assessments - Key Audit Matters

In accordance with the requirements of Articles L. 823-9 and R. 823-7 of the French Commercial Code relating to the justification of our assessments, we inform you of the key audit matters relating to risks of material misstatement that, in our professional judgment, were of most significance in our audit of the statutory financial statements of the current period, as well as how we addressed those risks.

These matters were addressed in the context of our audit of the statutory financial statements as a whole, approved in the conditions mentioned above, and in forming our opinion thereon, and we do not provide a separate opinion on specific items of the statutory financial statements.

Valuation of equity securities

Identified Risk


Our response

The amount of participations in affiliated companies with a participating interest amounted to € 1,502.7 million euros. As mentioned in note 2.1 – Accounting principles standards, the equity securities appearing in the balance sheet are recognized at their acquisition date and subsequently depreciated based on their value in use. The latter is estimated by management on the basis of estimates based on forecasts.

The estimate of the value in use of these securities requires the judgment of the management in its choice of items to consider, including the profitability prospects of the entities whose securities are held by COFACE S.A.

We considered that the depreciation of equity securities constitutes a key audit matter due to the part of management judgment involved in the evaluation of the value in use, which uses assumptions of future results taking into account the maturity of the entity, the history of the activity and the market prospects and the country in which the entity is established. The potential impact on the statutory financial statements concerns the existence of a provision for depreciation of equity securities not recognized at the closing.


To assess the reasonableness of the valuation of impairment provisions on equity securities, our work has focused on verifying that the value in use estimates determined by the management was based on an appropriate rationale for the valuation method and the quantified elements used. In order to do this:

  • We obtained and analysed business plans and discussed with the management on its forecasts;
  • We analysed the consistency of the main assumptions used with the economic environment;
  • We compared the consistency of the forecasts used in the prior periods with the actual outcomes;
  • We assessed the need to recognize an impairment and, if applicable, we verified its calculation.
Specific Verifications

We have also performed, in accordance with professional standards applicable in France, the specific verifications required by laws and regulations.

Information given in the management report and in the other documents with respect to the financial position and the statutory financial statements provided to Shareholders

We have no matters to report as to the fair presentation and the consistency with the statutory financial statements of the information given in the management report of the Board of directors and in the other documents with respect to the financial position and the statutory financial statements provided to shareholders.

We attest the fair presentation and the consistency with the statutory financial statements of the information relating to payment deadlines mentioned in Article D.441-6 of the French Commercial Code (code de commerce).

Report on corporate governance

We attest that the Board of Directors’ report on corporate governance sets out the information required by Article L. 225-37-4 and L.22-10-10 and L22-10-9 of the French Commercial Code.

Concerning the information given in accordance with the requirements of Article L. 22-10-9 of the French Commercial Code (code de commerce) relating to remunerations and benefits received by or awarded to the directors and any other commitments made in their favour, we have verified its consistency with the statutory financial statements, or with the underlying information used to prepare these financial statements and, where applicable, with the information obtained by your Company from controlled enterprises included in the scope of consolidation. Based on these procedures, we attest the accuracy and fair presentation of this information.

With respect to the information relating to items that your company considered likely to have an impact in the event of a takeover bid or exchange offer, provided pursuant to Article L. 22-10-11 of the French Commercial Code (code de commerce), we have agreed this information to the source documents communicated to us. Based on these procedures, we have no observations to make on this information.

Other Information

In accordance with French law, we have verified that the required information concerning the identity of the shareholders and holders of the voting rights has been properly disclosed in the management report.

Other Legal and Regulatory Verifications or Information
Format of presentation of the statutory financial statements intended to be includedin the annual financial report

We have also verified, in accordance with the professional standard applicable in France relating to the procedures performed by the statutory auditor relating to the annual and consolidated financial statements presented in the European single electronic format, that the presentation of the statutory financial statements intended to be included in the annual financial report mentioned in Article L. 451-1-2, I of the French Monetary and Financial Code (code monétaire et financier), prepared under the responsibility of the Chief Executive Officer, complies with the single electronic format defined in the European Delegated Regulation No 2019/815 of 17 December 2018. 

Based on the work we have performed, we conclude that the presentation of the statutory financial statements intended to be included in the annual financial report complies, in all material respects, with the European single electronic format.

We have no responsibility to verify that the statutory financial statements that will ultimately be included by your company in the annual financial report filed with the AMF are in agreement with those on which we have performed our work.

Appointment of the Statutory Auditors

We were appointed as statutory auditors of COFACE SA by the Annual General Meeting, on May 14, 2020 for Mazars and on May 3rd, 2007 for Deloitte & Associés. The previous auditors were Deloitte & Associés or another entity of the Deloitte network, whose original appointment details could not be determined.

As at December 31, 2022, Mazars was in the 3rd year of total uninterrupted engagement and Deloitte & Associés was in the 16th year and 9th year since securities of the Company were admitted to trading on a regulated market.

Responsibilities of Management and Those Charged with Governance for the statutory financial statements

Management is responsible for the preparation and fair presentation of the statutory financial statements in accordance with French accounting principles, and for such internal control as management determines is necessary to enable the preparation of financial statements that are free from material misstatement, whether due to fraud or error.

In preparing the statutory financial statements, management is responsible for assessing the Company’s ability to continue as a going concern, disclosing, as applicable, matters related to going concern and using the going concern basis of accounting unless it is expected to liquidate the Company or to cease operations.

The Audit and accounts Committee is responsible for monitoring the financial reporting process and the effectiveness of internal control and risks management systems and where applicable, its internal audit, regarding the accounting and financial reporting procedures.

The statutory financial statements were approved by the Board of Directors.

Statutory Auditors’ Responsibilities for the Audit of the statutory financial statements
Objectives and audit approach

Our role is to issue a report on the statutory financial statements. Our objective is to obtain reasonable assurance about whether the statutory financial statements as a whole are free from material misstatement. Reasonable assurance is a high level of assurance but is not a guarantee that an audit conducted in accordance with professional standards will always detect a material misstatement when it exists. Misstatements can arise from fraud or error and are considered material if, individually or in the aggregate, they could reasonably be expected to influence the economic decisions of users taken on the basis of these financial statements. 

As specified in Article L. 823-10-1 of the French Commercial Code (code de commerce), our statutory audit does not include assurance on the viability of the Company or the quality of management of the affairs of the Company.

As part of an audit conducted in accordance with professional standards applicable in France, the statutory auditor exercises professional judgment throughout the audit and furthermore:

  • Identifies and assesses the risks of material misstatement of the statutory financial statements, whether due to fraud or error, designs and performs audit procedures responsive to those risks, and obtains audit evidence considered to be sufficient and appropriate to provide a basis for his opinion. The risk of not detecting a material misstatement resulting from fraud is higher than for one resulting from error, as fraud may involve collusion, forgery, intentional omissions, misrepresentations, or the override of internal control.
  • Obtains an understanding of internal control relevant to the audit in order to design audit procedures that are appropriate in the circumstances, but not for the purpose of expressing an opinion on the effectiveness of the internal control.
  • Evaluates the appropriateness of accounting policies used and the reasonableness of accounting estimates and related disclosures made by management in the statutory financial statements.
  • Assesses the appropriateness of management’s use of the going concern basis of accounting and, based on the audit evidence obtained, whether a material uncertainty exists related to events or conditions that may cast significant doubt on the Company’s ability to continue as a going concern. This assessment is based on the audit evidence obtained up to the date of his audit report. However, future events or conditions may cause the Company to cease to continue as a going concern. If the statutory auditor concludes that a material uncertainty exists, there is a requirement to draw attention in the audit report to the related disclosures in the statutory financial statements or, if such disclosures are not provided or inadequate, to modify the opinion expressed therein.
  • Evaluates the overall presentation of the statutory financial statements and assesses whether these statements represent the underlying transactions and events in a manner that achieves fair presentation.
Report to the Audit and accounts committee

We submit a report to the Audit and accounts committee which includes in particular a description of the scope of the audit and the audit program implemented, as well as the results of our audit. We also report, if any, significant deficiencies in internal control regarding the accounting and financial reporting procedures that we have identified.

Our report to the Audit and accounts committee includes the risks of material misstatement that, in our professional judgment, were of most significance in the audit of the statutory financial statements of the current period and which are therefore the key audit matters that we are required to describe in this report.

We also provide the Audit and accounts committee with the declaration provided for in Article 6 of Regulation (EU) N° 537/2014, confirming our independence within the meaning of the rules applicable in France such as they are set in particular by Articles L. 822-10 to L. 822-14 of the French Commercial Code (code de commerce) and in the French Code of Ethics (code de déontologie) for statutory auditors. Where appropriate, we discuss with the Audit and Accounts Committeethe risks that may reasonably be thought to bear on our independence, and the related safeguards.

Paris La Défense, on April 5th, 2023

The Statutory Auditors

French original signed by

Deloitte & Associés

Jérôme LEMIERRE

Partner

Mazars

Jean-Claude PAULY

Partner

6 risk 
CATEGORIES

18 main 
RISK FACTORS

RISK GOVERNANCE  
& INTERNAL CONTROL SYSTEM

3 lines 
of defence

(1)
The standards adopted by the European Union can be consulted on the website of the European Commission at: https://ec.europa.eu/info/business-economy-euro/company-reporting-and-auditing/company-reporting/financial-reporting_en#ifrs-financial-statements
(2)
FVOCI: Fair Value through Other Comprehensive Income.
(3)
FVTPL: Fair Value Through Profit and Loss.

5. MAIN RISK FACTORS AND RISK MANAGEMENT WITHIN THE GROUP

5.1Summary of main risks

The Group operates in a rapidly evolving environment that gives rise to numerous external risks, in addition to the risks inherent in the conduct of its businesses. This chapter identifies the significant risk factors to which the Group believes it is exposed and explains how they are managed.

Despite a complex economic environment marked by the conflict in Ukraine, the energy crisis, inflation and the consequences of the Covid-19 pandemic, Coface Group has been able to maintain discipline in its risk management.

The table below presents the main risks to which Coface is exposed. It was prepared using the risk map, which is reviewed annually by general management and the Board of Directors’ Risk Committee. The risk map is based on a qualitative risk analysis aimed at assessing the probability of occurrence and potential impact of each risk factor, taking into account the corresponding level of control implemented within the Group.

In 2022, a number of changes were made to the risk mapping to take into account the updated assessment of their effects on the Group as well as certain additional risks. The exposure to these different risks is described in more detail in Section 5.2 of this report. The non-operational risk assessment methodology was adapted to align with that used for operational risks so as to provide a uniform view of all risks. As a result, the assessment of the risk frequency and its residual impact (impact of each risk after taking into account risk mitigation techniques such as the implementation of controls, procedures, governance, systems or human resources) is carried out on a scale with four levels: high, significant, medium, low. The approach is completed by an expert analysis that can take into account any other relevant element in order to best assess these risks. A pro-forma 2021 risk assessment was performed according to this methodology to enable comparison.

Risk categories

Main risk factors

Probability of occurrence

Residual impact

Change in these risks between 2021 and 2022*

Credit risk

Risk related to the management of the Group’s exposure in its insurance business

High

Significant

CH05_COA2020_URD_Arrow_0_HD.png

Risk of debtor insolvency

Significant

Medium

CH05_COA2020_URD_Arrow_0_HD.png

Risk related to technical provisions

Significant

Medium

CH05_COA2020_URD_Arrow_0_HD.png

Financial risk

Interest rate risk

Significant

Medium

COA2020_URD_Arrow_up_HD.png

Equity risk

Medium

Low

COA2020_URD_Arrow_down_HD.png

Real estate risk

Significant

Medium

CH05_COA2020_URD_Arrow_0_HD.png

Liquidity risk

Significant

Medium

CH05_COA2020_URD_Arrow_0_HD.png

Foreign exchange risk

Medium

Medium

CH05_COA2020_URD_Arrow_0_HD.png

Strategic risk

Risks related to market and geopolitical conditions

High

High

CH05_COA2020_URD_Arrow_0_HD.png

Risks related to changes in the regulations governing the Group’s activities

Medium

Low

CH05_COA2020_URD_Arrow_0_HD.png

Risk of deviating from the strategic plan

Significant

Medium

CH05_COA2020_URD_Arrow_0_HD.png

Reputational risk

Medium

Low

CH05_COA2020_URD_Arrow_0_HD.png

Reinsurance risk

Residual reinsurance risk

Significant

Medium

CH05_COA2020_URD_Arrow_0_HD.png

Operational and compliance risk

Risks related to information systems and cybersecurity (non-financial performance disclosures)

High

Significant

CH05_COA2020_URD_Arrow_0_HD.png

Modelling risk

Significant

Medium

CH05_COA2020_URD_Arrow_0_HD.png

Compliance risk

Significant

Medium

COA2020_URD_Arrow_down_HD.png

Outsourcing risk

Significant

Medium

Not assessed in 2021

Climate change risks

Climate change risks

Low

Low

Not assessed in 2021

* Change based on 2021 pro-forma assessment.

Before making a decision to invest in the Company’s shares, prospective investors should consider carefully all the information set out in this document, including the risks described below. As of the date of this report, these risks, were they to occur, are those the Group believes could have a material adverse effect on the Group, its business, its financial position, its solvency, its operating results or outlook, and which are material in making an investment decision. Prospective investors should nonetheless note that the risks described in this chapter may not be comprehensive, and that there may be additional risks that are not currently known or whose occurrence, as of the date of this Document, is not considered likely to have a material adverse effect on the Group, its business, its financial position, its operating results or outlook.

5.2Definition and measurement of risks

Risk factors related to the Issuer
/Breakdown of the Group’s overall exposure by business line (in €bn)

By business line

2022

2021

2020

(in €bn)

(as a %)

(in €bn)

(in €bn)

Credit insurance

666.9

96.6%

587.6

486.4

Bonding

14.7

2.2%

13.5

12.9

Single Risk Insurance

3.5

0.4%

2.7

3.1

Other*

4.6

0.7%

4.3

-

Total

689.7

100.0%

608.1

502.4

*     The Latitudine exposure (supervised discretionary credit limit) at Coface Italy and the bonding reinsurance business have been incorporated into the risk management tools since December 2021.

The data and charts on exposures provided below relate to credit insurance, which accounts for 97% of total amounts outstanding.

5.2.1Credit risk

a)Risk related to the management of the Group’s exposure in its trade credit insurance business

Exposure to certain countries with high corporate default rates or the concentration of exposures in fragile economic sectors could have a material impact on the Group’s loss ratio, operating income, liquidity and solvency margin.

As part of its trade credit insurance activities, the Group allocates its exposures between clients operating in a wide range of economic sectors and established in different countries around the world. In this regard, it manages its exposures and determines the maximum amount of risk that it is willing to accept for each group of debtors based on the underlying level of risk related to the economic sector concerned and/or the location of those groups of debtors.

The Group significantly increased its exposure in 2021 as the Covid-19 pandemic receded. This followed a significant decrease in exposures due to risk management action taken at the height of the pandemic in 2020. Exposure continued to grow at a slower pace in 2022, in a context of high inflation that supports Coface’s clients’ turnover. It stood at €667 billion at the end of 2022.

The chart below shows a breakdown of the level of exposure by region for the periods ended December 31, 2020, 2021 and 2022 respectively:

/Breakdown of the Group’s credit insurance exposures by geographic region (in billion of euros)
COA2022_URD_EN_G004_HD.png

All of the Group’s regions recorded an increase in exposure. Following an increase of nearly 15% in 2022, the Mediterranean and Africa region became the Group’s largest region in terms of exposure, slightly ahead of Western Europe. Latin America recorded the largest increase, at nearly 25%. However, this region remains the Group’s smallest region. In contrast, growth was weaker in Central Europe in 2022 (6.5%, compared to the 13.5% increase for the Group as a whole), due in particular to the risk management action implemented in response to Russia’s invasion of Ukraine.

More specifically, risk management action reduced exposure to Russian debtors to €640 million at the end of 2022, a reduction of more than 85% compared to pre-invasion levels. Claims notifications on Russian debtors remained at a moderate level during 2022 and had no significant impact on the Group’s loss ratio. Coface is continuing to reduce its activity in Russia while preserving debt collection and risk management capabilities in the region.

The geographical breakdown of risk is monitored according to the Group’s country risk assessment, which estimates the average credit risk of companies in a given country using a risk scale ranging from A1 (the highest rating) to E (the lowest rating). The concentration of exposure on the lowest-rated countries is constantly monitored as part of Coface’s risk appetite.

At December 31, 2022, the top ten countries accounted for 63.5% of credit insurance exposures, compared with 63.7% at December 31, 2021. Germany, which accounts for nearly 12.4% of the Group’s risks, remains the country in which the Group has the biggest exposure. More than 80% of the debtors covered by credit insurance policies are located in OECD countries.

/Breakdown of the Group’s credit insurance exposure by country at December 31, 2022
COA2022_URD_EN_G005_HD.png

The Group’s exposure is also diversified by economic sector. All sectors recorded an increase in exposure in 2022. The concentration on the largest sector, namely agriculture, increased slightly to 16.6% of total exposure. The weight of the transport and metals sectors, which fell significantly at the beginning of the pandemic, was stable in 2022, while the share of exposure to non-specialised retail clients dropped to less than 10%.

/Breakdown of the Group’s credit insurance exposure by economic sector at December 31, 2022 (in billion of euros)
COA2022_URD_EN_G006_HD.png

At December 31, 2022, more than 95% of the Group’s total exposure consisted of short-term risks. The maximum credit term stipulated in its policies rarely exceeds 180 days.

However, an adverse change in the economic cycle (at a global, sector, geographical or country level) resulting from:

  • a financial or health crisis, such as the financial crisis in Latin America in 2019 or the global Covid-19 pandemic in 2020;
  • a failure of the Group’s management systems, processes or governance;
  • a poor assessment of the risks associated with an economic sector, geographical area or country,

could lead to delays in reducing exposures and/or an overestimation of the quality of exposures to the economic sector, geographical area or country concerned. In such an event, the Group’s credit risk would increase and it could experience a sharp rise in paid claims, which would have an impact on its loss ratio, operating income, liquidity and solvency margin.

b)Risk of debtor insolvency

An overestimation of the quality of our debtors, poor management of the concentration of debtors or a delay in assessing certain adverse economic developments could lead to the granting of inappropriate limits to companies that may encounter financial difficulties and potentially default on their payment obligations towards our policyholders, thereby increasing the claims submitted to the Group.

The approval of the maximum amount of risk incurred on debtors is based on an analysis of their financial strength and an assessment of their capacity to pay amounts due to our policyholders in a given economic situation. This analysis is carried out by the Group’s credit analysts and underwriters, who continually assess and monitor debtor solvency based on publicly available information and/or data collected directly from the debtors and/or using an internal assessment tool and a historical database.

The default risk of debtors (policyholders’ clients) is analysed according to the concentration of exposures to a group of debtors. The Group provides unpaid receivables risk insurance covering over two million debtors worldwide. At December 31, 2022, the Group’s average exposure to individual debtors was contained, with an average risk per debtor close to €280,000.

The table below shows a breakdown of the Group’s policyholders at December 31, 2022 according to the total outstanding credit risk incurred by the Group. Analysis of the number of debtors by amounts outstanding shows that the risk concentration is limited. For example, debtors to which the Group’s exposure totals less than €5 million account for nearly 50% of the Group’s total exposure.

Debtor total exposure brackets

Outstanding amounts* 
(in millions of euros)

2022

€1 – €100,000

42,282

€101,000 – €200,000

28,548

€201,000 – €400,000

37,732

€401,000 – €800,000

48,349

€801,000 – €1.5 million

51,414

€1.5 million – €5 million

116,200

€5 million – €50 million

227,648

€50 million – €200 million

76,670

€200 million and more

38,072

Total

666,916

*    The outstandings shown are gross of reinsurance (direct business and inward reinsurance) and correspond to the maximum amount of cover granted by the Group to its policyholders. They do not correspond to the effective use thereof by the policyholders.

The risk of debtor insolvency can also be exacerbated by debtors’ exposure to climate risk. Coface has incorporated a climate stress test as part of its annual own risk and solvency assessment (ORSA). In a scenario reflecting the risk of a delayed transition to a low-carbon economy, debtors operating in sectors the most exposed to transition risk (such as carbon intensive sectors) and whose financial strength is low or medium would be the most exposed. However, the share of these companies in Coface’s portfolio is very low. As a result, the impact of this stress scenario on the Group’s profitability and solvency is not material. For more information on how Coface manages environmental risks, please refer to Chapter 6 of this document.

The Group is mainly exposed to small and medium-sized debtors and, to a certain extent, to larger debtors for larger amounts. Although the Group’s exposures are covered by a reinsurance programme, the default of a number of small and medium-sized debtors, each for amounts below the minimum amounts covered by the reinsurance programme, could be borne directly by the Group. In addition, the default of certain debtors for a significant amount may exceed the upper limit of the reinsurance programme. As a result, adverse developments in the economic situation of a debtor, internal defaults of debtors, or a failure in the Group’s systems or processes leading to an incorrect assessment of the risk of insolvency of a debtor or group of debtors, may lead to an underestimation of this risk of default of one or more debtors, thereby increasing the claims presented to the Group, which may have a material impact on its operating income, liquidity and solvency margin.

c)Risk related to technical provisions

The Group uses actuarial techniques and calculations to value technical reserves that may not correspond to actual experience and could have an adverse impact on the Group’s financial position and solvency margin.

At December 31, 2022, the Group’s loss ratio (before reinsurance) (1) stood at 31.2%, compared with 21.4% at December 31, 2021. The loss ratio rose from last year due to the normalisation of the loss experience following the Covid-19 pandemic.

Technical reserves of insurance policies are recorded on the liabilities side of the balance sheet. These reserves are measured in accordance with IFRS. They are an estimate of the amount of claims the Group is committed to pay (and the administrative fees relating to these claims):

  • a reserve for claims payable is recorded for claims incurred, whether or not they have been reported to the Group (reserve risk);
  • the Group also establishes a reserve for unearned premiums (premium risk).

In order to build up technical reserves for claims, the Group makes estimates based on various modelling techniques, using internal and external tools. Modelling results and the related analyses are subject to the various assumptions, expert judgements, modelling errors and limitations inherent in any statistical analysis. Differences may be observed retrospectively between the Group’s estimates and the real cost of actual claims (see also “Operational and compliance risks – Model risk” below).

The technical reserves recognised in the IFRS financial statements cover simulated differences in reserve risk with a sufficient margin.

Furthermore, the Group’s internal risk policy specifies that the level of reserves (all business lines and years combined) must at least equal the 90% quantile of the distribution of reserves for claims; in other words, the level of reserves must cover 90% of potential ultimate claims.

At December 31, 2022, accounting reserves exceeded the 90% quantile, thereby protecting the Group from a reserve shortfall in nine cases out of ten.

However, poor data quality, a deterioration in the economic environment not reflected in the projections or the use of inaccurate or incomplete models may lead to situations in which the actual experience deviates from the estimates, which may have an adverse effect on the Group’s financial position and solvency margin.

5.2.2Financial risk

a)Interest rate risk

Interest rate risk represents the sensitivity of the value of assets, liabilities and financial instruments to changes in the yield curve or the volatility of interest rates.

The Group holds an investment portfolio composed mainly of listed financial instruments. Its portfolio allocation is mainly focused on debt products (almost all at fixed rates), as shown in the table below. The Group’s portfolio of assets also enables it to meet some of its liquidity needs.

Investment portfolio (fair value)*

As at Dec. 31

2022

2021

2020

(in €m)

(as a %)

(in €m)

(as a %)

(in €m)

(as a %)

Equities

85

2.9%

233

7.6%

149

5.3%

Bonds

2,265

77.1%

2,115

69.0%

1,914

67.6%

Loans, deposits and other financial investments**

367

12.5%

507

16.5%

540

19.0%

Investment property

220

7.5%

213

6.9%

231

8.1%

Total

2,937

100.0%

3,068

100.0%

2,834

100.0%

*   Excluding non-consolidated subsidiaries.

**  Including units in money market UCITS.

The Group’s investment policy aims to respect legal and regulatory requirements while generating regular income with limited risk.

In 2022, global economic growth slowed from the peaks seen in 2021. The situation was exacerbated by the repercussions of the conflict between Russia and Ukraine, which pushed inflation above central bank expectations.

Under the effect of inflation, rising interest rates and widening credit spreads, the Group continued the downside adjustment of risk in its portfolio that it began in 2021, mainly by reducing its exposure to emerging countries and real estate funds in favour of government bonds.

Similarly, in anticipation of the implementation of IFRS 9 and in light of the decline in the markets, the Group significantly reduced its equity allocation. As such, the portfolio’s equity exposure decreased by 4.7 points between the end of 2021 and the end of 2022 and the remaining equity allocation will be measured at fair value through non-recyclable other comprehensive income (FV OCI-NR) at January 1, 2023.

At December 31, 2022, the fair value of the Group’s investment portfolio amounted to €2,937 million (excluding non-consolidated subsidiaries), down €131 million compared with the end of 2021 due to the rise in interest rates.

The bond portfolio is mainly invested in government bonds (55.4% at end-December 2022) and investment grade corporate bonds (42.5% at end-December 2022) (2). These investments were made in accordance with a clear risk policy with a particular focus on issuer quality, interest rate sensitivity, and the spread of issuers and geographic regions in the investment mandates granted to the Group’s dedicated asset managers.

The average rating of the bond portfolio at the end of 2022 was A, with nearly 95.3% of securities rated BBB or above.

Breakdown by rating* of bonds in the bond portfolio (fair value)

At December 31, 2022

(in €m)

(as a %)

AAA

306

13.5%

AA – A

1,126

49.7%

BBB

727

32.1%

BB – B

104

4.6%

CCC and below

2

0.1%

Total

2,265

100.0%

Through its bond investments, the Group is exposed to interest rate risk, which includes 

  • interest rate risk reflected in the sensitivity of the value of assets, liabilities and financial instruments to changes in the yield curve or interest rate volatility and 
  • credit spread risk reflected in the sensitivity of the value of assets, liabilities and financial instruments to changes in credit spreads against the interest rates at which sovereign bonds are issued.

The modified duration of the Group’s bond portfolio is capped at 5 (3) in the Group’s internal investment policy. At December 31, 2022, the bond portfolio’s modified duration was 3.2, down 0.8 compared with the end of 2021. The Group’s exposure to interest rate risk and, consequently, to spread risk, therefore remains limited.

However, fluctuations in interest rates have a direct impact on the market value and return on the Group’s investments since unrealised gains or losses and the return on securities held in its portfolio depend on the level of interest rates.

Interest rates are highly sensitive to a number of external factors, including monetary and fiscal policies, domestic and international economic and political environments, and investors’ risk aversion.

The risk associated with a significant drop in interest rates is that either the portfolio’s average rate decreases (in which case reinvestments are made at lower rates) or the portfolio’s duration increases (which may make the portfolio more sensitive to future interest rate fluctuations). The risk associated with rising interest rates is a fall in the market value of the bond portfolio, which may lead the Group to record unrealised losses.

At December 31, 2022, the Group considered that an increase in interest rates of 100 basis points would have an impact of €71.4 million on the fair value of its portfolio (excluding hedging activities).

Any significant fluctuation in the value of the Group’s bond portfolio due to a change in interest rates may have a material adverse effect on the Group’s ability to manage this portfolio on favourable terms, which may have an impact on the Group’s cash flows, solvency margin and financial position.

b)Equity risk

Equity risk arises from the sensitivity of the value of assets, liabilities and financial instruments to changes affecting the level or volatility of the market value of equities.

At December 31, 2022, equity investments accounted for 2.9% of the Group’s investment portfolio, compared with 7.6% at the end of 2021. This exposure is concentrated in the eurozone, in line with the Group’s core business. These investments were partially hedged on the Euro Stoxx 50 index (4) with a view to protecting the portfolio in the event of a significant drop in the equity market. Following the choice to measures the portfolio’s equity exposure at FV OCI-NR for accounting purposes, this hedging was discontinued and closed in early December 2022.

Equity prices may be affected by risks affecting the market as a whole (uncertainty over general economic conditions, such as expected growth trends, inflation, interest rate fluctuations, sovereign risk, etc.) and/or by risks affecting a single asset or a small number of assets. This may result in a fall in the price of equity instruments held by the Group and may have an impact on its realised or unrealised capital gains and losses.

The following table assesses the portfolio’s sensitivity to a decline in the equity market:

/Sensitivity of the portfolio to changes in equity markets at December 31, 2022

(in millions of euros)

Market value at December 31, 2022

Impact of a 10% fall in equity markets (1)

Impact of a 20% fall in equity markets (1)

Equities

85

(8.5)

(17.0)

  • Excluding any hedging impact.

Any significant change in the value of the Group’s equity instruments due to a decline in the equity markets may therefore have an adverse effect on the value of the Group’s portfolio and on its ability to manage this portfolio on favourable terms, which may have an impact on the Group’s cash flows, solvency margin and financial position.

c)Real estate risk

Real estate risk represents the sensitivity of the value of assets, liabilities and financial instruments to changes affecting the level or volatility of the market value of real estate assets.

The Group’s current real estate portfolio consists of property used for its operating activities and investments having real estate as their underlying assets. At December 31, 2022, the fair value of the Group’s real estate exposure was €288 million, with €68 million in real estate assets used for its operations and €220 million in real estate investment funds invested in real estate assets linked to various economic sectors in Europe. Investment in real estate investment funds accounts for a limited portion of the Group’s investment portfolio (7.5%) due to the low liquidity of this asset class.

The rental income of the real estate portfolio is exposed to variations in the indices used to calculate rents (for example, the cost of construction index in France), risks related to the rental market (changes in supply and demand, vacancy rates, impact on market rental values or lease renewals) and the risk of default by leaseholders.

The value of real estate assets is exposed to the risk of obsolescence due to changes in applicable regulations, which could lead to impairment losses in the event of a sale of the assets or additional expenditure to restore the value of the assets.

The following table assesses the portfolio’s sensitivity to a downturn in the real estate market:

/Sensitivity of the portfolio to the decline in the real estate market at December 31, 2022

(in millions of euros)

Market value at December 31, 2022

Impact of a 10% decline in the real estate market

Impact of a 20% decline in the real estate market

Real estate assets

220

(22.0)

(44.0)

Any significant change in the value of the Group’s real estate portfolio due to real estate market trends may therefore have an adverse effect on the value of the Group’s portfolio and on its ability to manage this portfolio on favourable terms, which may have an impact on the Group’s cash flows, solvency margin and financial position.

d)Liquidity risk

Adverse conditions on the capital markets could have a significant impact on the Group’s ability to fund its factoring business.

The Group has a commercial credit insurance business, which is the core of its business model, but has also developed a factoring business in Germany and Poland.

Through this business, the Group acquires and finances its clients’ trade receivables, thereby generating a significant liquidity requirement insofar as it does not have an internal source of financing. For example, the liquidity used to fund this activity amounted to more than €2.5 billion at December 31, 2022. To finance its factoring activity on a sustainable basis, the Group has a diversified and resilient refinancing programme, consisting of a trade receivables securitisation programme of up to €1,200 million (increased from €1,100 million at December 31, 2021), and a commercial paper programme for up to €700 million (unchanged since December 31, 2021) as well as several credit lines and overdraft facilities for a maximum of €1,677 million. The Group’s refinancing programme is oversized and guaranteed for a much longer maturity than the underlying short-term trade receivables it finances. It includes back-up facilities for its market financing solutions such as the commercial paper and securitisation programmes.

Any substantial downgrade of the credit ratings of the Group or one of its entities or any non-compliance with the obligations set out in the financing agreements could have a material adverse effect on the Group’s ability to fund its factoring business due to the loss of financing available under existing credit facilities or difficulties in renewing these credit lines. In addition, any market event leading to the unavailability of the debt market or the commercial paper market, as sometimes happens during a financial crisis, could compromise the Group’s ability to obtain adequate funding and lead to a decline in business and consequently a loss of revenue.

Liquidity tensions related to the payment of claims to its policyholders and/or the failure of some of its reinsurers to meet their obligations could cause the Group to record a loss in value of its portfolio. Significant disposals required within a few days and carried out urgently on illiquid assets or involving high execution costs could impact the value of the portfolio in sudden or adverse market scenarios, thereby having consequences for the Group’s solvency margin and/or net income.

The Group’s investment portfolio must be sufficiently liquid to meet significant cash requirements at all times. For this reason, it consists mainly of debt products (which represent the bulk of the Group’s overall asset allocation) with a fixed rate and short duration, in line with the Group’s liabilities. In addition, the Group allocates a significant portion of its assets to highly liquid money market instruments, which accounted for 12.5% of the investment portfolio at December 31, 2022 (loans, deposits and other financial investments), corresponding to €367 million at this date. Under current market conditions and according to the Group’s assessment, this amount could be fully available in less than 15 days.

The following table presents the breakdown of the duration of the Group’s bond portfolio:

Breakdown of the bond portfolio by duration

At December 31, 2022

(in €m)

(as a %)

< 1 year

317

14.0%

1-3 years

849

37.5%

3-5 years

670

29.6%

5-10 years

349

15.4%

> 10 years

80

3.5%

Total

2,265

100.0%

At December 31, 2022, 51.5% of the bond portfolio had a duration of less than three years.

This short duration allows the Group to have regular access to liquid assets that may be allocated to operating needs if necessary or to make regular reinvestments in market securities.

As an insurer, the Group must regularly pay claims and has implemented liquidity management policies for its investment portfolio as well as clear rules for monitoring its reinsurers’ default risk.

e)Foreign exchange risk

Given its global presence, the Group is exposed to exchange rate fluctuations that may affect its profitability, financial position, liquidity and solvency margin.

Foreign exchange risk is the risk of loss resulting from adverse changes in exchange rates. It could have an impact on the Group’s operating income (for example, turnover from subsidiaries or liabilities denominated in specific currencies) and on the value of the Group’s assets (for example, through direct investments in assets denominated in foreign currencies).

At December 31, 2022, 37.9% of the Group’s consolidated turnover was denominated in currencies other than the euro (mainly the currencies of the United States, the United Kingdom, Singapore and Hong Kong) thus exposing the Group to foreign exchange risk.

Most of the Group’s investments are denominated in euros. At December 31, 2022, more than 72% of its investments were denominated in euros and the exposure to foreign exchange risk (mainly in US dollars, Singapore dollars, pounds sterling and Hong Kong dollars) was therefore limited.

However, the following types of foreign exchange risk have been identified by the Group:

  • Operations: fluctuations in exchange rates may have consequences on the Group’s operating income due to the translation of foreign currency transactions, the settlement of balances denominated in foreign currencies and a mismatch between monetary assets and liabilities in foreign currencies. To reduce the impact of this mismatch, the Group uses derivatives to hedge its positions against foreign exchange fluctuations in sensitive currencies, particularly during periods of heightened volatility on the capital markets. However, it is never possible to fully align monetary assets and liabilities and a potential impact on profits and losses may be recorded as a result of fluctuations in exchange rates and since these transactions are not subject to hedge accounting under IFRS;
  • Conversion: the Group publishes its consolidated financial statements in euros, but some of its income and expenses, as well as its assets and liabilities, are denominated in currencies other than the euro. As a result, fluctuations in the exchange rates used to convert these currencies into euros may have a significant impact on reported turnover from one year to the next.

Any significant change in the exchange rates for currencies in which the Group operates or manages its assets is therefore likely to have an adverse effect on its cash flows, solvency margin and financial position as well as the value of its portfolio.

5.2.3Strategic risk

a)Risks related to market conditions

Corporate insolvency rates were low during the post-pandemic recovery but are expected to increase, which could lead to higher credit losses for the Group, a loss in value of its investments or other difficulties. In addition, the economic environment has become less favourable. The war in Ukraine has intensified downward pressure on global growth and upward pressure on inflation.

In 2022, the economic rebound after the crisis triggered by the Covid-19 pandemic began to weaken as difficulties mounted. The rise in global inflation and the aggressive response of the main central banks are slowing economic growth. This slowdown is compounded by the fallout from the war in Ukraine and threats to growth in China (drought, zero-Covid policy, turbulence on the real estate market). Against this backdrop, and after corporate bankruptcies were unusually low in 2020 and 2021, they have started to rise in some of the world’s largest economies. They have already exceeded pre-pandemic levels in the UK and Spain, and have returned to equivalent levels in France. In the United States, although business failures remain low, they seem to have bottomed out in the middle of the second quarter of 2022. The weak economic outlook for 2023 is likely to push corporate bankruptcies higher. In particular, tighter financial conditions should test the resilience of their balance sheets in the coming months.

The slowdown in global economic activity is expected to persist in 2023. The impacts of Russia’s invasion of Ukraine and global monetary tightening will continue to be felt. In particular, the war worsened the outlook through higher commodity prices and supply chain disruptions due to the critical roles of Russia and Ukraine in the global production of energy, mining and agricultural products. The extent of the energy crisis, and therefore the recession, will depend on the fall in temperatures and how well the European Union can reduce its energy consumption. The region’s efforts to rebuild gas stocks and mild temperatures in the autumn of 2022 provided a buffer at the start of the peak season of high demand (December to February).

Meanwhile, inflationary pressures, exacerbated by the war, remain high. Rising inflation is a risk due to its impact on household income and corporate margins, and thus on the economic environment. After reaching multi-decade highs in advanced economies, inflation could ease in 2023 with lower commodity prices and easing supply chain constraints, but pressure on prices is likely to remain high. Supply pressure is expected to keep commodity prices above pre-2020 levels, impacting inflation.

The war in Ukraine and uncertainty about the future of China’s economic environment will also continue to threaten global supply chains. In addition, central banks face a growing risk of a de-anchoring of inflation expectations. As a result, they are tightening policy, notably by raising their key interest rates. The main central banks, led by the US Federal Reserve (Fed), took decidedly aggressive action to contain inflation in 2022. Breaking with the low interest rate environment that prevailed after the global financial crisis (2008-2009), particularly in advanced economies, most central banks (United States, Canada, Europe, United Kingdom, Australia, etc.) have already returned to policy rates not seen in the past decade. Far from being deterred by the growing signs of a slowdown in activity, they are likely to keep their interest rates at levels that will restrict economic activity throughout 2023 in order to ease inflation.

Central banks are now at risk of pushing the global economy into a major slowdown or even a recession. In addition, the Fed’s aggressiveness is leading to monetary tightening in other countries, particularly emerging countries, which are trying to limit the depreciation of their currencies against the dollar and capital flight. Such a tightening of global monetary and financial conditions poses a threat to global growth and financial stability. With global household, corporate and government debt exceeding 300% of GDP, higher borrowing costs are a major risk factor. In the eurozone, the challenge facing the European Central Bank (ECB) is all the more risky as rising interest rates threaten to widen the gap between member countries, with the most indebted countries being more vulnerable.

Some governments are expected to extend or implement measures to support households and businesses in the face of inflation, but tighter financial conditions will limit the ability of most governments to react, particularly in emerging and low-income countries. Those forced to implement fiscal consolidation measures while household living standards are under pressure could also face social unrest. Higher inflation and a weaker labour market could create the perfect conditions for political unrest, which could have an impact on the Group.

These trends created turbulence in the financial markets and led to a fall in the value of bonds and equities in 2022. They are likely to continue to fuel market volatility. Higher borrowing costs have also begun to have an impact on house prices in major countries. The course of the war in Ukraine remains particularly uncertain and will continue to cloud the outlook. More generally, these events have also rekindled concerns about geopolitical risks in other parts of the world.

The Group’s strategic plan for 2020-2023 is based on (i) a core economic scenario developed by its research teams and (ii) assumptions arising from this scenario.

The plan, as well as the Group’s results and solvency, could be significantly affected by economic and financial conditions in Europe and other countries around the world. There remains a threat of a global economic depression for health, financial and/or geopolitical reasons, and a lasting macroeconomic downturn could affect the Group’s activities and results.

b)Risks related to changes in the regulations governing the Group’s activities

If the Group is unable to comply with regulatory changes, new accounting standards or tax reforms, this could have a negative impact on its business or its financial position.

A significant portion of the Group’s business is subject to the obtaining of approvals and licences issued by the public authorities in charge of supervising and controlling credit insurance and factoring activities. Under its strategy of sustained and profitable growth, the Group is developing new activities in certain countries and must obtain all the approvals, licences and authorisations necessary to carry out these activities. For example, in 2019 the Group launched a new credit insurance offering in Greece through a local branch that had to obtain the necessary local and European authorisations.

Any major difficulty encountered in obtaining such authorisations could delay or jeopardise its establishment in these new countries. Similarly, the non-renewal, suspension or loss of these authorisations could have a material adverse effect on its business, operating results, financial position and outlook.

In addition, the patchwork of regulatory regimes, capital standards and reporting requirements resulting from work on new capital requirements, as well as possible changes to solvency and capital adequacy requirements, such as the regulatory framework established by Solvency II or the forthcoming Insurance Recovery and Resolution Directive, could increase non-compliance risk, operational complexity and regulatory costs.

Tighter controls and higher capital requirements aimed at further strengthening the protection of policyholders and/or financial stability could affect the calculation of the local solvency margin and have a material adverse impact on the Group by increasing its external financing requirements and, as such, raising its funding costs. Insurance supervisors have broad administrative powers over many aspects of the insurance industry and the Group is unable to predict the timing or form of future regulatory initiatives.

In addition, changes in accounting standards (in particular the application of IFRS 17 from January 1, 2023) could have a significant impact on the Group by affecting the accounting treatment of certain assets and liabilities and thereby modifying the consolidated financial statements from one year to the next. These changes in accounting standards may change investors’ perception of the Group’s results and financial statements without being related to changes in the Group’s activities.

Changes in tax laws and regulations or their interpretation may have a negative impact on the Group’s performance, including its financial results and business model. In particular, legislative or regulatory changes may reduce the risk appetite of third parties and impact certain Group activities.

As such, the new IFRS 17 accounting standards, which are due to take effect from 2023, and IFRS 9, could modify the presentation of business indicators and have an operational and financial impact, particularly on information systems. Similarly, the Solvency II review could have an impact on the Group’s solvency.

c)Risk of deviating from the strategic plan

Failures in the management or implementation of the strategic plan could have a negative impact on the Group’s results or competitiveness.

Under the leadership and oversight of senior management, the 2020-2023 strategic plan was developed in consultation with the Group’s regions and functional departments to ensure it was relevant and to engage its operational teams.

The strategic plan includes the following financial objectives through the cycle:

  • a combined ratio of 80%;
  • a return on average tangible equity of 9.5%;
  • a solvency ratio of between 155% and 175%;
  • a payout ratio of at least 80%.

A dedicated organisational structure was set up to monitor execution of the plan and thus minimise the risk of deviating from its objectives. This organisation is headed by the Group’s Operations Department, with the support of the Finance Department.

In addition to risk factors arising from market conditions, risks associated with the achievement of the Group’s strategic objectives could arise from the emergence of other risk factors that may have an impact on the Group, such as the strategy or growth of other credit insurance providers, internal factors such as a product launch that does not find a market or that generates excessive risks, delays in investment, adaptation or transformation projects, or shortcomings in the management of the strategic plan.

If the plan is not completed on schedule, the Group may have to modify one or more of the strategic indicators it provides to the market, which could have an impact on its ability to pay dividends to its shareholders and on the perception of its activities by the capital markets and investors in general, thereby putting pressure on the market value of its financial instruments and having a negative impact on its results or competitiveness.

d)Reputational risk

Adverse events affecting the Group’s reputation may compromise the Group’s ability to take on a risk, sell services and/or obtain competitive reinsurance terms.

Reputational risk is the risk that an internal or external event adversely affects stakeholders’ perception of and confidence in the Group. It may also arise if there is a divergence between stakeholders’ expectations and the Group’s results.

Errors in the management of its investment portfolio or mismanagement of its exposures to certain geographical areas, economic sectors or debtors, particularly in a situation of economic uncertainty (see risk factor 5.2.1 “Risk related to the management of the Group’s exposure in its insurance business”), serious IT failures affecting, for example, clients or partners or causing data leaks (see risk factor 5.2.5 “Risks related to information systems and cyber security”), or inadequate management of its environmental, social and governance policy could generate reputational risk for the Group and affect its ability to underwrite a risk and/or obtain competitive reinsurance terms. The deterioration of the Group’s reputation may also affect its ability to finance its activities, particularly its factoring business, or increase its financing cost. Due to these factors, a deterioration in the Group’s reputation could affect its solvency margin, cash flows and operating income.

5.2.4Reinsurance risk

a)Residual reinsurance risk

Under certain adverse circumstances, reinsurance treaties may not be renewed in full or extended in line with the development of the Group’s activities, which may have an adverse impact on the Group’s solvency margin and operating income.

The main reinsurance risk is a lack of coverage available on the market, which would reduce the Group’s risk appetite for future uncovered extreme credit events.

This risk may increase due to changes in the economic cycle, a poor financial performance by the Group, or a decline in the attractiveness of the credit insurance and bonding segments in relation to other risk segments that could be considered to be more profitable by the reinsurance market.

The Group has structured its reinsurance programme as follows:

  • two proportional treaties covering 23% of its exposure. The renewal dates for these two-year quota share treaties are 12 months apart, so half of the coverage is already secured for the following year regardless of the outcome of the renewal in progress. Proportional coverage aims to protect the Group against a significant increase in the frequency of claims;
  • a new proportional treaty covering 27% of its exposure to bonding and Single Risk. This treaty was signed at the end of July 2022 with effect from January 1, 2022. This 27% is in addition to the ceded reinsurance rate of 23%, bringing the share on bonding and Single Risk to 50%;
  • after the quota shares, the residual exposure is covered by two excess of loss treaties aimed at covering the Group against the default of a significant exposure or the accumulation of losses related to small and medium-sized exposures. This coverage aims to protect the Group against an exceptional risk with a very high adverse financial impact;
  • in the long term, the Group’s residual exposure is also covered by a two year stop loss reinsurance treaty covering the Group against a combination of exceptional events.

If one or more reinsurance treaties cannot be renewed or are renewed for a lower coverage amount, the Group will incur more risks than expected, which may increase the final share of the losses it will have to finance and may have a negative impact on its solvency and operating income. In the event of serious losses, reinsurance companies may increase premiums, which may also have a direct impact on the Group’s operating income.

The Group faced a capacity shortage at the end of 2008 and could only partially place its proportional reinsurance programme and the overall cost of the reinsurance programme was significantly higher than in the previous year. If a similar event occurs in the future with the current reinsurance structure, this may have a negative impact on the Group’s solvency margin.

5.2.5Operational and compliance risk

a)Risks related to information systems and cybersecurity

Like any company, the Group is exposed to cyber attacks or other security vulnerabilities in its IT systems and infrastructure, or in those of its third-party service providers, which could disrupt its activities, cause significant financial losses, harm its reputation and expose it to possible sanctions from the regulatory authorities.

As dependency on technology and digital infrastructure and data increases, the risks associated with information systems and cyber security are important for the Group. Information system risks may occur in project, design or production phases, any may be caused by technical or human errors, negligence or a lack of control or skills. Cyber security risks are mainly caused by internal or external malicious acts, for example, cyber attacks. These actions and the risks associated with the information system could lead to a breach of the confidentiality, integrity or availability of the Group’s in-house or outsourced information systems.

The Group is exposed to cyber attacks or major failures in information systems affecting its systems or those of its third-party service providers, which may disrupt its activities (credit insurance, factoring, bonding, debt collection, business information). These attacks may vary greatly in terms of their sophistication and execution. The main types of attack include:

  • phishing or spear phishing: scams by e-mail, social networks, SMS, voice calls, etc. could result in financial transactions or cause viral infection of information systems, leading to direct financial loss, disclosure of confidential information or the loss of integrity of our systems;
  • data leakage: data could be stolen or made public in breach of the Group’s regulatory or contractual obligations;
  • data diddling: data could be deleted or corrupted, resulting in business interruption, loss of business and extended disruption due to the complexity of returning to a normal situation;
  • ransomware: key infrastructure components (such as Active Directory (5)) could be attacked, leading to the partial or complete interruption of the Group’s information systems. The Group may receive ransom demands and its activity could be suspended for several weeks;
  • system failure, loss of internet access or electricity supply: systems and applications could be slowed or interrupted, resulting in lost productivity and repair costs;
  • failure of a key supplier: for accidental or malicious reasons – these failures could disrupt the activity and require the implementation of possibly complex alternative or isolation solutions;
  • Distributed Denial of Service (DDoS): the Group may be the target of DDoS attacks resulting from malicious attempts to disrupt the normal traffic of its data centres or internet portals by overloading the systems or their surrounding infrastructure with internet traffic from multiple sources. The Group’s data centres or internet portals could become unavailable in the event of a successful DDoS attack.

Any of the above could cause significant damage to the Group’s systems or data and could therefore lead to financial losses for the Group, harm its reputation and give rise to client complaints. This type of cyber attack may also result in a breach of the legal responsibility of the Group’s executives and could also give rise to regulatory sanctions depending on the sensitivity of the data or the location of the system that is successfully attacked.

b)Modelling risk

The Group uses a number of models to carry out its activities. In certain circumstances, some models may no longer behave as expected, resulting in an inadequate assessment of its level of loss.

In performing its activities, the Group uses a number of models such as macroeconomic or stochastic models, debtor default prediction models, financial risk projection models to calculate premiums, and a partial internal model to calculate its regulatory capital requirement.

These models are based on estimates and assumptions that may prove incorrect. Some data may be incomplete or imperfect, and execution systems and procedures may have limitations or weaknesses, which could lead to errors in the pricing of insurance premiums in relation to the risk incurred for a given debtor, in the Group’s assessment of the quality of its exposure in certain geographical areas or economic sectors, in the establishment of technical provisions or in the Group’s management of its asset portfolio. As a result, if the models no longer behave as initially expected, this could have an impact on the Group’s loss ratio, financial forecasts, solvency margin, cash flows, earnings and reputation.

c)Compliance risk

The Group is exposed to the risk of violation of economic sanctions and the breach of laws and regulations covering corruption, money laundering and terrorist financing, or external fraud, which could expose it to regulatory fines, financial losses and reputational harm.

As an entity supervised by the French Prudential Supervision and Resolution Authority (ACPR), Coface Group must comply with French, national and international laws, regulations, and professional and ethical standards relating in particular to economic sanctions, anti-money laundering and counter-terrorist financing measures, the fight against corruption, and other local financial crime regulations applicable to its activities. The Group, which comprises several subsidiaries and branches, must comply with economic sanctions issued by various sources such as the United Nations, the European Union and its members and the Office of Foreign Assets Control (OFAC) of the US Department of the Treasury. In particular with regard to anti-corruption laws and regulations, the Group must comply with the provisions of the Sapin II law in France, the US Foreign Corrupt Practices Act (FCPA) and other local laws such as the UK Bribery Act.

As it does business in more than 100 countries, the Group is exposed to the risk of violation of anti-corruption, anti-money laundering and counter-terrorist financing laws and regulations and economic sanctions in the countries in which it operates. Any breach of these laws and regulations could expose the Group to regulatory fines, financial losses and reputational harm that could have a direct and material impact on its business.

In addition, the Group is exposed to external fraud, which may take various forms, including cyber attacks and fraud committed by its policyholders’ debtors. An act of fraud could generate a direct loss for the Group if it succeeds in circumventing the control or protection measures in place.

d)Outsourcing risk

The Group relies on a wide range of service providers in conducting its activities. The use of outsourcing may have consequences for its financial performance, relationship with clients or reputation. Outsourcing risk covers both the outsourcing of activities targeted by the regulations and outsourcing outside the regulatory framework to external service providers or internal service providers in the Shared Services Centers.

Outsourcing may expose Coface to several types of risks, including:

  • the sub-performance of the outsourced service in relation to the Group’s standards;
  • vulnerability in the selection, assessment and management of a service provider;
  • disruption of the business continuity system;
  • leak of confidential data;
  • fraud by a supplier;
  • the risk of money laundering, terrorist financing or corruption;
  • the risk of non-compliance with international sanctions.

Due to these many issues, policies cover the selection, governance and supervision of outsourced services.

Moreover, since the entry into force of the Solvency II Regulation, the outsourcing of important or critical functions and/or activities is strictly governed by the regulations applicable to insurance companies.

To date, the main material or critical activities outsourced by the Group concern the Company’s financial investment management activity and the hosting of information systems.

Key functions are rarely outsourced with the exception of the Know Your Customer (KYC) process, which has been outsourced internally within the Coface Group and concerns clients of entities located in the Asia-Pacific region and clients of the French and Spanish entities of Compagnie française d’assurance pour le commerce extérieur.

5.2.6Climate change risks

Over the past several years, collective awareness of climate risks has grown, leading businesses across the Board to integrate ESG (Environmental, Social and Governance) considerations in their communications and day-to-day management. Climate risks are one of Coface’s strategic priorities as they affect its activities at two levels (the impact of Coface’s operations on the climate – addressed in Chapter 6 – and the impact of climate risks on the Company’s operations and profitability).

Although Coface’s exposure to climate change risks seems limited as its business is credit insurance, the Group constantly monitors these risks as climate events are intensifying. There are two key risk categories:

  • Physical risk: measures the financial impacts resulting from the effects of climate change such as extreme weather events (fires, floods, storms, etc.). This depends on both the country’s exposure to this type of event and its dependence on external trade for goods that will become scarcer owing to climate change. The main threat of climate change is the increase in the frequency and violence of extreme weather events with massive financial consequences;
  • Transition risk: incorporates all the risks brought about by the transition to a low carbon model. Transition risk includes political risk, regulatory risk, technology risk, reputational risk and market sentiment risk (such as consumer or business preference for products or services that are less damaging to the climate).

As part of the Group and Company ORSA, a climate risk stress test was conducted in 2022, mainly focused on transition risk. It did not reveal any significant impacts on the Group’s solvency.

(1)
The Group’s loss ratio (before reinsurance) corresponds to the ratio of claims expenses to gross earned premiums (that is, the sum of gross earned premiums and provisions for unearned premiums), net of premium repayments.
(2)
According to the Standard & Poor’s rating scale, all bonds rated at least BBB- are considered investment grade, and bonds with a rating of BB+ or lower are considered to be high yield debt.
(3)
A bond’s modified duration measures its loss of value in the event of a rise in interest rates. Thus, a bond with a modified duration of 4 will see its market value decrease by 4% if interest rates rise by 1%.
(4)
This position is hedged through the use of derivatives for which the change in value is recorded directly in the income statement under IFRS, as the Group has not opted for hedge accounting within the meaning of IFRS for this transaction and this underlying asset.
(5)
The main objective of Active Directory is to provide centralised identification and authentication services to a network of computers using Windows, macOS or Linux systems.

5.3Risk governance

Within the framework of the Group’s activity, risk-taking reflects the search for business opportunities and the strategy of developing the Company in an environment intrinsically subject to numerous hazards. The essential goal of the risk management function is to identify the risks to which the Group is exposed and to set up an efficient internal control system to create value.

To address these risks, the Group has established a risk management structure which aims to ensure i) the proper functioning of all of its internal processes, ii) compliance with the laws and regulations in all of the countries where it operates, and iii) control of compliance by all operating entities with the Group rules enacted with a view to managing the risks associated with operations and optimising the effectiveness of this control.

The Group defines the internal control system as a set of mechanisms intended to ensure control of its development, profitability, risks and business operations. These mechanisms seek to ensure that:

  • risks of any kind are identified, assessed and managed; 
  • operations and behaviours are in accordance with the decisions made by the management bodies, and comply with the laws, regulations, values and internal rules of the Group; as concerns financial information and management more specifically, they aim to ensure that they accurately reflect the Group’s position and business; and 
  • these operations are carried out to ensure effectiveness and efficient use of resources.

Lastly, this system provides managers with access to the information and tools required for the proper analysis and management of these risks. It also ensures the accuracy and relevance of the Group’s financial statements as well as the information disclosed to financial markets.

5.3.1Internal control system

Risk governance uses an internal control system compliant with the provisions of the Solvency II Directive and the French decree of November 3, 2014 on the internal control of companies active in banking, payment services and investment services and subject to ACPR supervision.

It is divided into three lines of defence that structure the Group’s risk management and internal control policy as presented below:

/Risk management lines of defence
COA2021_URD_EN_F042_HD.png
First line of defence: risk assessment and incident management

The operational functions are in charge of the proper assessment of the risks generated by their activities as well as for level one controls that enable them to ensure the correct execution of their operations. To do this, they have their own governance, most often based on risk-taking delegation systems and operational committees where risks are assessed and decisions made in accordance with the Group’s operating rules. Their risk assessment and management work is laid out by the control functions on an annual basis, in particular through level one control plans.

Second line of defence: independent control by the risk management function and the compliance function

The risk management and compliance functions establish a strong risk management culture within the Company and are responsible for ensuring that the risks identified by the operational functions are effectively managed, in particular through the preparation of a risk map and level two control plans.

These two functions work closely together with the support of a dense network of more than one hundred risk and/or compliance officers in the Group’s various countries. To do this, they have a centralised tool used in all entities to manage and launch level one and level two control plans, record operational or compliance incidents, update the risk map and business continuity plans and monitor action plans intended to address identified weaknesses.

Third line of defence: the audit function

The internal audit function provides an independent assessment of the efficiency of the risk management mechanism and more broadly, of all the Group’s activities and processes, following a multi-year audit plan.

Role of the key functions

The Solvency II regulatory framework grants the Chief Executive Officer and, as applicable, the Deputy Chief Executive Officer, the status of executive directors of a group. It authorises the appointment by the Board of Directors of one or more other executive directors.

Each key function is controlled by the Chief Executive Officer or the effective manager and operates under the ultimate responsibility of the Board of Directors. It has direct access to the Board for reporting any major problem in its area of responsibility. This right is enshrined in the Board of Directors’ Rules of Procedure.

The professional qualifications, knowledge and experience of the heads of key functions should be adequate to enable sound and prudent management, and they must be of good repute and integrity.

Key functions are free of influences that may compromise their capacity to carry out the tasks assigned to them in an objective, loyal and independent manner.

Since 2017, regional audit, risk and compliance functions report to managers in charge of these functions at Group level. Similarly, subject to compliance with local regulations, the same reporting line by function has been established between country and regional managers.

Risk management function

Under the responsibility of the Chief Risk Officer, the risk management function, including the internal control function, covers all the Group’s risks and reports to the Group Risk and Compliance Committee.

It is tasked with assessing the relevance and effectiveness of the internal control system. Regarding Solvency II, it works closely with the actuarial function and is responsible for drafting reports and for prudential oversight. To perform its duties, the risk management function has direct access to Board meetings.

It ensures that risk policies are defined in accordance with regulatory requirements and monitors their application. The policies are reviewed annually by senior management, then approved by the Board of Directors. They are then communicated to all the Group’s entities, thereby helping to forge a common risk culture.

The risk management function, including the internal control function:

  • implements and monitors the risk management system;
  • monitors the Group’s overall risk profile and identifies and assesses emerging risks;
  • reports on risk exposure and advises the Board of Directors on risk management matters;
  • defines and monitors the Group’s appetite (1) for such risks: the risk appetite takes into account six dimensions through 18 indicators;
  • validates the partial internal model and other operational models;
  • updates the mapping of risks to which Coface is exposed, working closely with the operational functions;
  • contributes to improving and formalising level one control activities implemented by operational staff;
  • performs level two checks on operational risks, with the exception of non-compliance risks;
  • ensures that continuity plans are regularly tested in all entities;
  • collects data on incidents and losses from the various entities.

The Group’s Risk Management Department leads a network of seven regional risk managers for each region. The regional risk managers also lead a network of correspondents in the countries within their geographic scope. Specifically, these correspondents are responsible for performing the centrally established level two controls at local level, verifying compliance with Group rules and monitoring the progress of action plans.

Compliance function

The compliance function is in charge of developing best practices and preventing non-compliance risk within all Coface Group companies.

The compliance function’s scope includes:

  • financial crime prevention:
    • prevention of money laundering and terrorist financing,
    • compliance with embargoes, asset freezes and other international financial sanctions,
    • fraud prevention, prevention of active/passive corruption and influence peddling (Sapin II law);
  • protection of clients and third parties:
    • business ethics,
    • relations with suppliers;
  • data protection and confidentiality;
  • professional ethics (management of conflicts of interest);
  • prevention of agreements or arrangements between competitors;
  • compliance with laws and regulations applicable to insurance activities.
Internal audit function

The Group’s Internal Audit Department is placed under the responsibility of the Group Audit Director, who is also in charge of the internal audit key function. The Audit Director attends the Group General Executive Committee meetings in an advisory capacity and reports to the Group’s Chief Executive Officer.

The structure of the internal audit function is based on a reporting line to the Group Audit Director.

An internal audit policy defines the purview of the function. The key objectives of this function include evaluating all or a selection of the points below, according to the scope of each assignment, and reporting on them:

  • the quality of the financial position;
  • the level of risks effectively incurred;
  • the quality of organisation and management;
  • the consistency, adequacy and proper functioning of risk assessment and control systems, and their compliance with regulatory requirements;
  • the reliability and integrity of accounting information and management information, including information linked to Solvency II issues;
  • compliance with laws, regulations and the Group’s rules (compliance). The audit checks the quality and relevance of the procedures implemented to ensure compliance with laws, regulations and professional standards applicable to the audited activities in France and abroad, and with the Group’s policies, decisions by its corporate bodies, and its internal rules;
  • the quality, effectiveness and smooth operation of the permanent control mechanism and other components of the governance system;
  • the quality and level of security offered by the information systems; and
  • the effective implementation of the recommendations of prior audit missions, whether they derive from the proceedings of the Group’s audit function or from external audits by the supervisory authorities.

Assignments are set out in an audit plan approved by the Board of Directors and cover the entire Group scope over a limited number of financial years. An audit ends with a written report and recommendations which are implemented under the supervision of the audit function.

The independence of the audit function is inherent in its mission. There should be no interference in the definition of its field of action, in the fulfilment of its proceedings or in the disclosure of the results of those proceedings.

The Group Audit Director has full authority to refer matters to the Chairman of the Audit Committee and has free access to the Audit Committee. If necessary, and after consulting the Chief Executive Officer and/or the Chairman of the Audit Committee, the Group Audit Director may inform the ACPR (French Prudential Supervision and Resolution Authority) of any breaches observed.

The Group Audit Department has no operational activity. It neither defines nor manages the mechanisms that it controls. The internal auditors have no other responsibility under any other function. Lastly, the Group Audit Department has access to all the information required to carry out its duties.

Actuarial function

The actuarial function is performed by the Director of the Actuarial Department, who has reported to the Chief Financial Officer since July 1, 2016. It is tasked with advising senior management and supporting its efforts to ensure the Group’s long term solvency and profitability and with overseeing compliance with Solvency II requirements, such as the recording of reserves. To perform its duties, the actuarial function has direct access to Board meetings.

The actuarial function is the point of reference for actuarial matters for several Group departments (Finance, Information, Commercial, Marketing and Claims & Collections) in all Group entities. In particular, it informs the Board of Directors on the appropriateness of the calculation of technical provisions.

In accordance with the requirements of the European Solvency II Directive, the actuarial function is in charge of the following:

  • coordinating the calculation of technical provisions;
  • ensuring the appropriateness of the methodologies, underlying models and assumptions used in the calculation of technical provisions;
  • assessing the adequacy and quality of data used in the calculation of technical provisions;
  • comparing best estimates against experience;
  • informing the administrative, management or supervisory bodies of the reliability and adequacy of the calculation of technical provisions;
  • overseeing the calculation of technical provisions in the cases specified in Article 82 of the Directive (approximations related to data quality issues in the estimation of technical provisions);
  • expressing an opinion on the overall underwriting policy;
  • expressing an opinion on the adequacy of reinsurance arrangements; and
  • contributing to the effective implementation of the risk management system referred to in Article 44. In particular, it ensures compliance with reserving and underwriting policies and the correct implementation of reinsurance.

5.3.2Accounting control system

The accounting control system assigns some of the responsibility for controls to the Chief Financial Officer (CFO) of each region.

Local CFOs are responsible for:

  • the local accounting system (compliance with local regulations and Group rules);
  • IFRS financial statements as reported in the Group consolidation tool (compliance with IFRS regulations and Group rules);
  • financial risks, in particular compliance with the principle of matching of assets and liabilities in order to limit the financial risks on their balance sheets.

At Group level, the Group CFO is responsible for:

  • the quality of financial information;
  • the definition and monitoring of the investment policy;
  • the management of financial risks and the implementation of the rules for managing other risks, with the support of the Risk Department; and
  • the management of solvency, in particular relating to the Solvency II framework.

The Group’s Accounting and Tax Department provides the regions with a control and reporting tool that enables proper oversight of reconciliations between management applications and the accounting tool.

Since the Q1 2018 reporting date, quarterly level one controls have been formalised within the ENABLON tool:

  • a list of controls to be carried out each quarter as well as instructions on the details and supporting documents requested;
  • the results of controls carried out by the entities;
  • proof of the controls performed.

This tool improves the tracking and formalisation of level one controls carried out on accounting processes in each country. An assessment of the controls is carried out every quarter.

This process provides a full audit trail and produces standardised, reliable data across the Group and the Company.

Processing of accounting and financial information

The Group’s Accounting and Tax Department, reporting to the Finance Department, guarantees the quality of the financial information and is responsible for the control of the Group’s accounting and tax information. It is also responsible for the production of the consolidated financial statements, the parent company financial statements, and the tax declarations of French entities (COFACE SA, parent company, Compagnie française d’assurance pour le commerce extérieur, Cofinpar, Fimipar and Cogéri).

Its tasks include:

  • maintaining the general and ancillary accounts of entities located in France;
  • accounting for operations, control and justification of operations;
  • closing the quarterly accounts;
  • producing consolidated financial statements;
  • producing reports presenting the accounts: producing financial statements, internal reports and tax declarations;
  • relations with the Statutory Auditors;
  • preparing Group standards, regulatory oversight and strategic projects;
  • setting and drafting Group accounting rules;
  • drafting and monitoring accounting procedures;
  • monitoring changes in accounting and tax regulations;
  • assisting, training and providing technical support to subsidiaries and branches;
  • producing analysis and reports on the impact of changes in scope on the consolidated financial statements;
  • the accounting control system: monitoring the proper application of the standards and procedures in the Group;
  • Group taxation.

Coordination with the Group’s entities is based on the Group’s functional matrix principles, under which the entities are delegated certain responsibilities pertaining to their scope. As such, the consolidated entities are responsible for producing the following, in accordance with their local standards and IFRS:

  • accounting information;
  • tax information;
  • regulatory information;
  • corporate information.

They also monitor the production of consolidation packages according to the Group’s standards and procedures.

Common tool for general accounting, consolidation and management control

The monthly management control reports and quarterly accounting packages prepared under French standards and IFRS are entered into the same tool. The quality of the information received is improved through automatic reconciliation statements.

Additional controls are carried out at quarterly closing dates, especially using summary accounts and comparisons with management data. Consistency checks are carried out with the data received from management control reporting.

Overall controls are performed on consolidation operations: analytical review of the balance sheet and income statement, closure of the Company’s equity, consistency check on the most significant items and entities, closure of the net book value of all branches, checking of intra-group transactions and their reconciliation, specific verification of reinsurance income and specific checks on the breakdown of expenses by destination. This analytical review allows for a verification of the overall consistency of the accounts.

Disclosure requirements for financial and accounting information

The Financial Communications Department, which reports to the Group Finance Department, produces, with the support of other departments, the financial information released to the financial markets, analysts and investors. The departments concerned provide the Financial Communications Department with contributions and reviews that help it mitigate the risk of material error or the release of inaccurate information.

5.3.3Governance of the internal control system

Governance structure

The Group has implemented a risk management and control system that revolves around clear governance supported by a dedicated organisation based on the key functions described above. This is illustrated in the diagram below, which shows the link between the three lines of defence as described above and the committees that report to Coface’s Board of Directors and senior management.

/Governance structure
COA2022_URD_EN_G035_HD.png

Section 2.1.3 details the duties and activities of the Board of Directors and its specialised committees.

Governance under the authority of senior management relies on the Coface Group Risk and Compliance Committee, which in turn draws on specialised Risk Committees at the head office to address the major risk categories (credit, financial, strategic, operational and reinsurance risk). In addition, each of the seven regions where Coface operates has a regional Risk Committee, on which the Group is represented by the Chief Risk Officer and the Chief Compliance Officer.

The Group Risk and Compliance Committee is chaired by the Chief Executive Officer and meets at least every quarter with the members of the Group Management Committee, the Group’s strategic and operational management body, the Group Chief Risk Officer, the Group Chief Compliance Officer, the Group Audit Director and the Head of the Actuarial Department. Representatives of the operational or functional departments concerned also attend depending on the matters at hand.

Below is a summary of the committee’s main duties and actions during 2022:

Main duties of the Group Risk 
and Compliance Committee


Main topics reviewed in 2022

  • Review of the main risk management policies and procedures
  • Review of ORSA assumptions and results for the purpose of their approval by the Board of Directors
  • Proposal and monitoring of risk appetite limits
  • Monitoring of the Group’s risk exposure in all its dimensions
  • Review of the main conclusions of sub-committee meetings
  • Acknowledgement of the work performed by the compliance function
  • Regular approval of the performance and results of the partial internal model

The Group Risk and Compliance Committee reports on its work to the Audit and Accounts Committee or to the Risk Committee, as appropriate.


  • Validation of Solvency II risk policies and regulatory reports (SFCR, RSR, ORSA)
  • Review and adaptation of ORSA scenarios, consideration of additional scenarios on stagflation and climate risks
  • Review of risk appetite indicators and their relevance
  • Validation of the risk map
  • Analysis of the impact of the conflict between Ukraine and Russia on the Group’s main risks, particularly on the solvency ratio
  • Focus on the Group’s outsourcing policy and the methodology for evaluating the services provided
  • Business continuity: presentation of Coface Group’s level of resilience in the event of power outage
  • Monitoring of the Group’s insurance coverage
  • Modelling risk: Presentation of changes made to Coface’s partial internal model and reporting of ACPR findings on model changes
  • Presentation and monitoring of changes in the Company’s data management strategy
  • Cyber risk monitoring: exposure, strategy and sharing of the Group’s policy
  • Sharing of analysis on the Group’s degree of alignment with the European digital operational resilience regulation (Digital Operational Resilience Act)
  • Validation of compliance policies and regulatory reports (anti-money laundering questionnaires, internal control report on anti-money laundering and counter-terrorist financing compliance)
  • Follow-up of audits and closure of audit recommendations
  • Presentation of the level one and level two permanent control plan relating to operational and compliance risk, the results of controls and associated action plans
  • Monitoring the Compliance Department’s actions in terms of anti-money laundering and counter-terrorist financing, anti-corruption, fraud prevention, personal data protection and reviewing the main conclusions of the Fraud Committee and the Personal Data Protection Committee
  • Monitoring of compliance training completion rates
  • Monitoring of compliance key performance indicators and compliance incidents as well as the remediation plans implemented
  • Presentation of sanctions decisions issued by the ACPR’s Sanctions Committee and related complaints
2022 major points of interest

Russia’s invasion of Ukraine in February 2022 added to uncertainty about the global economic recovery in the medium term after two years impacted by the Covid-19 crisis. The Group Risk and Compliance Committee monitored the Ukrainian crisis closely and constantly, taking the necessary measures to preserve the interests of both Coface and its clients. These measures included monitoring the Group’s exposure, strengthening the compliance teams as a result of the toughening of European Union sanctions against Russia and carrying out a stress test on the Group’s solvency ratio, which confirmed the limited impact of the crisis.

In response to constantly changing threats, the Group Risk and Compliance Committee continued the action it initiated in 2021 to strengthen the Group’s cyber resilience policy with the definition of new milestones in 2022 focusing on raising employee awareness of cyber security, defining a crisis scenario and carrying out tests.

Minor changes were also made to the partial internal model.

(1)
The risk appetite represents the risk levels the Group wants to and can accept, with the purpose of reaching its strategic objectives and achieving its business plan.

5.4Outlook

The Group does not expect the situation to return fully to normal in 2023 and its teams will continue to monitor the economic situation, which is deteriorating in emerging countries in particular, and the tense geopolitical situation, which could disrupt its business activity.

In this context, it will continue to manage its debtor risk carefully and prudently and, if necessary, will implement action plans to contain this risk, as it did in previous years. The structure of the reinsurance programme over several years offers good visibility for the management of debtor risk. With regard to financial and investment portfolio risks, the Group does not intend to significantly change its refinancing structure, which has proven its resilience, or its investment allocation, on which it will continue to act prudently. It will continue to invest in strengthening its risk management programmes, including cyber risk, non-compliance risk and ESG (Environmental, Social and Governance) risk, in order to address the changes that are under way in these areas.

CSR STRATEGY INTEGRATED 
INTO THE BUILD TO LEAD STRATEGIC PLAN

INvestments: GH emission reduction 
reduction target of 30% (scope 1 & 2) 
equities and corporate bons by 2025

4,721 employees 
in 58 countries

88/100 
GENDER EQUALITY INDEX AT GROUP LEVEL

Completed a full carbon footprint assessment (base year: 2019) 
43,000 T Co2 Eq. emitted by operations (incl. scope 1, 2 & 3)

(1)
The Group’s loss ratio (before reinsurance) corresponds to the ratio of claims expenses to gross earned premiums (that is, the sum of gross earned premiums and provisions for unearned premiums), net of premium repayments.
(2)
According to the Standard & Poor’s rating scale, all bonds rated at least BBB- are considered investment grade, and bonds with a rating of BB+ or lower are considered to be high yield debt.
(3)
A bond’s modified duration measures its loss of value in the event of a rise in interest rates. Thus, a bond with a modified duration of 4 will see its market value decrease by 4% if interest rates rise by 1%.
(4)
This position is hedged through the use of derivatives for which the change in value is recorded directly in the income statement under IFRS, as the Group has not opted for hedge accounting within the meaning of IFRS for this transaction and this underlying asset.
(5)
The main objective of Active Directory is to provide centralised identification and authentication services to a network of computers using Windows, macOS or Linux systems.
(6)
The risk appetite represents the risk levels the Group wants to and can accept, with the purpose of reaching its strategic objectives and achieving its business plan.

6. NON-FINANCIAL PERFORMANCE REPORT

Coface’s purpose is to facilitate trade in domestic and export markets. Supporting the development of “B2B” trade brings with it a responsibility that the Group places at the centre of its governance, operations and communication through its “For Trade” baseline. At Coface, we believe in trade as a positive force for the world and we want to actively contribute to it.

The Coface Group has made a commitment to cooperate in the field of corporate, environmental and societal issues for several years now. In 2003, it joined the United Nations Global Compact, through which it supports in its sphere of influence the ten principles of the Global Compact relating to human rights, international labour standards and the fight against corruption. Coface’s human resources (HR) policy reflects its economic and corporate plan. It contributes to and accelerates the Coface Group’s strategic transformations, while controlling its environmental impact and ensuring the engagement of its employees.

Since 2022, Coface has participated in “Meetings between businesses and Civil Society” organised by Common Stake to forge a better understanding of civil society actors and share constructive views and thinking on current societal changes and those to be carried out for an ecological and social transition on various topics, such as the climate and the respect for human rights. These meetings take place in person and take the form of a half-day of debates, presentations and discussions, organized every two or three months.

/Recognition from non-financial agencies

Agencies

Rating and assessment

COA2022_URD_FR_NOTATIONS_p03_HD.png

AAA

Leader


COA2022_URD_FR_NOTATIONS_p01_HD.png


57/100

Robust

COA2022_URD_FR_NOTATIONS_p02_HD.png

C in 2022

Prime status

(2nd decile of insurers)


COA2022_URD_FR_NOTATIONS_Morningstar_p01_HD.png


16.6

Low risk

In accordance with the requirements relating to the statement on non-financial performance, the Company this year is presenting its business model in the section entitled “Overview of Coface” (Chapter 0), as well as the main non-financial risks and challenges relating to its business (see next page).

To reinforce its approach to responsibility and make it a key component of its business activities, the Coface Group has mapped its non-financial risks since 2018. This mapping was revised and improved in the 2022 financial year to refine the qualification and quantitative assessment of risks, as well as their inclusion in the Group’s overall strategy. This exercise rounds out the risk maps already monitored by the Group and presented in Chapter 5.

The process of non-financial risk mapping is detailed in paragraph 6.7.1.

The following table summarises the main non-financial risks identified by Coface. The nature of these risks and the policies implemented to address them, as well as the main indicators monitored by Coface, are detailed in Chapter 6.The following table summarises the main non-financial risks identified by Coface. The nature of these risks and the policies implemented to address them, as well as the main indicators monitored by Coface, are detailed in Chapter 6.

Cross-reference table for the Universal Registration Document (URD):

Business model


Description


URD reference

Main activities of the Group, organisation, business model, 
strategy and objectives


Chapter 0 – 
Overview
 of Coface

Non-financial risks and identified impact


Main policies in place


KPI

URD reference

R.1 – Inadequate protection against data leaks

  • Risk of financial loss, damage to operating systems and damage to the company’s image


Chapter 5

R.2 – Unsuitable cybersecurity solutions or poor management of a cybersecurity incident

  • Risk of financial loss, damage to operational systems and company image, data leakage


Chapter 5

R.3 – Non-satisfaction of clients and partners

  • Risk to brand credibility and loss of market share, pressure on prices


  • Programme to improve service quality


  • Monthly survey response rate: 11.4% on average in 2022
  • NPS tracked internally

6.2.1

R.4 – CSR insufficiently integrated into the commercial policy

  • Risk of loss of business opportunities and competitiveness. In the long term, inability to meet the expectations of investors and clients


  • Commercial exclusion policy, ESG and transition projects covered by the Single Risk activity, consideration of environmental criteria in financial risk management, GBA as a tool for tracking our debtor portfolio


  • Amount of ESG outstandings covered by the Single Risk activity at end-2022: €350m

6.2.2

R.5 – Investment in non-responsible assets from an environmental, governance or social standpoint

  • Asset depreciation and reputational risk


  • Investment policy


  • Percentage of portfolio rated F: 0.61%
  • Portfolio carbon emissions: 53 tCO2e/€m (Scopes 1 and 2)
  • % of green bonds: 2.9%

6.2.3

R.6 – Fair practices/Failure to control acts of corruption involving Coface employees or third parties as part of Coface’s business activities

  • Risk of legal, administrative or disciplinary sanctions, significant financial loss or damage to reputation


  • Anti-Corruption Code
  • Code of conduct
  • Employee training and awareness programme
  • Corruption risk mapping
  • Third-party assessment system
  • Whistleblowing system


  • Number of corruption allegations reported to Compliance: 2

6.2.4

b. II.

+ Chapter 5

R.7 – Fair practices/Failure to fight against tax evasion by Coface and/or clients using a Coface solution

  • Risk of legal, administrative or disciplinary sanctions, significant financial loss or damage to reputation


  • Group tax policy adapted at regional level through seven regional tax correspondents and KYC (Know Your Customer)
  • Mandatory on a quarterly basis:
    • statements by country CFOs on financial arrangements and controls (DAC6) in Europe
    • global task-risk mapping


  • Number of alerts under DAC6 regulation, for the European Union: 0
  • Result of regular tax audits

6.2.4

c)

R.8 – Lack of diversity, inclusion and equal opportunities

  • Risk of not exploiting all the potential of the company; legal sanctions; reputation; and a decline in the company’s performance/lack of innovation


  • “Diversity & Inclusion” policy


  • Percentage of women among employees: 54%, among managers: 41%, among Senior Management: 34%
  • Number of nationalities among employees: 80
  • Gender Index: 88/100
  • “My Voice Pulse” score on “D&I” issues 8.4/10

6.3.3

R.9 – Lack of attractiveness for Talents (recruitment and retention: development, onboarding of newcomers, etc.)

  • Risk of difficulty in recruiting and retaining Talents: risk of unsuccessful recruitment, high staff turnover, disengagement of employees that could lead to reputational risk and a decline in the company’s performance


  • Group Human Resources strategy including a “Talent” component
  • Short-term assignment policy
  • International occupational mobility policy
  • Compensation policy


  • Number of employees on international transfers: 95
  • Turnover rate of employees identified as high-potential: 8.3%
  • Senior management: percentage of internal applicants vs. external candidates: 64% of internal staff vs. 36% of external staff
  • “My Voice Pulse” engagement score: 7.46/10

6.3.4

R.10 – Inappropriate management of Coface’s carbon footprint

  • Reputational risk


  • Carbon footprint assessment completed and carbon footprint reduction plan/trajectory
  • Travel policy
  • Car policy
  • Internal awareness campaigns


  • CO2 consumption, Scope 1, 2 and 3 – based on most recent carbon assessment (base year 2019): 373 k tCO2eq including investments (Amundi figures), operations and claims
  • Emissions from electricity consumption: 1,469 tCO2eq
  • Train travel emissions: 48 tCO2eq and airplane 470 tCO2eq
  • Emissions related to fuel consumption: 1,743 tCO2eq

6.4

For greater clarity, the number of the risk will be referred to at the beginning of each chapter (R.1, R.2, etc.). These figures do not correspond to a risk hierarchy but rather to the order in which they are addressed in the chapters.

The statement on non-financial performance has been drawn up to meet the requirements of Articles L.225-102-1 and R. 225-104 to R. 225-105-2 of the French Commercial Code.

6.1Overview of Coface’s CSR strategy

The CSR strategy is an integral part of the Build to Lead strategic plan.

Since March 2021, a Group CSR Manager has been responsible for enhancing Coface’s CSR strategy and rolling it out in coordination with the various departments. The Group CSR Manager reports directly to Carole Lytton, Group General Secretary.

Work on enhancing the CSR strategy was organised at the beginning of 2021 and Coface decided to map the pillars of its CSR strategy relative to the UN Sustainable Development Goals (SDGs), a global benchmark in this area, so as to focus on desired global impacts.

The Group has prioritised 11 of the 17 SDGs, most of them selected for their relevance to Coface’s business and the management of its employees.

Other SDGs, for example “quality of education”, have been deliberately prioritised given the management team’s sensitivity to these issues. The latter has been chosen as a priority in the company’s future commitments with organisations around the world.

COA2022_URD_EN_G033_HD.png
The approach has been restructured around three pillars:
  • a responsible insurer that harnesses its core businesses to contribute to a more sustainable world;
  • a responsible employer to take into account Coface’s social and societal impact, including employee development and commitment;
  • a responsible company that works to actively reduce its environmental footprint.

These three pillars are underpinned by a foundation called “Driving the culture”, aimed at structuring the Group’s ESG approach and developing a solid responsible culture among all Coface stakeholders through a communication plan. This last pillar is essential to the success of the first three.

The pillars will be explained in more detail in the sections below.

6.2Coface, a responsible insurer

A RESPONSIBLE INSURER


Main pillar themes:


COA2022_URD_EN_ODD-1_HD.png


Client satisfaction

R.3

Integration of CSR into the commercial policy:

  • commercial exclusion policy;
  • contribution to financing the sustainable transition: Single Risk ESG projects;
  • consideration of environmental risk in credit risk assessment (financial risk);
  • GBA as a tool for tracking the environmental impact of the debtor portfolio.

R.4

Environmental and social impact of investments

R.5

Fair practices:

  • subcontracting and suppliers;
  • compliance (professional ethics, anti-corruption, fraud and money laundering, international sanctions and personal data);
  • tax evasion


R.6

R.7

Convinced that its core impact is generated by its business operations, Coface has decided to undertake several structural projects internally.

6.2.1Client satisfaction

Coface’s purpose is to facilitate B2B trade in domestic and export markets alike. All the items of value provided by Coface as a credit insurer – macro-economic risk analysis, the selection and supervision of commercial counterparties, insurance protection in the event of unpaid payments and the reduction of unpaid amounts through active recovery – contribute to this purpose. In times of economic difficulties, the increase in risks nevertheless leads to a tightening of the group’s underwriting policy, which inevitably impacts client satisfaction. This risk is regularly echoed in the economic press, as was the case during the economic crisis caused by the Covid-19 outbreak in 2020.

The Group’s management in the various phases of the economic cycle hinges on striking the right balance between sound risk management and support of the business flows of insured clients. However, persistent client dissatisfaction could indicate a deviation from the Group’s stated purpose, leading to a loss of market share, pressure on prices, a deterioration in the company’s results and at the same time a reduction in the Group’s contribution to the smoothness of B2B trade. Which is why it is vital to manage and measure this risk.

To address the risk of a deterioration in client satisfaction, Coface has implemented a policy on the continuous improvement of service quality. This policy is based on operational programmes using techniques such as Lean Management, UX-UI and the Customer Journey. It is measured through a series of KPIs (including the Net Satisfaction Score, Net Promoter Score and Customer Experience Index) monitored on a monthly basis by the Service Quality Board, a cross-functional body responsible for managing service quality and client satisfaction.

This Group priority was confirmed by the appointment in 2021 of a Chief Operating Officer tasked with reinforcing Coface’s programme on operational excellence and service quality and further improving the client experience.

To measure client satisfaction, the Group has chosen the Net Promoter Score (NPS) as a key indicator. Also known as the net recommendation rate, the NPS gives a voice to clients, calling on them to rate their likelihood of recommending the company on a scale of 0 to 10. This indicator is interesting because it indicates an attachment to the company and is forward-looking.

The NPS is measured as a monthly moving average over three consecutive months. It is based on a monthly survey with a rotating sample. Every month, around 10% of clients are surveyed, the monthly rotation serving to prevent excessive solicitation. Using this methodology, the Group was able to report an average response rate (number of questionnaires approved/number of emails sent) of 11.4% in 2022, consistent with the response rates generally observed for this type of survey. The sampling of each wave of the survey is balanced in terms of client countries, segments and distribution network so that the results can be correctly compared. However, the number of responses collected does not allow statistically reliable segmented analyses to be performed on a monthly basis. Any trends detected are therefore subject to qualitative additions, for example by calling “detractor” clients, which the Group has rolled out widely as part of its quality approach.

After falling at the beginning of the pandemic, Coface’s NPS indicator rose to a satisfactory level owing to the Group’s ability to adapt and had improved significantly by April 2021. In 2022, the Group’s average NPS remained at historically high levels. This trend should be put into perspective with the very high coverage rates (1) that the Group proposed over this period, themselves enabled by the extremely limited levels of insolvency in the economy resulting from price pressures and the instability corresponding to the conflict in Ukraine. It should be noted that this sustained support for clients in terms of risk acceptance is recognised even though inflationary pressures automatically increased the levels of coverage requested. At end-2022, the initial signs of a return to normal in insolvency levels make it possible to envisage a shift in trends in coverage ratios and NPS in the coming months.

6.2.2Integration of CSR into the commercial policy

a)Commercial exclusion policy

In commercial terms, Coface is duty bound to demonstrate irreproachable ethical standards, in particular through its commercial exclusion policy. The latter reflects the Group’s determination to avoid non-ethical and/or non-responsible business activities, contribute to the Paris Agreement by withdrawing from thermal coal, and manage reputational risk.

This policy has been strengthened over the past three years.

For example, in thermal coal, a sector with a substantial contribution to climate change, Coface has made several commitments as part both of its credit insurance business and its single-risk and bonding activities:

Single Risk and bonding

  • Coface has stopped providing single-risk credit insurance policies and bonding services for thermal coal extraction or thermal coal generation projects;
  • Coface does not issue policies to insure sales of thermal coal by commodity traders;

Credit insurance

  • Coface does not issue policies to insure sales of thermal coal by commodity traders;
  • Coface does not issue insurance policies to transport, freight and logistics companies seeking to generate over 50% of their business through thermal coal.

In other respects, business conducted under the credit insurance policies issued by Coface or its partners must not directly include activities related to fatal drugs (non-pharmaceuticals), gambling, pornography, or trade in endangered species.

Moreover, for all credit insurance, single-risk and bonding activities, and in addition to the underwriting framework for the strictly controlled defence industry as part of CSR directives (anti-personnel mines or cluster bombs, etc.) and the Group’s compliance rules (list of country risk levels, KYC), an extremely restrictive underwriting policy is implemented in the defence industry sector in terms both of sensitive countries and sensitive equipment:

  • a sensitive country is a non-OECD country, or any country not qualified as a full democracy or a “flawed” democracy (i.e. a hybrid regime and authoritarian regime) by The Economist in its democracy index (2);
  • sensitive equipment is constituted by fatal equipment (including weapons, ammunition, missiles, mortar canons, tanks, armed vehicles, rockets, war ships and submarines, and electronic missile guidance equipment).

Trucks, unarmed helicopters, bullet-proof vests, surveillance systems and other equipment are not considered as sensitive equipment.

b)Contribution to financing the sustainable transition: single-risk ESG deals

Single Risk accounts for approximately €16 million of Coface’s total revenue of €1,568 million (as explained in part in Section 1.3.1).

In addition to the commercial exclusion policy, Coface wants to give itself the means to strengthen its support for financing and implementing long-term ESG projects by implementing more single-risk insurance solutions. Coface is seeking to double the budget allocated to supporting ESG projects around the world, with a view to reaching a minimum of €400 million of outstanding under management on ESG projects by the end of 2025 (vs. mid-2022).

Single-risk solutions are hedging products that protect against long-term commercial and political risks. This decision therefore concerns the projects of companies, banks or multilateral institutions that meet E, S or G objectives in sectors such as renewable energy, energy efficiency, soft mobility, water treatment, healthcare, education and microfinance. This demonstrates Coface’s growing commitment to supporting initiatives with a positive environmental or social impact on economies through financial solutions.

Assets under management on ESG projects carried out by Coface totalled some €200 million in the summer of 2022 and are already growing substantially, reaching around €350 million at end-2022, i.e. 12.5% of single-risk assets.

Projects are characterised as ESG according to the following process:

  • qualification of a positive E, S or G impact from the sales representative managing the file and proposal of an ESG tag in the tool;
  • qualitative analysis of documents by the daily Single Risk Committee meeting, for each project;
  • third analysis by risk underwriters.

ESG projects also concern sectors eligible for the European Taxonomy on climate change mitigation and climate change adaptation. Only activities eligible for the European Taxonomy can be considered as ESG in the single-risk tracking tool, Sonata. The latter been enhanced to adapt the classification of its business sectors and propose “ESG project” eligibility. Sonata is used to monitor, approve and report on outstanding on these projects.

In terms of governance, the daily Single Risk Committee meeting assesses, among other things, the ESG criteria of projects. Where applicable, the Group CSR Manager may take part. In addition, the monthly meeting of the Committee will assess progress on ESG outstandings by category of impact and typology, and the quarterly Group CSR Committee meeting will also be responsible for tracking ESG assets.

In addition to its goal on supporting ESG projects, the Single Risk Department is committed to limiting its coverage of projects in the oil and gas extraction sector (upstream oil and gas) to no more than €75 million.

c)Consideration of environmental risk in credit risk assessment (financial risk)

As a credit insurance expert, Coface carries risks on companies operating in numerous countries and business sectors.

As such, the environmental vulnerability of debtors that may lead to an increase in the volume of claims to be compensated is taken into account in the management of credit risk.

For example, from a macroeconomic perspective, Coface integrates components relating to ESG standards into its methodology for assessing country risk through three of the main pillars; 

  • F: Environment; 
  • P: Policy (e.g. the existence of discriminatory or non-discriminatory laws, this pillar echoing the social dimension of ESG); and 
  • B: Business Climate.

From an environmental point of view, two key risks for companies have been identified:

  • Physical risk measures the frequency of occurrence of exceptional weather events (such as the fires in Brazil and Australia in 2019). It depends on the country’s exposure to this type of event (measured notably by taking into account long-term projections of agricultural yields, rising temperatures in the country, rising sea levels, etc.) and its sensitivity, measured by indicators of geographical, demographic and social structure (such as the share of the rural population and the population over 65, and the poverty rate) and the dependence on other countries for goods that will become rarer with climate change (share of imports in total farming produce, water and energy);
  • Transition risk: faced with these future climate changes and in an effort to avoid some of them, governments are taking action (such as anti-pollution standards in the automotive sector in Europe and China) and the population is changing its consumption behaviour. While these regulatory and behavioural changes will have beneficial effects in the medium term, in the short term they are likely to jeopardise companies having failed to prepare for these changes in production and consumption methods. The index used for this sub-pillar of transition risk mainly measures the tracking of progress on green transition performance and what remains to be done to meet global targets (country emissions levels, energy efficiency of main business sectors, investments to foster the energy transition).

The exposure index is used to measure the extent to which a country can be vulnerable to climate disruption and captures the physical impact of climate risk. The sensitivity index, based on topographic and demographic variables as well as the country’s economic structure (i.e. sensitivity of the country’s main sectors of activity to a climate shock), makes it possible to assess the impact of a climate shock.

These two indices combined are used to assess a country’s vulnerability to climate hazards and are based on six sectors essential to a country’s proper functioning: food, access to water, the health system, ecosystem services, human habitat, and infrastructure. A country is considered to be highly exposed if a climate hazard can significantly limit access to drinking water, cause food insecurity, or if the quality of infrastructure is not sufficient to respond to this type of crisis. At the same time, a country is considered to be highly sensitive where it relies heavily on imports to meet its needs.

In addition, Coface teams assess the financial risk represented by each debtor through an internal rating, the DRA, reflecting the likelihood of default in the short and medium term.

New environmental initiatives and regulations may have a broad array of impacts:

  • varying degrees of strategic reorientation;
  • change in industrial process;
  • change of suppliers, etc.

These impacts may call for substantial investment that impact company profitability either temporarily or sustainably, at the risk of market loss or sanctions, for example.

These aspects form part of the entire set of information taken into account by Coface when analysing risk and deciding on hedging.

For example, the impacts of the current changes in the automotive sector vary substantially from one player to the next. Large carmakers are investing huge sums to alter their ranges (for some companies, in addition to considerable penalties for past activities). These manufacturers are demonstrating a strong capacity for change and resilience to changes in the market. The same cannot be said of small and less flexible subcontractors that are already under pressure in terms of finances, lack the capacity to make these changes, and whose business is structurally on the way out.

This resilience assessment is fully integrated into financial analysis and the usual credit risk monitoring tools.

d)The GBA as a tool for tracking the environmental impact of the debtor portfolio

As a credit insurer, Coface does not finance companies or its projects and does not intervene directly in commercial transactions, the latter remaining in the hands of the insured party and its client. However, the outstanding guaranteed by Coface concern companies having their own environmental impact. The Coface Group has thus decided to implement a tool to measure the environmental impact of the debtors making up its guaranteed exposure. This tool will later be used to steer Coface’s business towards more environmentally responsible activities and thereby reduce reputational risk or investor withdrawals.

Coface has developed an internal system for assessing companies in the form of an “environmental” index designed to rate businesses according to their environmental impact.

This assessment is imperfect for now as no comprehensive environmental database exists for medium-sized companies, i.e. the majority of Coface’s debtors. But the assessment system does provide an initial measure of this impact.

Coface designed the new solution with KPMG to establish a structured and documented approach able to cover the entire portfolio. The assessment comprises two aspects:

  • a generic rating based on the debtor’s country;
  • a further standard rating focused on its sector of activity.

Coface then combines these two ratings to produce a “standard” overall environmental rating for a debtor. To refine the assessment, a debtor-specific aspect may be added where ad hoc information is available.

Coface thus separates financial analysis (including the impacts of environmental policy) from purely environmental assessment.

This environmental vision is transcribed in the GBA (Green Business Assessment), which overviews the debtor portfolio and outstanding guaranteed amounts. In 2022, the company monitored the trend in the average score of the portfolio which remains stable.

The methodology was enhanced in 2022 with the addition of new indicators, notably on biodiversity (proportion of loss of mangroves, average proportion of key land areas covered by protected areas, etc.) and waste management in the various countries.

6.2.3Environmental and social impact of investments

The Group is exposed to changes in environmental standards and the corresponding regulations that could impact its investment activities, financial performance and reputation.

Through its insurance activities, Coface is required to invest part of its premiums in diversified investment vehicles to cover potential future claims.

In addition to the financial risks that these investments entail, Coface may invest in environmental or socially non-responsible assets such as the shares or bonds of companies failing to comply with environmental and social criteria, as well as real estate and infrastructure projects that could harm biodiversity. These risks could lead to a significant temporary or long-term depreciation of assets and undermine the trust of Coface’s partners and clients, which in turn could generate a drop in revenue, the withdrawal of investors or a negative impact on the company’s image.

Global strategy and approach

Coface’s investment strategy is based on two areas:

  • a financial framework that respects a strategic asset allocation to achieve objectives of profitability, capital consumption and portfolio liquidity;
  • a socially responsible investment framework that aims to achieve a net zero trajectory by 2050.

To invest available funds in investments complying with its financial risk and socially responsible investment frameworks, Coface called upon Amundi, the European leader in asset management, to which it has delegated the management of its investment portfolio since 2016. Mindful of the potential social and/or environmental impact of its investments, Coface has asked Amundi to assist it in its ESG approach in this investment portfolio. Because it operates in an international environment with divergent SRI practices and standards, the Group wanted to rely on a single repository; it therefore relies on Amundi’s teams to implement and calculate SRI indicators for its portfolio.

Coface implements its non-financial approach based on four pillars, which will be detailed in the rest of the document:

  • Engagement strategy

Coface applies its engagement strategy through voting rights and dialogue with issuers.

  • Exclusion and restriction strategy

Coface applies an exclusion and restriction policy to restrict, reduce or exclude issuers and sectors whose activities may not comply with its risk framework. In addition to restrictive and sector-based exclusion policies, Coface relies on Amundi’s ESG ratings to limit the weight of issuers with poor ratings in this area.

  • Decarbonisation strategy

Coface is committed to shrinking the carbon footprint of its listed equity and corporate bond portfolio by 30% between 2020 and 2025 (scopes 1 and 2).

This scope corresponds to issuers able to quantify their issues, which distinguishes them from sovereign issuers or real estate funds, for example.

  • Transition financing strategy

Coface does not act as a direct investor in projects or financial transactions (but instead in dedicated funds or mandates). However it is working to integrate energy transition financing into its portfolio and increase the share of its “green” investments, in particular through green bonds (i.e. which participate in the energy transition and whose objective is to finance projects with environmental benefits, in accordance with the application of the Green Bonds Principles defined by the Icma). In accordance with regulatory requirements, Coface will from 2023 onwards publish information on the European Taxonomy eligibility of its financial assets and from 2024 onwards will endeavour to publish an alignment report.

a)Engagement strategy

Coface, through delegated managers voting at the Shareholders’ Meetings of companies held in the portfolio, contributes to and encourages dialogue with the management teams on best practices based on the initiatives implemented on these topics.

Amundi provides an annual report on Voting Rights, containing the following information:

  • overall voting statistics for each of Coface dedicated funds (with a focus on geographic breakdown, opposition rates and main opposition topics);
  • the list of meetings at which voting rights are exercised and during which an opposition voting right was exercised (broken down by company, country and opposition topic).

Prior to these votes and where necessary, Coface can initiate discussions with Amundi’s specialised teams to gather analyses on proposed resolutions and discuss the associated vote recommendations.

Amundi transmits its voting policy annually to the Group, to include the best corporate governance, social responsibility and environmental practices. Coface reviews this policy annually and ensures that it reflects its commitments.

Review of voting rights

The percentage of opposition votes exercised by Amundi on behalf of Coface at Shareholders’ Meetings held in 2022 are presented in the table below by topic.

/Opposition votes on share positions held directly (%)
COA2022_URD_EN_G041_HD.png
/History of opposition votes on share positions held directly (%)
COA2022_URD_EN_G042_HD.png
Commitment to the top 20 contributors to the carbon footprint

In 2022, Coface’s manager, Amundi, initiated a dialogue with 17 of the top 20 issuers in terms of carbon contribution on ESG aspects and 14 of these issuers on climate aspects.

b)Exclusion and restriction strategy

Coface’s strategy on investment restrictions and exclusions is based on two pillars and an indicator overseen by Coface’s Board of Directors.

Exclusion measures

Coface complies with the Ottawa and Oslo conventions and has excluded the following activities from its investments:

  • anti-personnel mines;
  • cluster bombs;
  • chemical weapons;
  • biological weapons;
  • depleted uranium weapons;
  • violation of one or more of the 10 principles of the United Nations Global Compact.
Restrictive measures

In terms of investment activity, Coface has stopped investing directly in:

  • companies that develop or plan to develop new mines, power plants or infrastructure relating to thermal coal;
  • companies extracting 100 MT of thermal coal or more, with no goal to reduce this extraction;
  • companies generating over 25% of their revenues from thermal coal extraction;
  • companies generating 25% to 50% of total revenue from thermal coal extraction and electricity generation from thermal coal and whose ESG rating calculated by Amundi has deteriorated significantly;
  • companies generating over 50% of revenue from thermal coal extraction and electricity generation from thermal coal;
  • companies manufacturing complete tobacco products (revenue > 5%).
An indicator monitoring the ESG quality of the portfolio

Since 2017, Amundi has produced a quarterly report on the average ESG rating of Coface portfolio (A to G rating) and a breakdown of assets by ESG rating. The score is based on 37 criteria, including 16 generic criteria and 26 specific sector criteria.

Of Coface’s overall investment portfolio, 79.4% is considered to be significant from an ESG perspective. Based on the significant part of the portfolio, nearly 94.4% of the portfolio has an ESG rating. This coverage ratio improved by 3 points compared with end-2021.

Since 2018, the exclusion measures described above have been added to Coface’s decision to refrain from investing directly in securities issued by a G-rated issuer, which is the worst rating on the Amundi scale. When an issuer’s rating deteriorates to G, the investment line is immediately sold at market value.

Lastly, Coface’s Board of Directors decided in 2021 to limit the weight of F-rated assets to less than 3% of its rated portfolio, which is part of its restriction strategy. At December 31, 2022, this indicator stood at 0.61%, a slight improvement from last year.

c)Decarbonisation strategy of the listed equity and corporate bond portfolio by 2025

Coface uses Amundi’s methodology to measure the carbon footprint of its portfolio in two scopes:

  • Scope 1: all direct emissions from sources owned or controlled by the Company;
  • Scope 2: all indirect emissions resulting from the purchase or production of electricity, steam or heat.

Coface has decided to increase its decarbonisation target from -20% to -30% of the carbon footprint of its listed equity and corporate bond portfolio between 2020 and 2025.

At this stage, investments in sovereign bonds, infrastructure and real estate assets are not affected by Coface’s decarbonisation objectives.

Coface measures its carbon footprint in absolute and relative value terms against a benchmark portfolio close to the portfolio’s strategic allocation (3).

/Carbon emissions per million euros invested (tCO2eq/€m)

In 2022, the carbon footprint of the listed equity and corporate bond portfolio (look-through view) in absolute value amounted to 53 tons of CO2 equivalent per million euros invested, down 39% compared with 2020.

COA2022_URD_EN_G007_HD.png

Compared with a benchmark portfolio close to the portfolio’s strategic allocation (the composition of which is described below), Coface’s CO2 emissions per million euros invested was nearly 45% lower in 2022.

/Carbon emissions per million euros invested (tCO2eq/€m)

Total tCO2/€m = 53

COA2022_URD_EN_G008_HD.png

Index: 85% ML EURO BROAD +10% MSCI EMU +5% THE BOFA ML GLOBAL HY.

Source: Amundi – This indicator measures emissions from the portfolio in metric tons of CO2 equivalent per million euros invested. It is an indicator of emissions resulting from investment in the portfolio.

* Top-tier suppliers only.

d)Transition financing strategy

As a credit insurer and short-/medium-term investor, Coface strives to integrate the financing of the transition into its investment portfolio, based on the weight of its green bonds.

The short duration of its portfolio, consistent with that of its liabilities, does not allow Coface to invest an overly large share of its assets in long-term investments that could favour the energy transition. Nevertheless, and as much as possible, Coface is working to increase the weight of assets favouring the transition in its portfolio.

At December 31, 2022, the weight of green bonds stood at 2.9% of Coface’s overall portfolio, i.e. €87 million in outstandings (market value).

e)Outlook

At end-2022, Coface’s Senior Management decided to join the Net-Zero Asset Owners Alliance (NZAOA) in 2023. Launched in 2019 by the United Nations, the Net-Zero Asset Owner Alliance is an international group of investors having committed to transitioning their investment portfolio to carbon neutrality by 2050. To achieve this target, CO2 emission trajectories must be reduced by around 50% between 2020 and 2030 and achieve net-zero emissions by 2050.

In addition to NZAOA membership, Coface is currently signing the United Nations Principles for Responsible Investment (UN PRI), the signatories of which agree to the following:

  • we will incorporate ESG issues into investment analysis and decision-making processes;
  • we will be active owners and incorporate ESG issues into our ownership policies and practices;
  • we will seek appropriate disclosure on ESG issues by the entities in which we invest;
  • we will promote acceptance and implementation of the Principles within the investment industry;
  • we will work together to enhance our effectiveness in implementing the Principles;
  • we will each report on our activities and progress towards implementing the Principles.

6.2.4Fair practices

As indicated in Chapter 5, the Coface Group, overseen by the French Prudential Supervisory and Resolution Authority (ACPR), must comply with the law and regulations applicable in the countries where the Group is established or operates.

Any violation of laws, regulations, rules and internal standards may potentially expose Coface to the risk of sanctions, fines, financial losses and reputational damage having a direct and significant impact on its business in the short, medium or long term.

Coface is also exposed to external fraud. This may take various forms, including cyberattacks and fraud committed by insured clients or their debtors, potentially generating a direct loss for the Group.

As a member of the United Nations Global Compact, Coface follows the principles stated therein relating to the protection of human rights:

  • to promote and respect the protection of international human rights law in its sphere of influence; and
  • to ensure that it is never complicit in human rights violations.
a)Subcontracting and suppliers

The outsourcing of important or critical functions and/or activities is strictly governed by the regulations applicable to insurance companies since the entry into force of the Solvency II Regulation. In this respect, since 2016, the Company has issued a Group policy aimed at identifying “material or critical” activities and defining the fundamental principles for resorting to outsourcing, the terms of any contract drafted for such outsourcing and the control procedures related to the outsourced activities and functions.

Approved by the Company’s Board of Directors in 2016, and reviewed annually since then, this policy, in accordance with applicable regulations, considers as important or critical operational activities

  • the following four key functions (see also Section 5.3.1 “Internal Control System”):
  • - the risk management function,
  • - the compliance function,
  • - the internal audit function, and
  • - the actuarial function; as well as,
  • other functions whose interruption is likely to have a significant impact on the Company’s activity or its ability to effectively manage risks, or whose interruption is likely to jeopardise the conditions of its authorisation.

In 2019, the Company amended its outsourcing policy, which now covers the outsourcing of “standard” functions in addition to that of important and/or critical functions and activities.

Standard contracts on the provision of services must specify a number of standard contractual clauses (such as purpose, duration, financial conditions, and the liability of the service provider). The conclusion of these contracts is subject to the implementation of Know Your Supplier due diligence and to compliance with the purchasing policy and other group rules.

Coface and all its subsidiaries have therefore pledged to select service providers who meet the high-quality service standards and have the qualifications and skills necessary to efficiently handle the outsourced service, while avoiding any conflict of interest and guaranteeing data confidentiality.

In accordance with the applicable regulations, for any project to sign a service contract regarding important or critical functions and/or activities, they are required to notify the French Prudential Supervision and Resolution Authority (ACPR) of any outsourcing project approved by the Company’s Board of Directors, no later than six weeks before the effective date of the contract, and of their intention to outsource services falling within the scope of the procedure, in accordance with the applicable regulations. Any outsourcing contract to be signed with a service provider must include certain mandatory clauses imposed by the Group policy of Coface.

To date, the main material or critical activities outsourced by the Group concern the Company’s financial investment management activity and, in a few limited countries, the risk underwriting activity.

In 2020, Coface mapped the Group’s outsourcing activities. The work covered the outsourcing of standard services and major or critical services carried out by all Coface Group regions to third parties or within the Group to another Coface entity.

The work served to:

  • review existing outsourcing at the Group;
  • distinguish between simple services and outsourcing services within the meaning of the Solvency II Regulation;
  • classify outsourcing according to their “standard” or “important or critical” category;
  • verify the compliance of contracts with applicable regulations and the Group outsourcing policy;
  • propose a remediation plan;
  • establish regular reporting on outsourcing.

The remediation plan was initiated in 2021 and finalised in 2022.

A quarterly report on both standard and important or critical outsourcing was introduced in 2021 for all Coface Group regions. The reporting provides a consolidated view of these services, which are also subject to level 2 control by the Risk and Compliance teams and level 3 control by the Internal Audit team.

For contracts relating to important or critical functions concluded after the entry into force of the Solvency II Regulation, the remediation was carried out from a contractual point of view by integrating the missing contractual clauses. No regulatory remediation (notification to the ACPR) was deemed necessary given the absence of substantial changes to these contracts.

Other contracts were subject to contractual remediation, in accordance with applicable local law and under the supervision of regional legal managers.

To supervise relations with suppliers, Coface has established a regularly reviewed internal purchasing procedure that sets out, among other aspects, the general conditions for the purchase of supplies and services and specifies the rules to be followed in terms of supplier selection. Since 2017, Coface has also been signatory to the Charte Relations Fournisseurs Responsables (responsible supplier relationship charter) led by two French agencies, the Médiateur des entreprises (business ombudsman) and the Conseil national des achats (purchasing association). This charter consists of 10 commitments for a responsible purchasing policy towards suppliers. It enables Coface to apply, in concrete terms, its willingness to foster fair and transparent relationships with its suppliers. In accordance with the French “Sapin II” law of December 10, 2016 on transparency, anti-corruption and the modernisation of economic life, Coface assesses suppliers on corruption risk, more details on which can be found in point b) ii of Section 6.2.4 “Fair practices”.

b)Compliance

The risk of non-compliance, to which Coface Group is exposed, is defined as the risk of legal, administrative or disciplinary sanctions, significant financial loss or reputational damage arising from non-compliance with provisions specific to Coface’s business activities, be they laws, regulations, rules or internal standards.

To mitigate this risk, the Group has developed a compliance system underpinned in particular by a compliance policy accessible to all employees. This policy specifies the involvement of the compliance function with respect to limiting the main non-compliance risks listed below:

  • professional ethics;
  • the fight against corruption;
  • combating money laundering and terrorist financing;
  • compliance with embargoes, asset freezes and other international financial sanctions;
  • fraud prevention;
  • protection of personal data.

The compliance policy also details the governance structure of the Coface Group, which ensures the independence of the compliance function. It lists the 35 key compliance performance indicators actively monitored by the compliance function and presented five times a year to the Management, the Risk Committee of the Board of Directors and the Coface Group Risk and Compliance Committee (CGRCC).

i. Professional ethics

The importance of compliance in general is crucial for the management team and is highlighted regularly with employees. More specifically, during each annual conference of the top 200 managers, the CEO always mentions the importance of integrity and professional ethics in his speech.

As part of managing non-compliance risks, Coface’s code of conduct, created for all Group employees to use, was revised in 2018 to promote and emphasise to all employees the requirement for integrity in properly conducting their business. This code notably emphasises the importance of treating clients fairly by avoiding conflicts of interest and not using information in an employee’s possession against the interests of a client, a potential client and co-contracting third parties.

In addition, in 2018, the Group appointed an ombudsman to whom any integrity issues, violations of the code of conduct or non-compliance with the law and regulations may be reported if necessary. To mitigate the risks of conflicts of interest, Coface in 2022 implemented training and a procedure to prevent conflicts of interest. The completion rate of the training course is 96.3%.

With regard to lobbying, Coface does not directly or habitually carry out any activity in this field and has no employee whose appointed duty or mission involves lobbying public or political entities. Nevertheless, any action undertaken in this respect should naturally be carried out in the context of the internal rules laid down by Coface in the aforesaid code of conduct, which includes a number of anti-corruption rules. In addition to the code of conduct, a lobbying code was introduced in 2021.

ii. The fight against corruption

The Coface Group has adopted a zero-tolerance policy for corruption in all its forms. This policy has been provided to all of the Group’s employees, particularly through the Anti-Corruption Code and the code of conduct, which are both prefaced by the CEO.

The Anti-Corruption Code consists of three parts: a reminder of general rules, specific rules and practical advice. The general rules define corruption, unfair advantages and the beneficiary concept, as well as the legal framework for corruption. The specific features of corruption involving public agents are also explained. The section on specific rules defines the rules on sensitive issues in terms of corruption: conflicts of interest, gifts and invitations, facilitation payments, political contributions, lobbying, charities and sponsorship.

Since 2017, Coface has focused on implementing the provisions set out in the Sapin II law on transparency, anti-corruption and modernisation of the economy. As a result, the Anti-Corruption Code is accompanied by the following (non-exhaustive list):

  • the introduction in 2021 for all Group employees of a new online training course on the fight against corruption incorporating the latest recommendations of the French Anti-Corruption Agency issued on December 4, 2020. Each course has been made available in the main languages to ensure better understanding by employees and is also accompanied by a quiz. The completion rate of the training course is 98%;
  • corruption risk mapping, subject to a global review by the compliance function in 2022 ahead of roll-out in 2023 by Coface Group entity and by function within each entity;
  • a global third-party evaluation system, updated in 2020 for intermediaries and in 2022 for suppliers. This system is based on operational procedures specifying the process for identifying and classifying the risks presented by suppliers and intermediaries. Consequently, suppliers and intermediaries assessed as presenting a high corruption risk are reviewed and approved by Compliance;
  • an internal whistleblowing system. Coface has put in place an internal whistleblowing system, as described in the Anti-Corruption Code and the code of conduct. The internal whistleblowing system was subject to a dedicated and detailed procedure that will be reviewed in 2023 following the final stage of the transposition into French law of the European directive on the protection of whistleblowers. In 2022, fourteen cases were reported in total, nine of which were reported as part of the internal whistleblowing system to the Human Resources and compliance functions, and five through the ombudsman. Internal Audit, the Human Resources Department and the ombudsman, as well as the compliance function, conducted investigations to process and close the various cases;
  • key anti-corruption performance indicators (KPI 10 to 17). These indicators include the process of knowledge of intermediaries, suppliers, allegations of corruption, gifts and invitations received or offered and reported to Compliance. In 2022, two potential allegations of corruption were reported to Compliance and were further investigated at the end of the reporting period;
  • accounting controls and second-level permanent controls were performed in 2022 to strengthen the entire system. In 2021, Internal Audit also carried out a periodic control of the Group compliance function, including the review of the anti-corruption system.
iii. Combating money laundering and terrorist financing (AML-CFT)

The compliance function regularly updates the framework procedures implemented to prevent and control money laundering and terrorist financing risks. These procedures are accessible to all employees on the Cofagroup intranet and implemented locally by the international network of regional and local compliance managers.

In 2022, the compliance function reviewed the Know Your Customer procedure. It has incorporated the latest version of the ACPR guidelines on KYC and determining the due diligence measures to be applied by type of client. In this context, Coface has modified and aligned with the existing classification of money laundering and terrorist financing risks. For each client/prospect, Coface determines a business relationship profile that provides an AML-CFT risk score in three categories (low/medium/high). The information collected as part of the KYC process is then updated and reviewed on a regular basis or following a trigger event. As a result, “high-risk” clients/prospects are subject to enhanced due diligence measures as well as an annual review.

Communication and awareness-raising initiatives were also carried out regularly with employees in 2022 to enable them to detect warning signs regarding money laundering and the financing of terrorism. A new online training course on AML-CFT was assigned in December 2022 to all Group employees, together with a module on client due diligence measures specifically for the sales, marketing and back-office teams. These courses are available in the main languages to ensure better understanding by employees and are also accompanied by a quiz.

iv. Compliance with embargoes, asset freezes and other international financial sanctions

The Group’s compliance system evolved significantly in 2021, notably through the launch of the real-time automatic filtering project for Coface clients and their related parties (debtors, intermediaries, beneficial owners, etc.) in respect of international sanctions lists (United Nations, Office of Foreign Assets Control, European Union, France) and local sanctions lists. Following the publication of new lists of international sanctions against Russia, the Group undertook several initiatives in 2022 to strengthen the effectiveness of the filtering system, including consistency checks by the Compliance Department.

The compliance function continuously detects sanctioned entities with which Coface cannot enter or continue a business relationship.

In line with these operational developments, in 2022 the compliance function updated the framework procedure for compliance with international sanctions and in 2021 adjusted the procedure for controls on dual-use goods and military goods. Performance indicators (KPI 28 to 35) relating to the filtering system have also been implemented.

v. Fraud prevention

The compliance function improved its fraud prevention system in 2022 through:

  • governance with the organisation of regional fraud committees led by the correspondents in charge of fraud prevention and regional compliance;
  • the development of its reporting tool and SAFE reporting tool for suspected fraud;
  • the tightening of due diligence on purchasers in the ATLAS database having been suspected of fraud or risk factors (alert in the tool and enhanced control system);
  • the updating of the Fraud Reporting Group Rules;
  • online and classroom training on the prevention of targeted fraud against sales teams, compensation, underwriting, finance/accounting, HR, Compliance, etc. The completion rate of the “Fraud in bank detail changes” online training course is 96.3%;
  • implementing key performance indicators (KPI 22 to 27) relating to the number and type of suspicions of fraud (insurance fraud, fraud against insured parties, fraud against debtors).
vi.Protection of personal data

As part of its implementation of the General Data Protection Regulation (GDPR), Coface has adapted its information systems and processes with a view to complying with the stricter requirements in terms of personal data protection, including the:

  • maintaining of data processing records by the Data Protection Officer;
  • inclusion of GDPR clauses in contracts with its clients and suppliers;
  • communication of the “Privacy Notice” to Coface clients.

Communication and online training initiatives on the protection of personal data within the Group were also implemented in 2021 and addressed to all employees. The purpose of the training course, accompanied by a quiz, was to enable each employee to comply with GDPR requirements and local data protection laws and regulations. The completion rate of the training course was 97%.

In March 2019, Coface submitted to the approval of the CNIL and the relevant personal data protection authorities binding corporate rules (BCRs) as set out in Article 47 of the GDPR. Pending approval by the CNIL and the competent authorities, Coface established an intra-group agreement in 2021 to comprehensively oversee the transfer of personal data outside the European Union.

c)Tax evasion

Coface is also required to comply with the tax laws applicable in the jurisdictions in which it operates, under penalty of sanctions, fines, financial losses and reputational damage.

The Group’s tax policy is defined by the Group Tax Department. It is applied at regional level through seven regional tax correspondents.

In addition to regular dialogue consistent with the issues to be addressed, meetings are organised quarterly by the Group Tax Department with each of the regional CFOs and tax correspondents for a general review of the tax topics in their region.

Ahead of each meeting, the tax correspondent sends the Group Tax Department a report on current tax audits and related provisions.

Coface also complies with the standards established by the OECD to combat the erosion of tax bases and the transfer of profits through the implementation of a centralised transfer pricing policy, a governance system serving to identity aggressive tax arrangements with a view to reporting them in respect of DAC 6 in the European Union (no aggressive arrangement to report in 2021), and the filing of a declaration per country (Country-By-Country Reporting, CBCR).

Lastly, Coface’s KYC (Know Your Client) procedure includes strengthened vigilance measures when transactions involve one or more entities located in non-cooperative States and territories for tax purposes, as defined by Article 238-0 A of the French Tax Code, or in a country that could create a reputation risk for Coface (even if this country is not specifically included in the list of non-cooperative States and territories under the jurisdiction of Coface entity that issued the policy).

(1)
Coverage rate: for each insured client, the ratio of guarantee amounts granted to requested guarantee amounts.
(2)
https://en.wikipedia.org/wiki/Democracy_Index
(3)
The benchmark portfolio is composed as follows: 85% ML EURO BROAD +10% MSCI EMU +5% THE BOFA ML GLOBAL HY.

6.3Coface, a responsible employer

A RESPONSIBLE EMPLOYER


Main pillar themes:


COA2022_URD_EN_ODD-2_HD.png

Key figures


A new worldwide HRIS: added value for Human Resources and employees


Diversity, inclusion, equal opportunities (multiculturality, disability, gender equality, sexual orientation) and societal commitment


R.8

Attracting, developing and retaining talent; engaging employees (induction and training of employees, international occupational mobility, employee engagement, compensation policy, etc.)


R.9

Coface’s Human Resources teams, which were strengthened during the last two strategic plans, worked intensively in 2022 on the following social initiatives and trends:

  • talent management and the need to boost Coface’s attractiveness and the retention of its high potentials. Competition on attracting talent has increased sharply since the health crisis. Attrition rates of key resources are on the rise, and candidates are more difficult to identify and attract. Coface can highlight a host of advantages in order to be perceived as an employer of choice with a culture, managerial practices and collaboration methods corresponding to the expectations of the talents its teams require;
  • Coface’s efforts on diversity and inclusion, and in particular its stated ambition on gender equality, are part of this drive;
  • the Group’s extensive work on corporate engagement and culture has produced results, with a level of engagement that has improved considerably, to today achieve robust benchmarks in financial services in several regions;
  • considerable flexibility in working methods, with modernised offices and highly flexible remote-working arrangements, further enhances the attractiveness of Coface; and
  • the development of international occupational mobility and cross-functional collaboration with multicultural teams also responds to one of the major expectations of the talents that Coface is looking for.

Particular attention was also paid in 2022 to wage issues in response to high inflation in most of the markets where Coface employs staff and is seeking new talents.

In addition to these fundamental social trends, the Human Resources teams contributed proactively to Coface’s ambitions on the sale of information. The HR teams recruited nearly 160 people around the world, doubling the workforce in one year, in a context of scarce resources on the market.

Lastly, the Group’s human resources were mobilised to improve their resource management tool with the introduction of a global system, “My HR Place”, which they can use to manage employee data more reliably, and the digitalisation of internal work processes.

6.3.1Key figures

A workforce structure reflecting strategic guidelines

Coface’s workforce structure continues to evolve, with trends reflecting the strategic orientations of the Build to Lead strategic plan. In particular, the headcount of the information sales business has increased considerably, with some 300 people dedicated to this business line at the end of the 2022 financial year. The Group has also recruited widely for its dedicated sales forces. Nearly 160 new people have joined Coface with responsibility for the sale of information. These recruitments naturally cover the replacement of people having left Coface, but the net increase remains significant.

A few figures showing the reality of our business

The following data comes from the Group’s “My HR Place” tool, introduced in 2022 and available online for the various contributors to the database. The database is updated in real time and receives a steady flow of data from the HR teams in the countries. The information is consolidated on the last business day of the month, enabling the production of monthly scorecards.

This reporting includes the individual contract, activity, business and length-of-service data for each Group country, as well as information on the hierarchical links between the various positions.

An extraction of the tool also serves as a strategic tool for staff, as it makes it possible to manage recruitment actions and internal transfers within the context of a budget.

Strong international dimension

This report contains figures covering the entire Group to give a global view of the company. The indicators are then presented by region, reflecting the organisational model of the business. This scope can be compared with the same scope for 2020 and 2021.

/Breakdown of workforce by region

At December 31, 2022, the Group as a whole employed 4,721 employees in 58 countries (a new site having been opened in New Zealand in 2022), compared with 4,538 at December 31, 2021. The following table shows the geographical breakdown of the Group’s workforce since December 31, 2020:

Workforce

2022

2021

2020

Northern Europe

699

676

712

Western Europe

1,013

979

1,060

Central Europe

995

947

801

Mediterranean & Africa

867

844

828

North America

224

202

200

Latin America

452

443

420

Asia-Pacific

471

447

427

Total

4,721

4,538

4,448

COA2022_URD_EN_G011_HD.png

Coface workforce increased by 4.03% in 2022. This change can be attributed to an increase in the number of information sales staff and the growth of the central teams, particularly as part of the ramp-up of shared service centres.

The sale of information is at the root of the increase in the workforce in North America, Northern Europe and Central Europe. In Central Europe, the number of shared services staff also contributes to the increase in the region’s total.

/Breakdown of workforce by activity

The table below breaks down the Group’s workforce by type of activity since December 31, 2020:

Workforce

2022

2021

2020

Change 2022 vs. 2021

Sales & Marketing

1,700

1,629

1,546

4.36%

Support

1,583

1,596

1,562

(0.81%)

Information, litigation, debt collection

985

975

1,007

1.03%

Risk underwriting

453

338

333

34.02%

Total

4,721

4,538

4,448

4.03%

In 2022, 1,700 employees were assigned to sales and marketing, 1,583 to support functions, 985 to information, litigation and debt collection, and 453 to risk underwriting.

The changes partly reflect a more detailed classification of the workforce, following the implementation of the new HR information system this year. For example, bonding, Single Risk and specialities were reclassified from “support” to “sales and marketing” (+122) and commercial underwriting from “support” to “underwriting”.

Types of employment contract

The following indicators are presented this year for the total Group scope and no longer for a selection of countries as in previous years.

Permanent contracts continued to account for the large majority of jobs at Coface:


2022

2021

2020

Change 2022 vs. 2021

Northern Europe

97.7%

98.1%

97.9%

(0.4%)

Western Europe

98.2%

98.2%

98.6%

0.1%

Central Europe

95.7%

93.5%

93.5%

2.4%

Mediterranean & Africa

99.5%

98.6%

99.0%

1.0%

North America

100.0%

100.0%

100.0%

0.0%

Latin America

94.7%

96.2%

97.4%

(1.5%)

Asia-Pacific

98.3%

97.3%

98.4%

1.0%

For the Group as a whole, 97.6% of Coface employees work on permanent contracts.

Age ranges by country

Here too, the choice was made this year to present the age brackets for all regions and the Group. The breakdown by age for 2021 is provided for comparison purposes.

The high volume of recruitment from one year to the next significantly increases the proportion of employees by age group.

In 2021


Age ranges

Asia-Pacific

Central Europe

Latin
 America

Mediterranean
 & Africa

North America

Northern Europe

Western Europe

Overall
 total

< 30

18.34%

14.47%

21.22%

11.85%

9.90%

4.73%

10.42%

12.49%

30 to 40

41.39%

44.67%

39.05%

29.15%

18.32%

17.90%

29.93%

32.57%

40 to 50

25.95%

29.67%

30.02%

40.17%

30.69%

33.58%

29.83%

31.95%

> 50

14.32%

11.19%

9.71%

18.84%

41.09%

43.79%

29.83%

22.98%

Total

100.0%

100.0%

100.0%

100.0%

100.0%

100.0%

100.0%

100.0%

In 2022


Age ranges

Asia-Pacific

Central Europe

Latin
 America

Mediterranean
 & Africa

North America

Northern Europe

Western Europe

Overall total

< 30

22.72%

18.49%

26.11%

13.03%

14.29%

7.58%

12.8%

15.61%

30 to 40

40.13%

42.71%

36.95%

30.45%

19.64%

19.17%

30.3%

32.41%

40 to 50

24.63%

28.04%

25.88%

35.64%

24.11%

30.19%

27.0%

28.81%

> 50

12.53%

10.75%

11.06%

20.88%

41.96%

43.06%

29.8%

23.17%

Total

100.0%

100.0%

100.0%

100.0%

100.0%

100.0%

100.0%

100.0%

Several countries, with an average age of more than 45 years, are very long-standing locations for Coface (Germany, USA), where the resignation rate remains historically low. This age structure is no longer the case in France, where the teams have been substantially renewed in the last five years, particular for Group functions.

6.3.2A new worldwide HRIS: added value for Human Resources and employees

In 2022, Coface rolled out a project to implement an HR information system that covers all of its employees and external service providers.

The new system is a foundational database of administrative HR data (personal data, employment data) that can be used to:

  • establish a complete view of Coface’s workforce, updated on an ongoing basis;
  • further secure sensitive data;
  • better manage processes related to staff movements, such as access to Coface’s information systems;
  • give managers an overview of the key characteristics of the workforce.

The new system will enable Coface to develop other activities on this basis, in particular the HR cost budget process and the management of compensation campaigns.

6.3.3Diversity, inclusion and equal opportunities

Coface’s diversity and inclusion initiatives continued to grow in 2022. Coface is fully committed to creating a work atmosphere that respects the individualities and diversity of its teams. The Group is also duty bound to boost its attractiveness for external candidates and work to retain its employees potentially considering Coface work experience as less inclusive than at other companies.

Given the nature of its business, which operates across a global scope, Coface must remain a multicultural company, where the proportion of French people is largely a minority. To that end, employees must be provided with a work environment in which managerial practices and communication methods are inclusive and non-discriminatory and their creativity and the expression of their diversity are respected. This allows for collaborative and fruitful work between teams representing 80 nationalities and working in 58 countries.

Furthermore, with new regulations on gender diversity fast approaching, Coface is preparing for changes to requirements on the gender balance among managerial positions. To do so, it has initiated numerous actions plans together with indicators for monitoring progress.

Accordingly, diversity and inclusion are a key component of the Group Human Resources strategy, the aim being to provide a vision, objectives, strategic initiatives, and means of action, progress indicators and a clear communication framework for its employees and outside the company. This Group Human Resources strategy is shared each year with the entire Human Resources community around the world.

This strategy has taken the form of an internal policy on Diversity and Inclusion, formally drafted and presented to the Board of Directors in April 2022. The main areas of this policy are presented below.

a)Objective of the Diversity & Inclusion strategy

Coface’s aim is to be recognised on the market for its diversified and inclusive culture.

Coface work environment must be seen as inclusive and the company as a place where employees can thrive and contribute their authenticity to their professional activities. Coface is committed to combating all forms of discrimination in the workplace, whether in the selection of candidates or in human resources practices throughout the careers of its employees.

To that end, Coface has introduced training and awareness-raising initiatives to encourage the transformation of the corporate culture towards greater openness to diversity in all its forms and towards inclusive and non-discriminatory managerial practices.

Regarding gender equality, Coface aims to achieve wage equality in the short term and gradually improve the share of women in Senior Management (1), including executive functions, to 40% before the 2030 deadline.

To achieve this objective, Coface has set three priorities:

  • leverage external recruitment opportunities for Senior Manager positions to strengthen the pool of female talent;
  • direct career management and succession plans in a determined manner towards the promotion of women in order to move rapidly towards gender equality at all levels of management;
  • ensure strict respect for equal pay, through the oversight of specific indicators such as the gender index, an indicator made up of five metrics on equal pay and promotion, as well as the proportion of women in the Senior Management and in Senior Management succession plans. Coface also measures equal opportunities in performance assessment processes (comparison of the percentage of men and women by performance level) and the proportion of women in people assessed as high potential.
b)Organisation system implemented to ensure progress on initiatives

A Group Diversity and Inclusion Committee has been in place since 2021. The new committee meets monthly to make headway on the various projects in place. It is composed of the Group CSR Manager, Human Resources, Communications and certain key contributors.

A network of seven Regional Diversity and Inclusion Champions, and a global champion, has also been rolled out to coordinate regional initiatives, share best practices and ensure coordination with the Group. These champions have met monthly since April 2022 to discuss their respective initiatives and nourish shared thinking. They are coordinated by the Group Human Resources Department.

I.Training and awareness of all forms of diversity

As in 2021, a Diversity and Inclusion Week was organised in 2022 for all employees around the world to raise awareness of the issue. Bringing together internal and external speakers, it took place from May 16 to 20, with conferences on gender equality, gender and sexual orientation, multiculturalism, disability and inter-generational collaboration. For the first time this year, four workshops were also organised on unconscious perception biases and inclusive behaviour, led by an expert company in the field. The objective is to make people aware that Coface fosters a work environment where everyone can thrive whatever their profile, where diversity is seen as a source of richness and key to achieving strategic objectives, and where everyone has a role to play in this area.

The campaign proved highly successful, with 2,500 connections over the week and over 1,000 participants attending awareness workshops. A subsequent survey showed that 82% of respondents found these workshops useful for understanding the influence of perception biases on their behaviour at work, while 77% said that they felt better equipped to help develop an inclusive culture at Coface.

Training plan

A training plan has been developed to firmly root this culture at the company and make further progress on the behaviour and actions that everyone can implement. The plan consists of an e-learning module targeting all employees on inclusive behaviour, along with training workshops for managers at all levels, starting with the Group’s Executive Committee. A service provider has been selected and the training courses are being developed for roll-out in 2023.

A specific module for HR was introduced in mid-December based on inclusive language. The aim is to raise awareness of the consideration of the diversity of employee profiles and situations in HR policies and day-to-day actions, the importance of words used and their impact. The overarching objective is to empower the Human Resources teams in their contribution to the fight against discrimination at the company, particularly as regards gender and sexual orientation. All HR staff are requested to complete this training and update their local policies by taking into account the principles promoted in the course.

Multiculturality

Coface is a multicultural company with employees representing 80 nationalities, some of them working outside their country of origin.

Improving the Group’s knowledge of cultures in other countries and understanding language codes, working methods and the management culture in other parts of the world is essential to Coface’s business and the collaborative efforts of its teams. Awareness-raising efforts continued in 2022 in the form of a webinar organised for Diversity and Inclusion Week in the second quarter.

Sexual orientation

Following the signing of the “Autre Cercle” charter at the end of 2020, Coface implemented several initiatives aimed at promoting an inclusive and non-discriminatory environment for LGBT+ people:

  • organisation of an awareness-raising conference for Diversity and Inclusion Week in May 2021 and then in May 2022;
  • Coface continued to promote the creation of internal networks of people interested in this theme, referred to as “employee resource groups”. An initial LGBT+ network was created in Latin America at the end of 2021, following a conference organised for all employees in the region. This network pursued its remit in 2022.
People with disabilities

In 2022, Coface continued its action plan to raise manager and employee awareness of the inclusion of people with disabilities in the professional world. The following actions were implemented over the course of the year:

  • in 2022, Coface organised two weeks dedicated to disability:
    • the first week was focused on parasports, featuring a conference on the subject. A newsletter was published on the subject and employee awareness was raised through a parabasketball session, attended by some 30 participants,
    • the second week turned the spotlight on the theme of “Culture and Disability”, taking the form of a conference followed by a newsletter.

In addition to raising awareness, the Group has formed partnerships with the French Parasports Federation and AFP France Handicap, an organisation that works to defend and represent people with disabilities. Coface and AFP France Handicap organised the “Duo Days” event, inviting two people with disabilities to discover Coface’s business lines. Around ten employees contributed to the initiative by informing the visitors about their professions.

Initiatives with external partnerships

Since end-2020, the Coface Group has also initiated an external equal opportunities policy through a partnership with the Potter endowment fund, which supports financially disadvantaged students so that they can study in scientific preparatory classes and then at engineering schools, thanks to scholarships awarded throughout their courses.

Coface and the Potter endowment fund have decided to work together to support this cause through a sponsorship agreement. Under the agreement, Coface’s head office in France provides the time and skills of two of its motivated employees seeking to work on assignments with a social impact. The two employees devote one day a week to the initiative. Their goal is to help the fund develop its reputation, promote its mission, manage applications and contribute to the organisation of selection panels.

In addition, a Coface employee, the Head of the Group Information offering, is part of the panel that selects candidates, and since 2022, Coface has financed a scholarship awarded to a student and provisioned for their five years of study.

Reverse mentoring

The Reverse Mentoring programme seeks to develop understanding among employees of different cultures, backgrounds and generations, the aim being to overcome the conscious or unconscious barriers and biases existing between these individuals in order to improve collaboration.

The programme was launched this year with a view to developing inclusion. Twenty-six employees took part, focusing on the themes of age, gender, sexual orientation and country of origin. Feedback is expected in 2023.

In addition to global initiatives, Coface also implements regional initiatives to address specific needs in terms of employee training and awareness. These initiatives include the organisation of sessions on creating greater empathy at work (Asia-Pacific); awareness-raising of disabilities and notably autism in the workplace (Latin America); the creation of “listening sessions” followed by debates on actions to be implemented (North America); and the publication of articles to raise awareness of the forms of multicultural and intergenerational diversity in our internal newsletters (Northern Europe and Mediterranean & Africa).

ii.Gender equality

The proportion of women and men is well balanced overall at Group level, with a little over 54% women in 2022. However, women accounted for just 41% of managerial positions and 33% of Executive Committee members. Women account for 34% of the top 200, in line with the target set for 2022 and at the same level as in 2021.

The table below shows the trend in the proportion of women overall and among managers in all regions since 2020:


2022

2021

2020

Northern Europe

% women

50.5%

50.4%

52.3%


% of managers

15.5%

17.6%

17.6%


% women among managers

23.1%

18.5%

22.4%

Western Europe

% women

49.4%

48.3%

47.8%


% of managers

22.9%

24.3%

24.5%


% women among managers

37.1%

38.7%

35.7%

Central Europe

% women

61.5%

60.9%

61.3%


% of managers

19.0%

19.6%

21.3%


% women among managers

49.2%

47.8%

47.4%

Mediterranean & Africa

% women

56.7%

57.9%

57.1%


% of managers

26.3%

22.4%

23.1%


% women among managers

38.6%

39.2%

38.7%

North America

% women

41.5%

46.0%

46.0%


% of managers

27.7%

31.2%

28.0%


% women among managers

38.7%

39.7%

42.9%

Latin America

% women

56.6%

58.9%

56.2%


% of managers

25.7%

26.0%

27.4%


% women among managers

61.2%

60.0%

60.0%

Asia-Pacific

% women

53.7%

53.9%

51.8%


% of managers

26.3%

25.1%

28.1%


% women among managers

38.7%

39.3%

32.5%

A recruitment policy fostering gender equality

When recruiting for Senior Manager positions from outside the Group (2), the focus is systematically on identifying female candidates in the final selection. The external recruitment of female profiles nevertheless remains a challenge. In 2022, women accounted for just 38% of recruitments at this level (6 out of 16), compared with 71% in 2021 (10 out of 14).

Internally, and among Senior Managers, the proportion of women in internal promotions increased slightly, from 32% in 2021 to 39% in 2022, i.e. 11 of the 28 internal promotions (or increased responsibilities). 45% took a Senior Management position for the first time, but this proportion remains insufficient.

The situation underscores the need to continue focusing on the recruitment of women leaders and, in the short term, to strengthen the pool of female talent in middle manager positions.

Career management and mobility focused on women’s careers

In terms of career management, Coface has actively committed to female careers. It has implemented several actions and processes and publishes several indicators widely to communicate on progress in house.

The Global Gender Index is used to coordinate and measure women’s career management

Coface index, also known as the Global Gender Index, has been included as a criterion in the variable compensation of all the Group’s Senior Managers. It consists of two KPIs: the gender index group and the criteria on the proportion of women in Senior Management positions, as detailed below.

Firstly, similar to the gender equality index, Coface in 2020 decided to calculate an enhanced and extended index for all Group entities.

This Global Gender Index, the calculation of which was overhauled in mid-2022, measures:

  • equal pay for men and women -40 points;
  • equal pay increase decisions -20 points;
  • equal promotion decisions -15 points;
  • the percentage of women among Senior Managers (top 200) -15 points;
  • the percentage of women among the 10 highest-paid employees -10 points.

The Group index, then, is calculated on the basis of four criteria from the French index plus an additional measure on equal career development (criterion 4). The index results from the consolidation of each regional index (for details of the scope and calculation, see Section 6.6 “Guidelines and methodology”). Progress thresholds are determined annually for each region. This central oversight ensures that professional equality objectives are met internationally. Ultimately, the goal is to close the pay gap between men and women, facilitate and support women’s careers and promote diversity within the teams.

For the first criterion, 20 countries are taken into account in the analysis (countries with more than 50 employees). They account for 80% of the Group’s workforce. The rest of the criteria take into account the entire Group. This difference in calculation can be attributed to the relevance of the samples from a statistical viewpoint.

Secondly, the criterion for the representation of women in Senior Management was also included in the Global Gender Index, with a quantified annual growth target, in the deferred variable compensation of Senior Managers eligible for this variable plan. At end-2022, 34% of the women at Coface had reached this level, stable on 2021.

To meet its objective to have women account for 40% of Senior managers by 2030, Coface must ensure that it has sufficient women in succession plans for these positions. The increase in the presence of women in these succession plans is measured every year, at two levels:

  • After promoting internal female talents to Executive Committee level (CEO LAR and WER, CFO), the pool of female successors has naturally declined for the short term. The pool needs to be enriched once again to ensure that internal options exist when positions become available:


July 2022

July 2021

% of single female successors (short term)

29%

36%

% of single female successors (long term)

38%

40%

  • Regional Management Committee level. A pool to provide over the very long term (> 5 years) potential future members of the Executive Committee. The proportion of women continues to grow significantly, reaching 46% in July 2022 compared with 40% a year earlier (and 29% in July 2020).

Lastly, to these measurement tools, which have enabled us to focus on managerial promotion and recruitment decisions, Coface has added qualitative processes to make greater overall progress on the career development of all high-potential women:

  • an international mentoring programme, including at least 60% women, explained below;
  • a women’s career committee process called the Talented Women Career Acceleration Programme, launched in 2020. This makes it possible to review the career progression of high-potential women several times a year and region by region. During this review, Coface decides, if necessary, to provide more resources to some individuals to foster progress, including mentoring and training. Coface can also decide to anticipate a promotion for others or to open up the field of opportunities by imagining more creative paths. These sessions have effectively served to accelerate the careers of many women at Coface. Looking at the high potentials identified in July 2021 and their occupational status in July 2022, 65% of women have taken up a new position in the last two years, compared with just 45% of men.
Equal pay for men and women

For the new year, Coface decided to renew the calculation of its gender equality index rolled out throughout the Group. With the introduction of this index, head office is able to ensure that professional equality objectives are met around the world. Since the index was implemented in 2020, rapid progress has been made in terms of equal opportunities. This index has thus proven its effectiveness.

For the third year of calculation, Coface further improved its score in 2022, to 88/100. This was 4 points higher than in 2021, following a 3-point increase between 2020 and 2021.

In detail and by region, criterion number 1, aimed at controlling equal pay for men and women, decreased slightly in some regions. This was mainly due to new hires and regional reorganisations, as well as regional focuses on other forms of discrimination. Coface’s score thus trended from 34/40 in 2021 to 33/40 in 2022, underscoring the need to continue its efforts in this area.

Decisions to increase compensation are now equal, with all but one region having obtained a maximum score on this criterion. Decisions to increase compensation are verified by the Group, which ensures that the increases, before they are applied, concern women as much (or more) than men and that the average increase in women is equal to or greater than that of men. The same is true of promotion decisions, which once again this year were egalitarian, with all regions having obtained a maximum score on this criterion.

Performance on the criterion on the share of women in the highest-paid positions increased or remained stable in six regions out of seven. The Group index has thus made progress on this criterion.

Coface plans to change the way it calculates the Global Gender Index in 2023 to incorporate and additional focus on including more women in succession plans. While the calculation method remains the same, the weight of each indicator will be reviewed in order to guide actions in areas with the greatest room for improvement, namely supporting career management and female mobility.

In addition to the criteria used in the Global Gender Index, Coface also checks that the bonus achievement percentages of men and women are assessed in a non-biased manner. To that end, Human Resources establishes bonus averages by category and gender to ensure that men are not favoured over women, consciously or otherwise.

Measuring the impact of all D&I actions internally

Coface has since 2017 been able to accurately measure progress on this initiative through its “My Voice” then “My Voice Pulse” survey. The Group can monitor the overall score in terms of “The perception of working in a company where diversity is valued, where HR culture and practices are inclusive, and where discrimination is not present.” Below are the responses to the November 2022 survey, the scores of which increased in the past year, and more than the benchmark of comparable financial companies. The only exception is the non-discrimination score, which is good and improved but fell slightly below the benchmark, at 8.5 vs. 8.6.

Overall participation 
in the survey

Overall “Diversity and Inclusion” score

Diversity

Inclusion

Non-discrimination

81%

8.4

8.4

8.4

8.5

6.3.4Attracting, developing and retaining talent; engaging employees

As part of its overall HR strategy, Coface has established a policy on attracting, developing and retaining talent and, more broadly, engaging employees. The policy is reflected in the three pillars of this strategy:

  • contribute to the company’s cultural transformation;
  • partner the business and help to meet Build to Lead objectives;
  • rank as an employer of choice.

In concrete terms, the policy comprises a number of initiatives and programmes, the most representative of which are detailed below. They consist in:

  • recruiting the right profiles, particularly in key positions, by boosting the awareness and attractiveness of the Group and notably by ensuring the representation of women (Senior Management recruitments approved by the Group);
  • filling key positions internally with the best profiles, ensuring that women are well represented (internal promotions to Senior Management positions also approved by the Group);
  • identifying the best talent (3) to be developed as well as potential successors to key positions (annual Talent Reviews identifying high-potential individuals and their development plans, eligible for international transfers in the short term, succession plans, in particular for Senior Management);
  • making international mobility opportunities available to the best talent (posting open positions on the Group intranet, regular occupational mobility committees with regional HR managers, Group approval of inter-regional transfers) as well as remote assignments: Coface is open to offering employees the opportunity to work from their country of origin for an entity established in another country. This meets the company’s need to expand the pool of potential talent to fill positions internally and the need of employees to benefit from more options to grow professionally, in line with changes in practices on the labour market. However, this is being implemented on a small scale and under strong control of Group HR. The latter has determined specific rules and processes for approving these projects, taking into account operational criteria related to the position and the person, but also subject to compliance with labour law, tax and immigration rules, and consideration of the impact in terms of the costs and workload required to manage these situations;
  • organising systematic career interviews with the best talent and encouraging managers to conduct these discussions (career interview training programme initiated in 2021);
  • strengthening the development offering for the best talent (a talent programme for the Risk Underwriting function, the MAR region; Group Mentoring to Lead programme, the global deployment of which continued for the second consecutive year aimed at stepping up the development of future leaders in terms of soft skills, 360° feedback tool introduced across the entire Group in 2022);
  • developing internal mobility on a larger scale (formalisation and communication of a Group internal transfer policy under the “Move & Grow” label): changes in business lines and countries are notably encouraged, the aim being to develop the broadest possible understanding of the company among employees, enhance skills, strengthen the Group culture and develop individual and collective agility;
  • expanding the Group’s training offer, particularly in terms of business line expertise and by capitalising on digital tools (Underwriting Academy launched in 2021 on CLIC, the Group’s digital training platform, continued roll-out of the Commercial Academy for the second year, implementation of a training programme for the Information Sales teams, introduction of an HR Academy in 2022);
  • ensuring the proper integration of new hires around the world (IntoCoface programme, which continues to be rolled out and whose content was enriched in 2022);
  • developing a compensation policy adapted to the Group’s strategic challenges over the long term, respecting internal fairness and competition on the market;
  • measuring and analysing employee engagement and establishing improvement plans (“My Voice Pulse” survey administered three times a year and initiated in October 2021).

Further information is provided below to illustrate the most representative initiatives in 2022:

Employer brand

Coface has clarified the main advantages of its employer brand in order to enable all the entities to communicate in a more impactful and consistent manner around the world. The objective is to improve recruitment by developing the company’s reputation on the job market and boosting its appeal to professionals unfamiliar with the credit insurance world but likely to bring new skills to the profession and to find an environment in which to flourish. Internally, it also helps to rally the teams around shared sources of pride.

The advantages of the employer brand were identified by an in-depth analysis conducted in the last few years. This analysis involved some 100 players on the ground (employees and managers from various regions, business lines, seniority), whose proposals were approved first by the HR and Communication networks and then by the Group Executive Committee.

These strengths are structured into four main areas:

  • Coface’s contribution to the development of companies around the world, in a sustainable manner;
  • the strong connection with global trends, whether economic, geopolitical or societal;
  • the human dimension of the company, through its size and values; and
  • Coface’s ability to reinvent and modernise, leaving room for the ideas and contributions of all employees.

This work resulted in the provision of recruitment and communication tools – to which Coface employees proactively contributed – to all entities in March 2022. These tools are enhanced with visuals, i.e. a series of photographs taken at Coface’s premises on three continents feed these tools with visuals. Video testimonials by Coface employees were also produced for the social networks. These films showcase innovation capacities, international career paths, collaboration within the teams, and the focus on clients. The Careers page on Coface website has also been updated. It now places particular emphasis on in-house testimonies from employees at all levels, from the most junior staff to the Executive Committee. In total, over 80 employees appeared in these videos.

The overarching aim is to portray the truth of Coface, i.e. a company with a human face whose teams work in close proximity and with a strong spirit of mutual assistance.

Group onboarding programme

The IntoCoface programme has been successfully developed and implemented since 2020 and was enhanced in 2022 by:

  • registration for the standard course of the “fundamental” modules of the Underwriting Academy (see below);
  • regional onboarding webinars bringing together the company’s leaders and other spokespersons on flagship initiatives and new hires. Their content was designed to overview Coface’s business, strategy and culture through a client case and concrete examples. These webinars also aim to develop a sense of belonging to a global organisation by creating direct contact with counterparts in other countries and functions and by making the company’s leaders accessible;
  • short videos that can be viewed autonomously on the Onboarding page of the company’s e-learning platform (CLIC). These concise videos sum up Coface’s 360° vision systematically from the standpoint of business, products and culture. They also make effective use of testimonials, which forge greater closeness, and educational events.
Underwriting Academy

Launched in early 2021, the Underwriting Academy aims to develop the technical skills of professionals in underwriting and related functions and comprehensively inform all company employees about this core Coface activity.

It includes a total of 120 training modules, with learning paths built by employee type, depending on their need, including a beginner course comprising 10 broadly accessible introductory modules.

In 2022, the basic journey covering underwriting fundamentals and addressing the broadest audience possible was translated to make it more accessible. It is now offered in 10 languages, enabling all employees to understand how underwriting contributes to Coface value chain and enhance their collaboration with these business lines.

After the peaks linked to the launch in 2021, the content of the Underwriting Academy continues to be widely used in the organisation. In 2022, page visits totalled 21,000 (for a total of more than 63,000 since launch) and course registrations 11,000. In all, 1,940 employees have signed up for the Academy since its launch.

For new hires, the increased visibility of the Underwriting Academy in their integration journey is reflected in the attendance of learners. In 2022, 154 new hires consulted the “fundamentals” targeting them and 36% of them followed the course in its entirety (ten modules) compared with 110 in 2021, with a full completion rate of 7%.

Commercial Academy

The roll-out of the soft-skills training programme, developed in partnership with Krauthammer, initiated in September 2019 and aimed at developing the skills of sales teams around the world, moved ahead as planned in 2022. A total of 311 participants were trained, bringing the number of beneficiaries of the programme since inception to 774, in 6 regions and 34 countries, representing both the credit insurance teams and the information sales teams.

The Commercial Academy continues to meet the expectations of the sales teams, with satisfaction maintained at 4.2/5 on average.

The programme has been adapted since 2021 to be delivered either in person or remotely and includes specific remote sales and leadership modules. It now consists of ten different career paths, including that of the “Fundamentals”, which stands as the necessary entry point to ensure that all the teams are properly aligned. The training offer was supplemented in 2022 with two new modules: “Management of Key Client Accounts” and “Advanced Negotiation”. A learner certification process has been established and is gradually being implemented for participants in the “Fundamentals”. To be certified, the beneficiaries must attend the course assiduously and score 80% on a quiz sent to them after the course via the CLIC e-learning platform to test their skills. It is planned to extend this certification process to all courses in 2023.

After three years of implementation, the processes will be streamlined in 2023 to make them more legible and efficient, while the range of skills developed will be expanded. Two new modules will be created: “Sell via brokers” and “Sell via partners”.

In addition to the soft-skills programme, the product and process knowledge development training offer was overhauled in 2022 to update content and identify pathways to meet the 15-hour annual individual training requirements of the Insurance Distribution Directive (IDA). The latter has been integrated into the Commercial Academy and the entire catalogue is accessible via a single portal on CLIC.

Modules on the new Coface Premium Services offer to Account Managers responsible for selling them were rolled out in 2022 in the form of webinars in three pilot countries, Germany, France and Italy. Workshops were also held with the back office teams to help them take ownership of the implementation procedures. These training courses will be translated into e-learning modules and made available on CLIC in 2023 to the other countries that will roll out this offer. A basic module on the main principles of Coface Premium Services will also be introduced for all the sales teams to provide them with an overview of the offer.

HR Academy

To align the 140 professionals of the HR community on key initiatives and processes for the function, and to help each member develop the skills necessary to their current position or future career development, a digital training programme has been initiated. The vision, major themes and specific topics of the programme were developed by a project team and approved by a steering committee involving around 15 key players representing the regions and the Group. Thirteen modules have been published thus far. Most of the modules will be developed and rolled out in 2023 to cover all HR aspects and target the major subjects to be addressed. These pages have already received over 800 visits and 173 course registrations have been made by 62 unique learners since the launch.

CSR awareness-raising

As detailed in Section 6.5 “Driving the culture”, a mandatory e-learning module has been launched in eight languages to raise employee awareness of CSR issues.

Mentoring to Lead

The aim of this mentoring programme is to share experience between experienced leaders and high-potential employees with a view to boosting their development and increasing their visibility at the company. Following the implementation of a pilot in France in 2019, implementation at the Group level continued for the third year, with:

  • 71 participants, 58% of them women, to help expand the pool of future female leaders;
  • from six regions and representing 28 countries and 35 nationalities; and
  • from all staff levels, including Senior Managers.

Of particular note this year were the increase in the number of mentee-mentor duos from different regions and the internal occupational mobility triggered as a direct consequence of the programme. At WER and head office, one-third of programme participants have already benefited from a functional or geographic transfer or have concrete plans to do so in the short term.

The continuation of systematic training at the beginning of the programme, the setting of clear objectives, the provision of a mentoring guide and the follow-up carried out by the HR teams contribute to the success of the programme, with feedback from participants, mentees and mentors alike remaining excellent.

360° feedback

Coface introduced a 360° feedback tool in 2022 to help personnel selected by their local entities (including high-potential employees preparing for a change, having recently taken up management positions or holding an exposed position) to better pinpoint their development priorities by comparing their own perception with that of their main contacts in the organisation. Developed on a bespoke basis for Coface, the feedback questionnaire assesses skills that reflect the company’s values and culture. The list of skills was determined with senior managers and HR leaders from the regions and the Group and approved by the Executive Committee. Following a pilot exercise in January with 12 participants from various backgrounds, the tool was made available across the entire Group. In total, 53 employees from 26 countries received 360° feedback in 2022.

Onboarding and training new employees recruited for the information sales business

In 2022, nearly 160 new employees joined Coface to work on the information sales business. This substantial recruitment effort was accompanied by a series of actions to rapidly integrate the new hires and ensure that they take up their positions under good conditions. It was also important to support employees assigned to credit insurance, Coface’s traditional business. The aim here was to ensure that they were familiar with these new information products and that the new business line and the new teams do not generate any misunderstanding and anxiety among existing Coface teams.

In the first quarter, webinar sessions were organised for information teams to train them in traditional credit insurance products and business lines. At the same time, the credit insurance teams attended similar sessions on information sales products and business lines. A total of 925 employees were trained in first-quarter 2022 and 600 in fourth-quarter 2022.

A plan for onboarding new arrivals has been put in place featuring training, small-scale workshops, and coffee talks with the information teams at head office.

The Group has also introduced a process including systematic onboarding checklists for managers recruiting new employees. Onboarding has also been enhanced through feedback from the My Voice Pulse surveys.

My Voice Pulse

Coface has decided to renew its engagement surveys. In 2021, it set up a tool, renewed in 2022, to focus not just on motivation but on the employee experience. Coface also gave each manager with more than six direct employees access to the answers of their team to help them dialogue and accurately address avenues for improvement in the employee experience. The Group has decided to carry out this survey three times a year instead of once every 18 months. This will help all those involved to closely oversee their results and serve to measure the impact of improvement actions implemented by managers.

The survey compares Coface with the financial market benchmark, with adjustments specific to the reality of its population, thereby ensuring the accuracy of the comparison.

The results of the Q4 2022 survey showed that engagement was globally consistent with the benchmark with an average 7.6/10. The main conclusions point to the following:

  • progress on all indicators measuring motivational drivers;
  • confidence in the strategy, recognition of a healthy and non-discriminatory work environment;
  • strong appreciation of company values, perceived as part of the daily life and the “employee experience”, as well as recognition of the management of the company’s transformation;
  • pressure on wages and workload;
  • perception of distance in daily working relationships owing to the growing remoteness of the office.

A significant year-on-year increase in engagement for all the regions, with room for improvement to meet the benchmarks of comparable financial companies.

Compensation policy

In accordance with the regulatory requirements applying to the insurance sector (Solvency II), Coface’s compensation policy is reviewed each year to align it with the Group’s strategic objectives and ensure effective risk management at the Company.

This policy, detailed in Chapter 2.3.1, aims to attract, motivate and retain the best talent through a balanced approach to total compensation, incorporating short- and long-term fixed and variable components. This policy notably serves to:

  • encourage individual and collective performance. The bonus policy is reviewed and approved each year by the Management Committee with regard to the Group’s priorities. It incorporates collective financial and non-financial objectives. In 2022, the objectives of the Group’s Senior Managers included client satisfaction and employee engagement, as well as a gender equality target assessed through an increase in the Global Gender Index and the proportion of women in Senior Management and succession plans;
  • position the Group competitively on the market while respecting its financial balance. Since 2018, the Group has regularly participated in compensation surveys with a compensation consulting firm specialised in the financial services sector. The objective is to increase knowledge of market practices and ensure informed oversight of Group compensation. This survey was administered in 18 main countries in 2022;
  • retain talent. Each year, the Group awards free performance shares to an identified regulated population in the context of the Solvency II Directive (Executive Committee, key functions and employees with significant influence on the Company’s risk profile), for whom a portion of variable compensation must be deferred, and to certain key employees as part of the reward and retention policy. The vesting period for this scheme is set at three years;
  • comply with the regulations in force and guarantee internal fairness and professional equality, particularly between women and men. As part of its annual review, the Compensation Department ensures that the distribution of budgets for pay rises notably respects gender equality. In France, the Human Resources Department carried out substantive work aimed at correcting these inequalities. These efforts were reflected in Coface’s good result in the occupational equality index implemented in connection with equal pay legislation. With a score of 90 out of 100 for 2022, Coface is now above the legal obligation set at 75 points. Drawing on this experience, Coface has decided to go further by adapting the France index to the entire Group. The Group achieved an excellent result of 88 points out of 100 in 2022, up 4 points compared with 2021. The Group has set an objective of continuous improvement in this area;
  • be consistent with the Group’s objectives and support its development strategy in the long term. The Group’s policy aims to prevent any conflict of interest in its compensation practices and integrate social and environmental issues into its thinking. In 2020, the Group defined its global car policy with the main objectives of harmonising practices and reducing the carbon impact of the vehicle fleet. This policy was implemented at the entities in 2021 and 2022;
  • diversify the Group’s talent pool through its international occupational mobility policy. International occupational mobility practices remain dynamic, reflecting Coface’s ability to continue to offer career development opportunities, while limiting the costs involved in international transfer packages. Coface has a responsible approach to expenditure, keeping it at a level acceptable to the company while remaining fair to employees.
    • total number of employees on international transfers in 2022: 95 vs. 86 in 2021 (and 76 in 2020):
      • women are highly represented: 46% (38% in 2021),
      • cultural diversity remains very strong: 28 nationalities in total.
    • number of new employees on international transfers in 2022: 21 vs. 26 in 2021:
      • the share of inter-regional occupational mobility remains substantial: at 71%, compared with 81% in 2021,
      • that of women too, and the share is increasing: at 62%, compared with 46% in 2021,
      • non-French people continue to represent the majority: 62%, compared with 73% in 2021 – In total, 10 nationalities are represented.
Measuring the effectiveness of the talent management policy

The following indicators are used to measure the impact of the various initiatives:

  • breakdown of internal/external candidates among new appointments for Senior Management roles in 2022: out of 44 new appointments, a large majority came from internal staff (64% vs. 36% from external recruitments);
  • offering internal development opportunities at these job levels remains a priority for Coface. At the same time, it is consciously choosing to seek new skills externally, for example to accelerate the development of information sales;
  • turnover of employees identified as “high potential” (4): Every high-potential employee leaving the company is a regrettable loss, even if the number is limited.

High potentials are approved each year at the end of June following the Talent Reviews. To have a sufficiently representative period for turnover, Coface measures the percentage of employees identified as “high potential” having decided to leave the company in the following year. In this respect, 8.3% of the high potentials identified at the end of June 2021 resigned one year later. For the high potentials identified in June 2022, the forecast trend for end-June 2023 is just over 10.4%. This increase in resignations reflects today’s labour market tensions and the search for advantageous wage offers in a context of high inflation.

Employee perception of career development at the company was measured by the latest My Voice Pulse survey. Answering the survey questions, Coface employees see it as a learning company where they can develop their career and skills. The overall score for this question is 7.6/10, an increase of 0.2 compared with the previous year.

(1)
For Senior Managers (or the “Top 200”), Coface considers the professionals of the Regional Management Committees, all country heads, whether or not they are members of a regional management committee, the Group Executive Committee, Group Directors reporting directly to them or N-2 Managers responsible for a scope with a high overall impact and with a high degree of autonomy.
(2)
For Senior Managers (or the “Top 200”), Coface considers the professionals of the Regional Management Committees, all country heads, whether or not they are members of a regional management committee, the Group Executive Committee, Group Directors reporting directly to them or N-2 Managers responsible for a scope with a high overall impact and with a high degree of autonomy.
(3)
“Best talent” here means high-potential individuals, employees with critical expertise for Coface’s success and adaptable professionals able to take on international responsibilities.
(4)
Definition of “high potential”: (i) Senior Manager with the ability to join the Group Executive Committee (regardless of the time scale); (ii) For other levels: employee with the ability to become a Senior Manager (regardless of the time scale).

6.4Coface, a responsible enterprise

A RESPONSIBLE ENTERPRISE


Major themes addressed:


COA2022_URD_EN_ODD-3_HD.png


Integration of CSR (including the environment) into the commercial policy (part 6.2)

General environmental policy

R.10

Carbon assessment, commitment, reduction plan and net-zero trajectory

R.10

Energy consumption

R.10

Travel and car policy

R.10

Environmental issues are becoming increasingly important in public debate. The Paris Agreement, which aims to limit global warming to 1.5°C compared with the pre-industrial level (and thus targeting carbon neutrality by 2050 at the latest), marks a turning point by recognising the significant role played by companies in global climate governance.

Companies are facing new regulations in this respect, as well as significant pressure from investors and employees to adapt their business activity to current environmental challenges and reduce their environmental footprint.

Companies, Coface included, failing to comply with regulations and contribute to this international effort may be exposed to controversy and see their appeal fade in the eyes of internal and external stakeholders.

6.4.1General environmental policy

A policy taking shape

Seeking to contribute to this effort and adapt to current and future regulations, Coface is beginning by adapting its business model, gradually taking into account the environmental and climate risks of clients and debtors, the environmental and social impacts of investments and by demonstrating its ambition to strengthen its support for ESG projects with its Single Risk activity (as explained above in paragraph 6.2). In 2021, the Group also initiated an approach to reduce its environmental footprint, starting with measuring its carbon footprint.

A carbon assessment was finalised in 2022, based on 2019. This enabled Coface to establish an action plan to reduce its greenhouse gas (GHG) emissions and initiate a trajectory on emissions reduction (the approach explained in Section 6.4.2).

In parallel, Coface implemented a Group car policy in 2020 applying to all entities, the main objectives being uniform and consistent practices and a reduction in the carbon impact of its car fleet. The vehicles available in each country’s catalogue must be adapted to the use of drivers. The emphasis is on hybrid and petrol models and a limited range of models per vehicle, the aim being to increasingly reduce the environmental impact of its fleet in future years. Additional options that have a negative impact on vehicle consumption are also prohibited.

A travel policy for Coface France employees was also adapted and rolled out for the Group in 2018.

In addition, the building housing the head office in Bois-Colombes since 2013 has a capacity of around 1,200 employees (accounting for approximately 94% of office space in France). It has obtained NF MQE certification (high environmental quality for construction) and BREEAM certification (BRE Environmental Assessment Method). It incorporates current best practices in terms of the immediate environmental impact, construction materials and processes, and production of waste.

The head-office building also has BBC low-consumption certification. It preserves natural resources through various systems; for example, limited need for water for watering recovered from roofs and energy-efficient outdoor lighting.

6.4.2From measuring the carbon footprint to setting a net-zero trajectory

a)Carbon assessment approach

In 2022, Coface carried out a global carbon assessment forming the basis for the development of an action plan to reduce emissions.

The Group’s carbon footprint was based on its GHG emissions in 2019, considered as the most representative year for Coface’s pre-Covid business activities.

The assessment was performed in collaboration with Goodwill Management, an agency certified by the Bilan Carbone® methodology published by the French Environment and Energy Management Agency (ADEME). This methodology assesses all the greenhouse gases defined by the IPCC directly and indirectly generated by a company’s business activities. These emissions are calculated in several categories (Scope 1, Scope 2 and Scope 3):

  • Scope 1: emissions generated directly by the company;
  • Scope 2: emissions generated indirectly by electricity and heat purchased and consumed by the company;
  • Scope 3: other direct emissions (purchases of services and goods, employee travel, investments, claims, etc.).
COA2022_URD_EN_G036_HD.png

Coface’s carbon assessment takes into account all three scopes and focuses on its main business, credit insurance, accounting for nearly 90% of premium income.

Operations include emissions generated by upstream Coface activities and the credit insurance activities themselves:

  • purchases;
  • transport (passengers);
  • energy and capital goods (Scopes 1, 2 and 3);
  • items related to freight and waste are considered immaterial (between 0% and 0.1% of the carbon footprint).

Regarding the downstream component of the carbon footprint for companies in the financial sector, the methodology takes into account the direct financial support provided by the company. As such, the investments and claims paid to clients were considered when calculating the indirect greenhouse gases generated by the use of Coface products.

To measure the emissions generated by the financial flows of claims, Goodwill Management has adapted the Bilan Carbone® methodology, mapping financial flows by sector and country.

A methodology developed by Carbone4 was then applied to eliminate most of the double counts in Scope 3 of emissions related to financial flows. The Carbon Impact Analytics methodology is used to quantify emissions related to energy consumption across the entire value chain by removing repeated counts from the same energy source. For example, a delivery company’s consumption of diesel is counted three times (first, in the direct emissions of its carbon footprint; second, in the indirect emissions of the oil company; and third, in the indirect emissions of the company producing the trucks).

To measure GHG emissions related to investments, Coface relied on the data provided by its asset manager, Amundi. The latter’s results are more granular and its methodology more adapted to the various types of assets, though with a limited coverage rate (40% of the portfolio) and a limited consideration of Scope 3 emissions (Scope 3 of Tier 1), stemming from the maturity of existing measurement tools.

More than 50 contributors contributed to the data collection phase in 11 countries (France, Germany, Italy, Spain, the United Kingdom, Romania, Austria, the Netherlands, Morocco, the United States, Poland); each one was required to submit the exhaustive data necessary for measuring the carbon footprint. GHG emissions from other countries were extrapolated to the entire group based on their contribution to 2019 revenue.

b)Carbon emission reduction plan and trajectory

The carbon assessment was introduced with the aim of implementing a Group decarbonisation strategy based on a regular update of this assessment. A carbon assessment will thus be carried out in 2026 relative to 2025 to determine whether or not the commitments are met.

Consequently, an emissions reduction plan has been developed in collaboration with Coface’s various departments.

The plan is naturally structured around the three categories: investments, claims and operations.

The support and commitment of stakeholders (suppliers, employees, clients, companies in which Coface invests) will be crucial in the coming years to successfully achieving the collective carbon neutrality effort.

1/Investments

In terms of investments, as mentioned in Section 6.2.3, Coface has committed to joining the Net Zero Asset Owner Alliance (NZAOA) in 2023 and to decarbonising its investment portfolio to ensure net-zero emissions by 2050 with the other members of the alliance. 

Initially, Coface has set itself a target of reducing its Scope 1 and 2 GHG emissions related to investments, corporate equities and bonds, by 30% between now and 2025 (based on 2020), in line with the NZAOA 2025 trajectory (-22%; -32%). To achieve its objective, Coface will continue to engage the 20 largest carbon emitters in its portfolio on ESG and also Climate aspects.

In a second step, Coface will endeavor to set intermediate objectives, starting with that of 2030 (NZAOA 2040 range: -40%; -60%), with a view to achieving carbon neutrality for its investment portfolio by 2050.

The curve below shows portfolio decarbonisation forecasts for 2050.

COA2022_URD_EN_TRAJ_BAS_CARB_Investissements_p02_HD.png

The white curve represents an estimate of the evolution of the carbon emissions of the investment portfolio in the absence of a new decarbonization objective after 2025. This projection only starts from 2025 because Coface has already made a commitment to decarbonization by 2025. The lack of increase in the carbon footprint (expressed in t CO2 equivalent per M€ invested) is mainly explained by:

• continued pressure from institutional investors with respect to issuers through the commitment pillar,

• regulatory pressure on issuers through the CSRD directive, applicable from 2025 (based on the 2024 financial year) which will widen the scope of companies concerned by the non-financial reporting obligation (carbon footprint, objective, trajectory and action plan).

These two factors would make it possible to balance the potential growth of the portfolio covered (real estate, infrastructure).

The green curve represents Coface's commitment by 2025, then the green dotted line shows the way to go until 2050, to ensure net zero emissions in 2050.

2/Claims

Coface is committed to reducing claims-related emissions by 7% between 2019 and 2025. This reduction is based on a dual strategy:

  • the commitment of clients to reduce their emissions;
  • the revision of its commercial exclusion policy.
COA2022_URD_EN_TRAJ_BAS_CARB_Indemnisations_p04_HD.png

Claims-related GHG reduction targets will be gradually reassessed in the coming years and accompanied by the development of appropriate tools.

3/Operations

The carbon footprint of all Coface’s operations in 2019 amounted to 42,762 tCO2eq, or 9.6 tCO2eq per employee. This carbon assessment forms the basis of the plan to reduce operations developed in close collaboration with Coface’s various departments. In 2022, emission reduction workshops were organised at the Group level with the IT, Human Resources, Management Facilities and Procurement Departments. They were accompanied by digital and physical workshops open to employees in the regions, the aim being to collectively discuss all possible reduction initiatives and engage all employees in a reduction approach.

Drawing on these results, Coface aims to reduce its GHG emissions from operations by 11% between 2019 and 2025 and contribute to carbon neutrality by 2050 despite estimated growth in revenue and the growing number of employees.

Coface’s objectives for 2025 are based on the estimated and quantified impact of all the drivers used in the emission reduction action plan for the coming years.

Starting in 2030, the figures will be positioned on a Science Based Target initiative (SBTi) trajectory such that the entire roadmap contributes to carbon neutrality by following a trajectory limiting global warming to 1.5°C above the pre-industrial period, in accordance with the Paris Agreement.

In the coming years, Coface will need to refine the data collected in order to avoid the use of financial ratios as much as possible and favour physical data (e.g. number of emails sent and average weight of an email, rather than the amount spent on Outlook licences) with much lower uncertainty rates. This will serve to enrich the action plan with finer data and provide a greater number of quantitative objectives.

COA2022_URD_EN_TRAJ_BAS_CARB_Operations_p02_HD.png

The GHGs generated by Coface’s operations are divided into four categories: purchases, transport, energy and capital goods. All the initiatives mentioned below are targets for 2025 and the reduction indicators are based on the results of Coface’s carbon assessment in 2019.

COA2022_URD_EN_G037_HD.png
i. Responsible purchasing

Purchases represent the largest category of the GHG emissions generated by Coface operations. To reduce the impact of purchases, Coface plans to engage all of its suppliers and service providers and favour those committed to a trajectory compatible with the Paris Agreement. It notably takes ESG criteria into account in calls for tenders and obtains exact figures from existing suppliers on their carbon assessment.

To optimise the purchase of IT services and the corresponding physical data (such as data stored in emails or servers), Coface plans to implement responsible digital practices to raise employee awareness of the social and environmental impacts of the digital industry and disseminate a set of best practices (including regular data sorting habits and a more responsible method for sharing large files).

Coface also aims to reduce printing by 30% between 2019 and 2025 to limit the use of all the resources (amount of paper reams and ink) necessary for printing.

ii. Transport
Travel policy

The travel policy for Coface France employees was adapted and rolled out for the Group in 2018.

As part of this update, special attention was paid to environmental issues. To fully involve employees in this approach, the Group travel policy highlights a number of best practices aimed at raising employee awareness with regard to business travel:

  • opting for telephone calls or video conferences;
  • choosing train travel for short trips;
  • proposing carpooling solutions between co-workers and/or taxi sharing;
  • limiting printing by carrying out all procedures online (boarding pass, insurance card, etc.).

Type of travel

Metric tonnes CO2 equiv. 
for the 2022 reporting scope

France, Germany, Italy, Spain, United Kingdom, Poland, Morocco, Netherlands, Austria, Romania and United States

Metric tonnes CO2 equiv. 
for the 2021 reporting scope

France, Germany, Italy, Spain, United Kingdom, Poland, Morocco, Netherlands, Austria, Romania and United States

Metric tonnes CO2 equiv. 
for the 2020 reporting scope

France, Germany, Italy, Spain, United Kingdom, Poland, Morocco, Netherlands, Austria, Romania and United States

Aeroplane

470

134

151

Train

48

9

15

(Metric tonnes CO2 equiv.)

2022

2021

2020

2019

Train

Aeroplane

Train

Aeroplane

Train

Aeroplane

Train

Aeroplane

France

2

213

0.4

64

1

67

3

394

Germany

7

22

0

10

0

10

0

37

Italy

2

45

3

13

2

5

2

119

Spain

6

25

0.5

17

2

15

11

68

United Kingdom

29

9

4

1

6

3

0

20

Poland

0.4

17

0.8

0.6

3

2

10

37

Morocco

0

10

N/A (1)

N/A (1)

N/A (1)

N/A (1)


Netherlands

1

1

N/A (1)

0.4

N/A (1)

2


Netherlands

0

10

0.1

6

N/A (1)

7


Romania

0.1

48

0.2

4

N/A (1)

5


United States

1

70

0.5

17

N/A (1)

35


  • No journeys in that year.


In Germany, CO2 emissions from train travel were previously quantified as 0 because they were 100% offset. For 2022 data, the ADEME train-travel emission factor in Germany is used in order to align with the carbon assessment methodology used to calculate Coface’s overall carbon footprint.

Train-travel emission factors in Poland and Romania have also been adjusted to best reflect their geographical scope (Europe rather than World as applied the previous year) and align with the carbon assessment methodology.

Although air and rail travel increased in all countries in the reporting scope following the lifting of pandemic restrictions, efforts to reduce non-essential business travel and the practice of remote working were reflected in 2022. Indeed, when comparing GHG emissions for the six countries already in the reporting scope in 2019, it can be seen that between 2019 and 2022, emissions related to train travel have increased by 78% (mainly due to the methodological change for Germany’s emissions factor and a significant number of train journeys for the UK in 2022) and those related to air travel have decreased by 51%, i.e. an average of -46% of the total emissions related to train/plane travel between 2019 and 2022.

Coface is pursuing and stepping up its efforts to reduce business travel by reviewing the travel policy and reducing all business trips by 40% (compared with 2019) by promoting remote meetings. The objective is also to further strengthen the use of trains rather than planes wherever possible.

Vehicle policy

As detailed in paragraph 6.4.1, Coface has implemented a car policy since 2020.

Coface contributes to the reduction of greenhouse gas emissions notably through its car policy, whereby the most polluting vehicles in its fleet are replaced by petrol, hybrid and all-electric vehicles.

These changes to Coface car fleet resulted in 2022 in an increase in petrol consumption (or electricity consumption for countries with plug-in hybrid or all-electric cars).

/Table of fuel consumption since 2019

Fuel: diesel and four-star premium fuel

2022 reporting scope

France, germany, italy, spain, united kingdom, poland, morocco, netherlands, austria, romania and united states

2021 reporting scope

France, Germany, Italy, Spain, United Kingdom, Poland, Morocco, Netherlands, Austria, Romania and United States

2020 reporting scope

France, Germany, Italy, Spain, United Kingdom, Poland, Morocco, Netherlands, Austria, Romania and United States

2019 reporting scope

France, Germany, Italy, Spain, UK and Poland

Litres

654,088

521,631

538,505

716,527

Metric tonnes CO2 equiv.

1,743

1,387

1,437

1,847

(Fuel (diesel and four-star premium fuel) in litres)

2022

2021

2020

2019

2019 vs. 2022

Diesel

Premium

Total

Diesel

Premium

Total

Total

Total


France

109,640*

56,922*

165,295

117,924

19,450

137,374

115,197

166,930

0%

Germany

168,201

51,070

219,271

138,416

16,805

155,221

201,394

322,688

(32%)

Italy

77,715

8,397

86,112

61,959

5136

67,094

48,865

96,243

(11%)

Spain

3,616

3,016

6,632

2,994

2,118

5,112

4,263

12,784

(48%)

United Kingdom

1,385

3,536

4,921

1,573

1,873

3,446

2,584

9,983

(51%)

Poland

2,328

70,209

72,537

6,145

55,142

61,287

61,098

100,277

(28%)

Morocco

10,085

1,998

12,083

14,010

N/A

14,010

10,755


Netherlands

0

29,487

29,487

1,795

29,977

31,772

49,929


Austria

13,362

9,246

22,608

10,665

5,509

16,174

25,979


Romania

5,536

28,339

33,875

7,236

22,905

30,141

18,442


United States

N/A (1)

N/A (1)

N/A (1)

N/A (1)

N/A (1)

N/A (1)

N/A (1)


  • As the United States does not have a fleet of owned or leased vehicles, it does not report this indicator.

* Value containing estimates.

Fuel consumption has increased in most countries since 2021 with the lifting of pandemic restrictions. This is a result of the resumption of visits by clients and other stakeholders, as well as the return of employees to the office.

To reduce the environmental impacts of Coface fleet, the 2025 action plan is underpinned by several drivers:

  • the maintenance of remote working 2 to 3 days per week and 4 weeks/year of 100% remote working, enabling the closure of offices and the elimination of commutes during this period;
  • the electrification of 10% of the vehicle fleet by 2025. In France, for example, the new catalogue will include electric vehicles for each category of beneficiaries and gradually exclude the heaviest internal-combustion models. Six electric charging stations have been installed at the Bois-Colombes site to meet new charging requirements;
  • reducing the number of cars in Coface fleet by offering alternatives to employees (more attractive car allowances). Each new beneficiary of a company car will be made aware of the social and environmental issues related to the car, and the new catalogue will include a decision tree encouraging the employee to question their real need and refer them to light and electric models;
  • the gradual training of all employees with a company car on eco-driving, to help them drive more economically and also more safely;
  • facilities offered to employees, in some countries, to have a small-capacity company car during the year and lease/replace their car with a higher-capacity car during holiday periods.

The catalogue will also be reviewed regularly to adapt to the market and provide an increasingly optimised choice in terms of environmental impact.

Average CO2 emissions for the entire vehicle fleet in France stood at 128 g/km in 2022 (WLTP standard). Vehicle CO2 emissions are rated at the time of purchase. As the fleet is renewed, the CO2 emissions of vehicles are taken into account according to the new WLTP (Worldwide Harmonised Light Vehicle Test Procedure) calculation standard, which assigns an average of 20% to 30% additional CO2 emissions for the same combustion vehicle.

Diesel is reserved exclusively for employees with extensive mileage (over 20,000 km a year).

Commuting

The emissions related to the commuting of Coface employees fall within the scope of Coface’s carbon assessment. The main aim of the plan to reduce these emissions is to raise employee awareness of the social and environmental impacts of the use of individual vehicles. In 2019, 10% of employees commuted by car, accounting for 91% of the GHG emissions generated by commuting. The commuting reduction plan thus aims to maintain remote working in order to limit commutes and switch from individual vehicles to public transport.

Coface will launch a CSR challenge in September 2023 to raise employee awareness and foster the use of less polluting modes of transport for commutes.

Mindful that some employees do not have easy access to public transport, and based on the recommendations of employees in the workshops, Coface’s head office in Bois-Colombes plans to adjust its infrastructure to enable employees to charge their individual electric vehicles on site. Additional charging stations will be installed and made available to employees. If this measure proves effective, it may be implemented at other sites.

The CSR Department plans to set guidelines for the various countries to ensure that when offices move, the new location is strategically positioned with regard to public transport access.

Lastly, as explained above, Coface will fully close all its offices four weeks a year.

iii. Energy
Consumption indicator

The Group’s energy consumption concerns lighting, air conditioning and heating of the premises. Since 2021, this indicator has also included the consumption of electric and hybrid vehicles when the data is traced.

/Reported energy consumption since 2019 for the reporting scope


2022 reporting scope France, Germany, Italy, Spain, United Kingdom, Poland, Morocco, Netherlands, Austria, Romania and the United States

2021 reporting scope 1 France, Germany, Italy, Spain, United Kingdom, Poland, Morocco, Netherlands, Austria, Romania and the United States

2020 reporting scope France, Germany, Italy, Spain, United Kingdom, Poland, Morocco, Netherlands, Austria, Romania and the United States

2019 reporting scope France, Germany, Italy, Spain, Poland and the United Kingdom

Consumption

Co2 equiv.

Consumption

Co2 equiv.

Consumption

Co2 equiv.

Consumption

Co2 equiv.

Electricity

4,792 MWh

1,469 tCO2eq

4,766 MWh

711 tCO2eq

4,690 MWh

694 tCO2eq

5,007 MWh

573 tCO2eq

Gas

1,273 MWh

272 tCO2eq

1,101 MWh

236 tCO2eq

1,038 MWh

233 tCO2eq

963 MWh

214 tCO2eq

Surface area

64,896 m2

64,896 m2

65,123 m2

34,776 m2

In Germany, CO2 emissions generated by electricity consumption were previously quantified as zero because Coface Germany chose an energy contract based entirely on renewable energy sources. Since 2022, the ADEME emission factor for the German electric mix has been used, the aim being to align with the carbon assessment methodology used to calculate the entire Coface carbon footprint. This methodological change, applied to one of Coface’s largest sites, with fairly carbon-intensive electricity, artificially increases total emissions related to electricity without significantly increasing overall consumption compared with 2021.

(Consumption MWh)

2022

2021

2020

2019

2022 vs. 2019
 % change

Electricity

Gas

Electricity

Gas

Electricity

Gas

Electricity

Gas

Electricity

Gas

France

1,703

303

1,599

245

1,507

165

1,836

205

(7%)

48%

Germany

1,727

N/A

1,714

N/A

1,673

N/A

1,960

N/A

(12%)

N/A

Italy

280

543

288

551

286

594

427

588

(34%)

(8%)

Spain

213

N/A

295*

N/A

317

N/A

469

N/A

(37%)

N/A

United Kingdom

174*

150

186*

150

179

171

210

170

(11%)

(11%)

Poland

88*

N/A

107*

N/A

123

N/A

104

N/A

(16%)

N/A

Morocco

65

N/A

81

N/A

68

N/A


Netherlands

157*

N/A

203*

N/A

192

N/A


Austria

78

N/A

72

N/A

93

N/A


Romania

214*

263*

110

138

91

93


United States

92*

14

110

17

159

17


* Value containing estimates.

Although COVID-related restrictions were lifted in 2022, the Group’s electricity consumption was fairly similar to 2021, thanks in particular to the continuation of remote working.

Total gas consumption is increasing, mainly due to:

  • Romania, whose premises function using gas, where employees have returned to the office in significant numbers compared with 2021;
  • France, where consumption rose owing to a breakdown of solar panels on the roof of the head office. These solar panels had been used to replace the boiler for a few months of the year. The manager of the Bois-Colombes building is currently repairing the solar panels, due to be completed in February 2023;

between 2019 and 2025, Coface aims to reduce its GHG emissions generated by energy consumption, primarily through:

  • a 30% reduction in total office space,
  • the optimisation of offices according to the number of employees on site. At Coface’s head office in Bois-Colombes, for example, since Friday is mainly a “remote working day”, employees working on-site are grouped together on the floors in order to close three floors of the office and not heat them,
  • the enhanced use of heating and air conditioning: In accordance with French government recommendations, heating of buildings will be limited to 19°C in winter and air conditioning limited to 26°C in summer.
iv.Capital goods
/Table listing capital goods surface areas in 11 countries

Country

m2 in 2022

France

18,882

Germany

21,488

Italy

4,981

Spain

3,412

United Kingdom

971

Poland

2,535

Morocco

2,000

Netherlands

1,595

Austria

2,432

Romania

2,305

United States

4,296

To limit the environmental impact of capital goods, Coface is committed to reducing office space by 30% in all 60 countries between 2019 and 2025. Significant reduction efforts have already been made in several regions following the implementation of remote working and flex offices. This will naturally reduce the consumption of electricity, heating and air conditioning. Headway is being made on this objective thanks to the implementation of the flex office between 2019 and 2022.

Coface also plans to increase the lease term of company vehicles (+1 year) in order to maximise the vehicle use period and exceed the carbon footprint depreciation period related to their production.

6.5Driving the culture

To succeed in the approaches presented in reference to the first three pillars of the CSR strategy, Coface has implemented a cornerstone initiative called “Driving the culture” aimed at structuring the Group’s ESG approach and developing a robust culture of responsibility among all Coface’s stakeholders through a communication plan.

Governance reviewed

Coface introduced a CSR governance in 2022 mainly based on CSR champions in the various regions and a CSR committee including all the members of the Executive Committee. The Group CSR Manager now attends all Group Risk Committee meetings to ensure that ESG issues are properly taken into account at Coface. The role of champions is to communicate on the CSR strategy within their region and to collect ideas or questions from employees. Champions also organise awareness-raising initiatives and workshops in the regions in collaboration with the Communications Department and the Regional Management.

The role of the Group CSR Committee is to coordinate Group and regional initiatives while steering Coface’s environmental and social ambitions and progress at each level of the organisation.

The Board of Directors is regularly informed and consulted on the CSR strategy and monitors the progress of initiatives launched in this area.

COA2022_URD_EN_G038_HD.png

To strengthen the development of a responsible culture at each level of the organisation, some regions, such as Latin America, have sought out CSR correspondents in each of their countries.

Increased awareness

At the beginning of 2022, a number of meetings were held to present and explain the CSR strategy at the various departments, including Audit and Human Resources.

In February 2022, Coface dedicated part of its annual seminar of key clients to the theme “The positive impact of ESG on commercial credit management and credit insurance”. The Group Head of Marketing and Innovation, Coface’s CSR manager and an external speaker participated in filmed discussions and interviewed clients on their vision of the maturity of corporate CSR integration today as well as current ESG ratings. The debate concluded by addressing the vital but complex issue of strengthening business exclusion policies and client expectations concerning credit insurers.

To put into perspective the importance of measuring the company’s carbon footprint, and to thank all contributors to the data collection campaign, an information session on climate and energy issues was held in April 2022.

In June, a sporting challenge was launched at the company. In addition to promoting physical and sporting activities, as part of a team or individually, the challenge featured quizzes on CSR issues such as carbon neutrality and the impact of meat consumption and car transport.

As in 2021, Coface took advantage of the three sustainable development weeks in September/October to organise conferences aimed at raising awareness of Coface’s CSR strategy, key projects such as single-risk ESG projects and the results of the carbon assessment. The conferences also explored complex topics including responsible investment and biodiversity, with the input of external speakers. The conferences were also an opportunity to align employees on key definitions such as the ESG/CSR acronyms, carbon neutrality and the three scopes of GHG emissions.

A Leadership Meeting session bringing together all 200 senior managers of the Group also focused on CSR, the aim being to recap the key items from the European Sustainable Development Weeks organised by Coface. The session also reviewed the major challenges facing the financial industry in its climate contribution efforts.

In November 2022, a mandatory e-learning module was launched in eight languages to raise employee awareness of CSR issues around the world. The objective of the module was to boost understanding of the economic, environmental and societal challenges companies face through their business activities and how they can better control their impacts. The module was also devised to help employees take ownership of Coface’s approach and priorities through company-specific content. One month after launch, more than 95% of employees had completed the training, in line with the target.

In addition, workshops were organised in France and Northern Europe to allow employees to collectively discuss the action plan to reduce the emissions generated Coface’s operations and make their own suggestions.

Numerous awareness-raising initiatives were also organised in the regions. “Zero waste in the office” conferences were organised in France by the Green to Lead network, created on an initiative by employees in 2020 and composed of employees seeking to boost environmental awareness at the company.

The Mediterranean & Africa region has launched a programme with three objectives:

  • take proactive actions to integrate social, ethical and environmental issues;
  • develop a shared CSR culture in line with the objectives of the Group strategy;
  • improve the well-being of employees and their commitment to the local community.

Thanks to this programme, the region has committed to reforestation initiatives and each employee has one additional day off to volunteer with NGOs/associations that support the environment or local communities. The region also promotes healthier, local food by distributing fresh local fruit to the office. It also fosters the circular economy by recycling jeans and organising collections of clothing and toys.

The structuring of CSR data will undoubtedly stand as a major challenge in the coming years as it affects virtually all the departments at the company. As such, the company introduced a CSR dashboard in 2023 to respond more efficiently to mounting reporting requirements and stakeholder questions. The purpose of the dashboard is to set clear targets for each region on reducing greenhouse gas emissions and help them to manage their action plans.

In 2023, Coface also plans to launch a worldwide CSR challenge to strengthen cultural change and call on employees’ competitive spirit to achieve more responsible objectives.

6.6European taxonomy

Pursuant to EU Regulation 2020/852 of June 18, 2020, known as the “Taxonomy Regulation”, COFACE SA is required, when closing its 2022 financial statements, to publish the information provided for in Article 8 of said regulation, supplemented by the Commission Delegated Regulation of July 6, 2021.

The European Taxonomy classifies economic activities having a positive impact on the environment. 

The objective is to direct investments towards activities considered as environmentally sustainable with a view to achieving carbon neutrality by 2050. 

The Taxonomy Regulation identifies economic activities that contribute substantially to six environmental objectives:

  • Climate change mitigation;
  • Climate change adaptation;
  • The sustainable use and protection of water and marine resources;
  • The transition to a circular economy;
  • Pollution prevention and control;
  • The protection and restoration of biodiversity and ecosystems.

As of January 1, 2023 (based on fiscal 2022), Coface’s regulatory obligation concerns the publication of information on the eligibility of its activities for the European Taxonomy.

As of January 1, 2024, financial companies will have to publish information on the alignment of their activities with the European Taxonomy.

6.6.1Investment indicator

Regulatory investment ratio

According to the European Commission FAQ published in December 2021, insurers are obliged to publish the information required by the European Taxonomy Regulation based on the real information published by companies.

Coface teams understand that if the information is not available (as is the case for 2022), insurers must indicate “0” for this indicator. Accordingly, the real value of Coface concerning the Taxonomy’s eligible investment indicator in 2022 was zero.

Voluntary investment ratio

The voluntary investment ratio published below is based on estimated data from the MSCI data provider. The ratio corresponds to the amounts of assets eligible (in market value) for the European Taxonomy regarding the first two climate objectives (climate change mitigation and adaptation) relative to the market value of the hedged assets.


Market value (in €)

Exposure to economic activities eligible for the Taxonomy

399,719,037

Hedged assets

1,895,015,111

Voluntary investment ratio (as % of hedged assets)

21.09%

As such, the proportion of assets eligible for the European Taxonomy for Coface’s investment portfolio is 21% of hedged assets, based on estimated data from the MSCI data provider transmitted by our asset manager Amundi.

Methodology

In accordance with Article 7.1 of Commission Delegated Regulation (EU) 2021/2139:

  • Hedged assets (ratio denominator) correspond to the total invested assets including exposures to cash and cash equivalents, excluding exposures to central governments, central banks and supranational issuers.
  • Derivatives and investments in companies not subject to the NFRD and non-EU companies are excluded from the numerator of the key indicators but are included in the denominator.
  • Exposures to assets eligible for the European Taxonomy concern corporate bonds, listed equities and also cash and cash equivalents.


Market value (in €)

% of total portfolio

Hedged assets

1,895,015,111

62.67%

Exposure to sovereign and similar issuers

1,128,624,617

37.33%

Total investment portfolio

3,023,639,728

100.00%

/Details of voluntary investment indicators (as a % of hedged assets)

Voluntary investment indicators (as a % of hedged assets)

Market value (in €)

% of hedged assets

Exposure to derivatives

7,870,848

0.42%

Exposure to companies not subject to the NFRD

ND

ND

Our asset manager's data provider is unable to determine the exposure to companies not subject to the NFRD. Therefore this information is undetermined "ND".

Voluntary investment indicators (as a % of hedged assets)

Market value (in €)

% of hedged assets

Exposure to economic activities not eligible for the Taxonomy

1,495,296,075

78.91%

Exposure to economic activities eligible for the Taxonomy

399,719,037

21.09%

Total assets covered

1,895,015,111

100.00%

Nuclear energy and fossil gas

According to the European Commission's FAQ, financial companies must report on nuclear and fossil gas activities by completing templates 1, 4 and 5 of the Complementary Delegated Act on Gas and Nuclear Activities published in December 2022.

Template 1: Activities related to nuclear energy and fossil gas

Given the late publication of the Complementary Delegated Act, Coface completed template 1 with a conservative and prudent approach.

Line

Nuclear energy activities

1

The company carries out, finances or is exposed to research, development, demonstration and deployment activities relating to innovative power generation facilities from nuclear processes with a minimum of waste from the fuel cycle.

Yes

2

The company carries out, finances or is exposed to the construction and safe operation of new nuclear facilities for the production of electricity or industrial heat, in particular for district heating purposes or for industrial processes such as hydrogen production, including their safety upgrades, using the best available technologies.

Yes

3

The company carries out, finances or is exposed to the safe operation of existing nuclear facilities for the production of electricity or industrial heat, in particular for district heating purposes or for industrial processes such as hydrogen production from nuclear energy, including their safety upgrades.

Yes


Fossil gas activities

4

The company operates, finances or is exposed to the construction or operation of power generation facilities from gaseous fossil fuels.

Yes

5

The company operates, finances or is exposed to the construction, renovation, or operation of combined heating/cooling and power generation facilities from gaseous fossil fuels.

Yes

6

The company operates, finances or is exposed to the construction, renovation, or operation of heat generation facilities that generate heating/cooling from gaseous fossil fuels.

Yes

As the required information is not available, Coface is unable to publish templates 4 and 5 for the 2022 financial year. The Group is working to be able to publish the required templates for the 2023 financial year.

6.6.2Underwriting indicator

Coface’s teams understand that this indicator concerns “non-life insurance covering risks related to climate risks” as specified in Appendix 2 of the Taxonomy Regulation – Regulation (EU) 2020/852.

The business lines referred to in the delegated acts of the Taxonomy Regulation relate to the eight non-life business lines within the meaning of the Solvency II Directive, namely:

  • medical insurance;
  • income protection insurance;
  • workers’ compensation insurance;
  • motor vehicle civil liability insurance;
  • other motor vehicle insurance;
  • marine, air and transport insurance;
  • fire and other property damage insurance;
  • assistance insurance.

As such, this ratio does not appear to apply to Coface’s economic activities (credit insurance, Single Risk, information sales, factoring, bonding). Consequently, the share of gross written premiums in non-life insurance eligible for the taxonomy was 0% in 2022.

6.7Standards and methodology

6.7.1Methodology for identifying non-financial risk

Non-financial risks have been mapped in several steps:

1/ The first step consisted in identifying a fairly broad spectrum of non-financial issues that could affect the Group or the company in the broad sense through the Group’s activities. This initial risk inventory was prepared based on an in-house review of CSR issues and CSR data collected in previous fiscal years, internal consultations, particularly with the Risk Department, as well as an external benchmark, analysing in particular the non-financial disclosures of other players in the financial sector together with best practices in the management of non-financial risks. Discussions with investors, rating agencies, clients and employees also helped to enrich the list of these issues.

This phase resulted in the identification of a little over 20 risks in four areas:

  • environmental risks (responsible company);
  • social risks (responsible employer);
  • risks related to our core business (responsible insurer); and
  • governance risks.

2/ Each risk was then assessed using an approach consistent with that implemented by the Group Risk Department for all risk mapping. The completeness of ESG risks has been compared with those present in the company’s risk management tool (operational or strategic risks) to ensure that risks with an ESG aspect are identified and that the results of the assessments obtained for these risks in annual risk analysis campaigns are transposed. The other risks not assessed were quantified and prioritised using a method based on that used in the risk management tool. Each non-financial risk was analysed in depth based on two criteria:

  • the level of intrinsic risk qualified as inherent risk: the assessment is carried out by cross-referencing the impact (the most unfavourable scenario of the financial impact, the client impact and the regulatory and legal impact) with an assessment of the risk occurrence frequency. An inherent risk matrix determines the level of inherent risks assessed on a scale of four levels: high, important, moderate and low;
  • the level of control of this risk based on the effectiveness of Level 1 and 2 controls, internal and external audit results, documentation, governance and monitoring of key performance indicators, IT and staff.

3/ Based on the assessments, the Group prioritised ten non-financial risks, which were approved by the relevant departments. An initial prioritisation is carried out to define the level of residual risk resulting from the cross-referencing of the inherent risk with risk mitigation according to a risk matrix resulting in one of four assessment levels: High, Important, Moderate and Low. A second prioritisation is also carried out using the same residual risk scale taking into account the most important inherent impact, then the level of mitigation; consequently, the highest inherent risk will remain riskier.

All of the non-financial risks selected were then included in the Group’s overall risk map.

As with the other risks monitored by the Group, the non-financial risks selected will be reassessed every year ahead of the drafting of the Universal Registration Document. The Group’s policies to protect itself against them, and details of the actions and results, are presented throughout this document.

Three ESG indicators, each one representing a major category of non-financial (environmental, social and governance) risks, were then presented to the Risk Committee and integrated into Coface’s Risk Appetite. As such, these indicators are monitored quarterly by the Management Committee.

6.7.2General organisation of reporting

Coface strengthens its non-financial reporting guidelines every year in order to ensure a unique and consistent framework across the reporting scope.

The information presented in this document was produced internally on the basis of information provided by the heads of each area concerned.

The information in the “Responsible insurer” paragraph was provided by the following departments:

  • Group Marketing (client satisfaction);
    • Commercial Subscription (commercial exclusion policy);
    • Group Investments, Financing and Treasury (environmental and social impact of investments);
    • Underwriting and Economic Research (consideration of environmental risk in the credit risk assessment and environmental impact of the debtor portfolio);
    • Risk (discontinuity of Coface’s transactions relative to environmental and cybersecurity risks);
    • Legal (subcontracting and suppliers);
    • Compliance (fair practices);
    • Taxation (tax evasion).

These components were coordinated by the Group’s CSR Department.

  • The corporate information and indicators in the “A responsible employer” paragraph were supplied by the HR Departments of the entities in the reporting scope and by the person in charge of Personnel Reporting and were coordinated by the Group Human Resources Department.
  • Environmental information comes from the departments responsible, within the reporting scope, for general resources, as well as from the Group Human Resources (travel and vehicle policy) and Group Purchasing (vehicle policy) Departments.
Reporting period

Unless stated otherwise, all figures refer to financial year 2022, corresponding to calendar year 2022.

Comparable data, on a like-for-like basis, is sometimes presented for previous years for purposes of comparison.

Reporting scope

The information presented in this document was produced for the first time for financial year 2014, and the figures contained therein concerned the French scope, with an illustration of the policies, processes, tools, initiatives and actions at Group level.

Since 2014, the Group extended its reporting scope with each new reporting year until 2020, as presented in the table below.

Financial year

Reporting scope

Information regarding the scope added

Scope representativeness with regard to the Group’s workforce

Scope representativeness with regard to the Group’s turnover

2014

France

The French scope concerns (i) COFACE SA and (ii) its subsidiary, Compagnie française d’assurance pour le commerce extérieur (iii) excluding its second subsidiary, Coface Re, which is not registered in France and has a total workforce of 11 employees based in Switzerland.

24%

20%

2015

France and Germany

The German scope concerns the three German companies, Coface Finanz GmbH, Coface Rating GmbH and Coface Debitorenmanagement GmbH, as well as the German branch of Compagnie française d’assurance pour le commerce extérieur.

40%

36%

2016

France, Germany and Italy

Italy includes the insurance branch of Compagnie française d’assurance pour le commerce extérieur and a service company devoted to debt collection operations, Coface Italia SRL.

43%

43%

2017*

France, Germany, Italy and Spain

Spain includes the insurance branch and a service entity, Coface Servicios España.

42%

53%

2018

France, Germany, Italy, Spain and the UK

The UK includes the insurance branch of Compagnie française d’assurance pour le commerce extérieur, Coface UK Holdings Ltd and a service entity, Coface UK Services Ltd.

43%

56%

2019

France, Germany, Italy, Spain, UK and Poland

Poland includes the insurance branch of Compagnie française d’assurance pour le commerce extérieur, two service entities, Coface Poland Insurance Services and Coface Poland CMS, as well as a factoring company, Coface Poland Factoring.

47%

59%

2020

France, Germany, Italy, Spain, United Kingdom, Poland, Morocco, Netherlands, Austria, Romania and United States

  • Morocco includes the insurance subsidiary of Compagnie française d’assurance pour le commerce extérieur, Coface Maroc SA and a service subsidiary, Coface Services Maghreb.
  • The Netherlands includes the insurance branch of Compagnie française d’assurance pour le commerce extérieur, Coface Netherland Branch and a service entity, Coface Nederland Services BV.
  • Austria includes the insurance branch of Compagnie française d’assurance pour le commerce extérieur, Coface Niederlassung Austria, the holding company, Coface Central Europe Holding GmbH and the service entity, Coface Austria Kreditversicherung Service GmbH.
  • Romania includes the insurance branch of Compagnie française d’assurance pour le commerce extérieur, Coface Sucursala Bucuresti and two service entities, Coface Romania Insurance Services and Coface Romania CMS.
  • The United States comprises two insurance subsidiaries of Compagnie française d’assurance pour le commerce extérieur, Coface North America Inc. and Coface North America Insurance Company, the holding company, Coface North America Holding Company and the service subsidiary, Coface Services North America Inc.

62%

73%

2021


Same scope as 2020

63%

72%

2022


Responsible employer (social reporting)

100%

100%


Environmental reporting: Same scope as 2021

63%

71%

*    Although the reporting scope was significantly extended in 2017, its representativeness as regards the workforce decreased due to a reduction in the workforce in France. This decrease was due largely to the transfer of the State guarantees management business to Bpifrance Assurance Export on January 1, 2017, which resulted in 249 departures.

Methodological details on the information communicated
A responsible employer
  • Social indicators cover the entire Group, broken down by region. As mentioned above, the description of policies, processes and HR tools are defined at Group level unless otherwise noted.
  • All figures concerning the workforce, contract type, nationality, age and diversity were obtained from the new Group HRD tool, My HR Place, an online internal tool.
  • The workforce is calculated taking into account employees on permanent contracts or fixed-term contracts (including “leaves of absence” and expatriates) still present at the company on the evening of December 31.
  • “Leaves of absence” concern employees on permanent or fixed-term contracts whose contract has been suspended for a short period for one of the following four reasons (paid or not): parental leave, long-term illness (over 3 months), assignment (ex. Coface), or other long-term inactivity.
  • Expatriates are counted in the country in which they work.
  • The following are excluded: employees on permanent and non-permanent contracts whose contract has been suspended for a long period, for one of the following two reasons (paid or not): garden leave, i.e. notice not given and early retirement, as well as apprentices or individuals on work-study programmes, external auditors, external sales agents, temporary workers, interns and subcontractors.
  • The “percentage of women managers” indicator takes into account, among COFACE SA workforce at December 31 of the current year, the percentage of women at Coface, being monitored by gender in the HR report, among employees with a permanent or non-permanent contract. The number of women in managerial positions is determined by comparing the number of women in managerial positions in COFACE SA workforce (numerator) with the total number of employees in managerial positions (denominator).
  • The following employees must be counted as managers, according to the “Hierarchical level” in My HR Place:
    • senior managers;
    • middle managers;
    • first line managers,
  • The Group Gender Index is made up of all Coface entities, grouped into seven regions: APR, CER, LAR, MAR, NAR, NER, WER + HQ.
    • Members of the Executive Committee (except for criterion 4) and Coface Re and BDC, which belong to very specific markets, are excluded from the scope of the analysis.
    • For criteria 1 and 5, the analysis is carried out based on the annual basic salary?
    • The Group index is calculated based on data from each regional index, weighted by the workforce of each region at the Group (for criteria 1, 2 and 3 only).
    • Criteria 4 and 5 are calculated on a Group consolidated basis.
/Environmental responsibility


Reporting scope

Comment

Electricity consumption (KWh)

Gas consumption (KWh)

Petrol consumption
 (L)

Diesel consumption
 (L)

Train travel

Air
 travel

France

Registered office (Bois-Colombes) and offices in Lyon, Strasbourg, Nantes and Toulouse. Lille and Marseille are excluded (service provision)

For all offices at head office and in the regions, only the head office uses gas.

Germany

Mainz (main office) and offices in Hamburg, Berlin, Hanover, Nuremberg, Düsseldorf, Bielefeld, Cologne, Stuttgart, Munich and Ettlingen

Coface Germany does not use gas. For its electricity consumption, the contract provides for 100% renewable resources. For rail travel, the Deutsche Bahn contract, which is more expensive, provides for the 100% offsetting of emissions.

N/A

Italy

Milan (main office) and 1 office in Rome


Spain

Madrid (main office) and offices in San Sebastián, Alicante, Valencia, Seville, Pamplona, Barcelona and A Coruña.

Coface Spain does not use gas.

N/A

United Kingdom

London (main office) and offices in Watford, Birmingham and Manchester.

Part of the distance travelled by train and plane in the UK is not reported because some of the staff do not use the services of the dedicated travel agent.

Poland

Warsaw (main office) and offices in Krakow, Gdynia, Katowice and Poznan.

Coface Poland does not use gas.

N/A

Netherlands

Breda (main office)

Coface Netherlands does not consume gas. For travel, the country does not have a reporting system for train travel in terms of mileage.

N/A

Austria

Vienna (main office) and 1 office in Graz.

Coface Austria does not use gas.

N/A

Romania

Bucharest (main office) and 2 offices in Cluj and Timisoara.

Timisoara (shared offices: ex. reporting).

Morocco

Casablanca (main office)

The country does not use train travel and mileage for air travel is not available.

N/A

United States

Princeton (main office) and offices in Boston (closed in November 2020), Hunt Valley, Oak Brook (opened in April 2020), Miami, Shenandoah, Franklin, New York and California.

As no vehicles are leased or owned, the information is not available. Only the California office reported gas use.

N/A

N/A

Selected emissions factors
  • Greenhouse gas emissions (electricity and gas mix, diesel, petrol, train and plane) were calculated on the basis of the CO2 emission factors or equivalent available in the ADEME Carbon Base®, when the data were present.
  • In the ADEME Carbon Base®, the emissions factor identification is 25774 for diesel, 25763 for petrol and 15312 for natural gas.
  • For France, under the assumption that journeys are mainly between two major cities in France, the train emission factor chosen in the ADEME Carbon Base is that of TGV high-speed trains, with identification 28145.
  • The air emission factor was calculated by taking the average of the three emission factors: short, medium and long haul without contrail.
  • Where the data were not included in the ADEME Carbon Base®, an Ecoinvent® base emission factor was used:
    • for train travel in Romania and Poland, a European conversion factor (Ecoinvent® Base) was applied,
    • for the United States and Morocco, a global conversion factor (Ecoinvent® Base) was used.
Methodological details
  • The electricity consumption table contains estimates for the United Kingdom (Manchester office only), Poland, Romania, the Netherlands and the United States (Hunt Valley only), as December invoices were not available at the time of Chapter approval.
  • The gas consumption table contains estimates for Romania because the December invoice was not available when the chapter was approved.
  • The estimates were made using a common methodology of taking the actual and total consumption from January to November 2021, dividing it by 11 and multiplying it by 12. This methodology appears to be the simplest, since there is no major difference in consumption between summer (air conditioning) and winter (heating).
  • The fuel consumption table contains estimates for France because the reporting of one of the leasing agencies was not available for December, when the chapter was approved. For this estimate, a different methodology was applied (estimated over the last three months) due to the switchover of the fleet to another manager during the year.
  • Reported fuel consumption corresponds to the consumption of company vehicle fleets for long-term leasing. No country in the scope owns vehicles.

As the Company’s activity has a limited impact on the areas listed below, they have not been, or are no longer, covered:

  • paper consumption;
  • tackling food waste;
  • combating food insecurity;
  • respect for animal welfare;
  • responsible, fair and sustainable food; and
  • the circular economy.

6.8.Report of one of the Statutory Auditors, appointed as independent third party, on the verification of the consolidated non-financial performance statement

Year ended December 31, 2022

This is a free English translation of the report by one of the Statutory Auditors issued in French and is provided solely for the convenience of English-speaking readers. This report should be read in conjunction with, and construed in accordance with, French law and professional standards applicable in France.

To the Shareholders’ Meeting,

In our capacity as Statutory Auditor of Coface SA (hereinafter the “Company”), appointed as independent third party (“third party”) and accredited by the French Accreditation Committee (Cofrac), under number 3-1886 (Cofrac Inspection Accreditation, scope available at www.cofrac.fr), we have conducted procedures to express a limited assurance conclusion on the historical information (observed or extrapolated) in the consolidated non-financial performance statement, prepared in accordance with the Company’s procedures (hereinafter the “Guidelines”), for the year ended December 31, 2022 (hereinafter the “Information” and the “Statement”, respectively), presented in the Group management report pursuant to the legal and regulatory provisions of Articles L. 225-102-1, R. 225-105 and R. 225-105-1 of the French Commercial Code (code de commerce).

Conclusion

Based on our procedures as described in the section “Nature and scope of procedures” and the evidence we have obtained, no material misstatements have come to our attention that cause us to believe that the non-financial performance statement does not comply with the applicable regulatory provisions and that the Information, taken as a whole, is not fairly presented in accordance with the Guidelines.

Comments

Without qualifying the conclusion expressed above and in accordance with Article A. 225-3 of the French Commercial Code, we make the following comments:

  • Information related to ESG integration and the carbon footprint of investment portfolios are provided by the mandated management company.
  • The policy and the indicator related to “ESG assets covered by the Single Risk activity” are defined but the ESG qualification criteria for this activity as well as the formalization of the related controls remain to be reinforced.
  • As specified in the methodological note presented in chapter “6.6.2 General organization of reporting” the scope of reporting of environmental indicators covers 63% of the workforce for the 2022 financial year.
Preparation of the non-financial performance statement

The absence of a generally accepted and commonly used reference framework or established practices on which to base the assessment and measurement of the Information enables the use of different but acceptable measurement techniques that may impact comparability between entities and over time.

Accordingly, the Information must be read and interpreted with reference to the Guidelines, summarised in the Statement and available on the Company’s website or on request from its headquarters.

Limits inherent in the preparation of the information relating to the Statement

The Information may be subject to uncertainty inherent to the state of scientific and economic knowledge and the quality of external data used. Some information is sensitive to the choice of methodology and the assumptions or estimates used for its preparation and presented in the Statement, especially in the chapter “6.6.2 General Organization of reporting”.

Responsibility of the Company

Management is responsible for:

  • selecting or determining the appropriate criteria for the preparation of the Information;
  • preparing a Statement pursuant to legal and regulatory provisions, including a presentation of the business model, a description of the main non-financial risks, a presentation of the policies implemented with respect to these risks as well as the outcomes of these policies, including key performance indicators and the information set-out in Article 8 of Regulation (EU) 2020/852 (Green taxonomy);
  • implementing such internal control as it determines is necessary to enable the preparation of Information that is free from material misstatement, whether due to fraud or error.

The Statement has been prepared by applying the Company’s Guidelines as referred to above.

Responsibility of the Statutory Auditor appointed as independent third party

Based on our work, our responsibility is to express a limited assurance conclusion on:

  • the compliance of the Statement with the requirements of Article R. 225-105 of the French Commercial Code;
  • the fairness of the information provided pursuant to part 3 of sections I and II of Article R. 225-105 of the French Commercial Code, i.e. the outcomes of policies, including key performance indicators, and measures relating to the main risks, hereinafter the “Information.”

As it is our responsibility to issue an independent conclusion on the information prepared by management, we are not authorised to participate in the preparation of the Information, as this could compromise our independence.

It is not our responsibility to provide a conclusion on:

  • the Company’s compliance with other applicable legal and regulatory provisions (particularly with regard to the information set-out in Article 8 of Regulation (EU) 2020/852 (Green taxonomy), the duty of vigilance and the fight against corruption and tax evasion);
  • the fairness of information set-out in Article 8 of Regulation (EU) 2020/852 (Green taxonomy);
  • the compliance of products and services with the applicable regulations.
Applicable regulatory provisions and professional guidance

We performed the work described below in accordance with our audit verification programme in application of Articles A. 225-1 et seq. of the French Commercial Code, the professional guidance issued by the French Institute of Statutory Auditors (Compagnie Nationale des Commissaires aux Comptes) relating to this engagement and with the international standard ISAE 3000 (revised - Assurance engagements other than audits or reviews of historical financial information).

Independence and quality control

Our independence is defined by Article L. 822-11-3 of the French Commercial Code and French Code of Ethics for Statutory Auditors (Code de déontologie). In addition, we have implemented a system of quality control including documented policies and procedures aimed at ensuring compliance with applicable legal and regulatory requirements, ethical requirements and the professional guidance issued by the French Institute of Statutory Auditors (Compagnie Nationale des Commissaires aux Comptes) relating to this engagement.

Means and resources

Our work engaged the skills of three people between December 2022 and March 2023 and took a total of four weeks.

To assist us in conducting our work, we referred to our corporate social responsibility and sustainable development experts. We conducted around ten interviews with people responsible for preparing the Statement.

This work involved the use of information and communication technologies allowing the work and interviews to be carried out remotely, without hindering the good execution of the verification process.

Nature and scope of procedures

We planned and performed our work taking account of the risk of material misstatement of the Information.

We consider that the procedures conducted in exercising our professional judgement enable us to express a limited assurance conclusion:

  • We familiarized ourselves with the activities of all companies in the consolidation scope and the description of the principal risks.
  • We assessed the suitability of the Guidelines with respect to their relevance, completeness, reliability, neutrality and clarity, taking into account, where appropriate, best practices within the sector.
  • We verified that the Statement covers each category of information stipulated in section III of Article L. 225-102-1 governing social and environmental affairs.
  • We verified that the Statement provides the information required under Article R.225-105 II of the French Commercial Code where relevant with respect to the principal risks, and includes, where applicable, an explanation for the absence of the information required under Article L.225-102-1 III, paragraph 2 of the French Commercial Code.
  • We verified that the Statement presents the business model and a description of the principal risks associated with the activities of all the consolidated entities, including where relevant and proportionate, the risks associated with their business relationships, their products or services, as well as their policies, measures and the outcomes thereof, including key performance indicators associated to the principal risks.
  • We referred to documentary sources and conducted interviews to:
    • assess the process used to identify and confirm the principal risks as well as the consistency of the outcomes, including the key performance indicators used, with respect to the principal risks and the policies presented; and
    • corroborate the qualitative information (measures and outcomes) that we considered to be the most important(1). For certain risks(2), our work was carried out on the consolidating entity, while for other risks, our work was carried out on the consolidating entity and on a selection of entities.
  • We verified that the Statement covers the consolidated scope, i.e. all companies within the consolidation scope in accordance with Article L. 233-16, with the limits specified in the Statement.
  • We obtained an understanding of internal control and risk management procedures implemented by the Company and assessed the data collection process aimed at ensuring the completeness and fairness of the Information.
  • For the key performance indicators and other quantitative outcomes(3), that we considered to be the most important, we implemented:
    • analytical procedures that consisted in verifying the correct consolidation of collected data as well as the consistency of changes thereto;
    • substantive tests, on a sample basis and using other selection methods, that consisted in verifying the proper application of definitions and procedures and reconciling data with supporting documents. These procedures were conducted for a selection of contributing entities(4) and covered between 19% and 47% of the consolidated data selected for these tests.
  • We assessed the overall consistency of the Statement in relation to our knowledge of the consolidation scope.

The procedures conducted in a limited assurance review are substantially less in scope than those required to issue a reasonable assurance opinion in accordance with the professional guidelines of the French National Institute of Statutory Auditors (Compagnie Nationale des Commissaires aux Comptes); a higher level of assurance would have required us to carry out more extensive procedures.

Paris-La Défense, April 5, 2023

One of the Statutory Auditors, 

Deloitte & Associé

Jérôme Lemierre

Partner, Audit

Julien Rivals

Partner, Sustainability Services

150,179,792 shares 
making up the share capital

0.74% 
TREASURY STOCK

0.81% 
Employees' share in the capital

crossing 
of threshold

stock market profile 
& SHARE PRICE EVOLUTION

(1)
Coverage rate: for each insured client, the ratio of guarantee amounts granted to requested guarantee amounts.
(2)
https://en.wikipedia.org/wiki/Democracy_Index
(3)
The benchmark portfolio is composed as follows: 85% ML EURO BROAD +10% MSCI EMU +5% THE BOFA ML GLOBAL HY.
(4)
For Senior Managers (or the “Top 200”), Coface considers the professionals of the Regional Management Committees, all country heads, whether or not they are members of a regional management committee, the Group Executive Committee, Group Directors reporting directly to them or N-2 Managers responsible for a scope with a high overall impact and with a high degree of autonomy.
(5)
For Senior Managers (or the “Top 200”), Coface considers the professionals of the Regional Management Committees, all country heads, whether or not they are members of a regional management committee, the Group Executive Committee, Group Directors reporting directly to them or N-2 Managers responsible for a scope with a high overall impact and with a high degree of autonomy.
(6)
“Best talent” here means high-potential individuals, employees with critical expertise for Coface’s success and adaptable professionals able to take on international responsibilities.
(7)
Definition of “high potential”: (i) Senior Manager with the ability to join the Group Executive Committee (regardless of the time scale); (ii) For other levels: employee with the ability to become a Senior Manager (regardless of the time scale).
(8)
Selected qualitative information: Service quality improvement program; Commercial exclusion policy; Controls implemented by Coface on the data provided by the mandated management company; Policy put in place to achieve the target of 40% women among Senior Management; “Talent” component of the Human Resources strategy; “Short term assignment” policies and international mobility; Carbon footprint methodology carried out by a specialized firm
(9)
Risks: Non-Satisfaction of customers and partners; Lack of integration of CSR into commercial policy; Investment in assets that are not responsible from an environmental, governance or social point of view; lack of attractiveness for Talents (recruitment and retention: development, integration of new arrivals, etc.).
(10)
Social indicators: Workforce by gender and by type of contract; percentage of women among employees, manager and Senior Managers; turnover rate of employees identified as high potential; number of internationally mobile employees. Environmental indicators: CO2 emissions related to the consumption of electricity, gas, fuel and travel by train and plane.Societal Indicators: Single Risk ESG projects; Response rate to monthly barometric surveys
(11)
COFACE France, COFACE Maroc

7. SHARE CAPITAL AND OWNERSHIP STRUCTURE

7.1General information concerning the capital of COFACE SA

7.1.1Share capital subscribed and share capital authorised but not issued

At the date of this Universal Registration Document, the Company’s share capital totalled €300,359,584.It is divided into 150,179,792 shares with a par value of €2 (two euros), fully subscribed and paid up, all of the same category.

In accordance with Article L.225-37-4, paragraph 3 of the French Commercial Code, the authorisations valid at December 31, 2022 are presented in the summary table below.They were granted by the General Shareholders’ Meeting to the Board of Directors in respect of capital increases pursuant to Articles L.225-129-1 and L.225-129-2 of the French Commercial Code.

The table below summarises the resolutions voted on during the Combined Shareholders’ Meeting of the Company dated May 17, 2022, as concerns capital increases.

Resolution

Subject of the resolution


Maximum face value

Term of authorisation

Amount used at Dec. 31, 2022

Combined Shareholders’ Meeting of the Company of May 17, 2022

17th

Delegation of authority to the Board of Directors to increase the share capital by incorporating reserves, profits or premiums, or any other sum that can be legally capitalised (1)


€75 million

26 months

No

18th

Delegation of authority to the Board of Directors to increase the share capital by issuing shares, with preferential subscription rights, and/or equity securities which confer entitlement to other equity securities and/or entitlement to the allocation of debt securities and/or transferable securities giving access to equity securities to be issued (1) (3)


Capital increases: €115 million (1)

Issues of debt securities: €500 million (3)

26 months

No

19th

Delegation of authority to the Board of Directors to increase the share capital by issuing, without preferential subscription rights, shares and/or equity securities which confer entitlement to other equity securities and/or entitlement to the allocation of debt securities and/or transferable securities giving access to equity securities to be issued, through public offers other than those specified in (1) of Article L.411-2 of the French Monetary and Financial Code (1) (2) (3)


€29 million for capital increases (1) (2)

€500 million for debt securities (3)

26 months

No

20th

Delegation of authority to the Board of Directors to increase the share capital by issuing, without preferential subscription rights, shares and/or equity securities which confer entitlement to other equity securities and/or entitlement to the allocation of debt securities and/or transferable securities giving access to equity securities to be issued, through the public offers specified in Section I of Article L.411-2 of the French Monetary and Financial Code (1) (2) (3)


€29 million for capital increases (1) (2)

€500 million for debt securities (3)

26 months

No

21st

Delegation of authority to the Board of Directors to increase the share capital by issuing shares and/or equity securities which confer entitlement to other equity securities and/or entitlement to the allocation of debt securities and/or transferable securities giving access to equity securities to be issued as compensation for contributions in kind (1) (2) (3)


€29 million for capital increases (1) (2)

€500 million for debt securities (3)

26 months

No

22nd

Delegation of authority to the Board of Directors to increase the share capital by issuing shares of the Company, without preferential subscription rights, reserved for members of a company savings plan (1)


€3,200,000 (1)

26 months

No

23rd

Delegation of authority to the Board of Directors to increase the share capital by issuing shares without preferential subscription rights for a specific category of beneficiaries (1)


€3,200,000 (1)

18 months

No

  • The maximum overall face value of the capital increases likely to be made under this delegation is included in the total cap set at €115 million for immediate and/or future capital increases.
  • The overall face value of the capital increases likely to be made under this delegation is included in the nominal cap of €29 million for capital increases without preferential subscription rights.
  • The maximum overall face value of the issues of debt securities likely to be made under this delegation is included in the total cap set at €500 million for issues of debt securities.

7.1.2Shares not representing capital

None.

7.1.3Own shares and the acquisition of treasury shares by the Company

Description of the 2022-2023 Share Buyback Programme
Introduction

It is recalled that the Combined Shareholders’ Meeting of May 12, 2021, in its seventeenth (17th) resolution, authorised the Board of Directors to trade in the shares of COFACE SA (the Company) under the 2021-2022 Share Buyback Programme.The main features of this authorisation were set out in the description published on the Company’s website and in the 2021 Universal Registration Document.

The Company, listed on Euronext Paris – Compartment A – wishes to continue with its Share Buyback Programme (the Programme), in accordance with the applicable regulation (see “Legal Framework” below).

To this end, the Combined Shareholders’ Meeting of May 17, 2022 again authorised, in its eighth (8th) resolution, the Board of Directors, which may in turn delegate this authority, under the legal and regulatory conditions, to implement a new Programme concerning the Company’s shares (ISIN FR0010667147).This Programme would replace the existing programme set up by the Combined Shareholders’ Meeting of May 12, 2021.

Main features of the 2022-2023 Buyback Programme
Date of the Shareholders’ Meeting that authorised the Programme

The Combined Shareholders’ Meeting of May 17, 2022 authorised the 2022-2023 Programme in its eighth (8th) resolution.

The Board of Directors’ meeting of July 28, 2022, pursuant to the authority granted to it by the Combined Shareholders’ Meeting of May 17, 2022, in its eighth (8th) resolution, authorised COFACE SA, which may in turn delegate this authority to the Chief Executive Officer, to trade the Company’s shares through the “2022-2023 Share Buyback Programme”.The main features are described below.

Breakdown by objective of equity securities held as of December 31, 2022

At December 31, 2022, COFACE SA held 0.74% of its own share capital, representing 1,116,118 ordinary shares.On that date, the number of shares held could be broken down by objective as follows:

Objectives

Number of shares held

a)

Ensure liquidity and boost the market for the Company’s stock through an investment service provider acting independently under a liquidity agreement, in compliance with the charter of ethics recognised by the Autorité des Marchés Financiers (French Financial Markets Authority, AMF);

110,437

b)

Allocate shares to Company employees, and in particular as part of:

  • employee profit-sharing schemes,
  • any Company stock option plan, pursuant to the provisions of Article L.225-177 et seq. and L.22-10-56 of the French Commercial Code,
  • any savings plan in accordance with Article L.3331-1 et seq. of the French Labour Code,
  • any bonus share allocation under the provisions of Articles L.225-197-1 et seq. and L.22-10-59 et seq of the French Commercial Code; additionally, perform all hedging operations relating to these transactions, under the conditions provided for by the market authorities and at the times to be determined by the Board of Directors or the person acting by delegation of the Board of Directors;

0

0


0

1,005,681

e)

Cancel all or part of the stock thus purchased.

0

TOTAL


1,116,118

Objectives of the 2022-2023 Share Buyback Programme

The Company’s shares may be purchased and sold, by decision of the Board of Directors, in order to:

Authorised objectives

a)

Ensure liquidity and boost the market for the Company’s stock through an investment service provider acting independently under a liquidity agreement, in compliance with the market practice accepted by the AMF on June 22, 2021;

b)

Allocate shares to corporate officers and to employees of the Company and other Group entities, in particular as part of:

(i) employee profit-sharing schemes,

(ii) any Company stock option plan, pursuant to the provisions of Article L.225-177 et seq. and L.22-10-56 of the French Commercial Code,

(iii) any savings plan in accordance with Article L.3331-1 et seq. of the French Labour Code,

(iv) any bonus share allocation under the provisions of Articles L.225-197-1 et seq. and L. 22-10-59 et seq of the French Commercial Code; additionally, perform all hedge operations relating to these transactions, under the conditions provided for by the market authorities and at the times to be determined by the Board of Directors or the person acting by delegation of the Board of Directors;

c)

Transfer the Company’s shares upon exercise of the rights attached to securities entitling their bearers, directly or indirectly, through reimbursement, conversion, exchange, presentation of a warrant or in any other manner, to the allocation of the Company’s shares pursuant to current regulations; additionally, perform all hedge operations relating to these transactions, under the conditions provided for by the market authorities and at the times to be determined by the Board of Directors or the person acting by delegation of the Board of Directors;

d)

Keep the Company’s shares and subsequently remit them in payment or exchange in connection with any acquisition, merger, demerger or tender operations;

e)

Cancel all or part of the stock thus purchased;

f)

Implement all market practices accepted by the AMF and, more generally, execute all transactions in compliance with current regulations, in particular, the provisions of (EU) Regulation No. 596/2014 of the European Parliament and of the Council of April 16, 2014 on market abuse (market abuse regulation).

Maximum share of the capital, maximum number, maximum purchase price and characteristics of the securities that COFACE SA may acquire
Securities concerned

The Company’s ordinary shares listed for trading on Euronext Paris:

Market profile


Trading

Euronext Paris (Compartment A), eligible for deferred settlement service (SRD)

ISIN

FR0010667147

Reuters code

COFA PA

Bloomberg code

COFA FP

Stock market indexes

SBF 120, CAC All Shares, CAC All-Tradable, CAC Financials, CAC Mid & Small, CAC MID 60, Next 150

Maximum share of the capital

The Board of Directors may authorise, with the power to further delegate under the applicable legal and regulatory conditions, in compliance with the provisions of Articles L.22-10-62 et seq and L.225-10 et seq. of the French Commercial Code, the purchase or the issuing of instructions to purchase, in one or more instances and at the times to be determined by it, of a number of the Company’s shares that may not exceed:

  • 10% of the total number of shares composing the share capital at any time whatsoever, or
  • 5% of the total number of shares composing the share capital, if they are shares acquired by the Company with a view to keeping them and transferring them as payment or exchange in connection with a merger, spin-off or asset contribution.

These percentages apply to a number of shares adjusted, where appropriate, according to the operations that could impact the share capital subsequent to the Shareholders’ Meeting of May 17, 2022.

Maximum number

As required by law, COFACE SA undertakes not to exceed the holding limit of 10% of its capital; as an indication, this corresponds to 15,017,979 shares at December 31, 2022.

Maximum purchase price

In accordance with the eighth (8th) resolution proposed and accepted by the Combined Shareholders’ Meeting of May 17, 2022, the maximum purchase price per unit cannot exceed €15 per share, excluding costs.

However, the Board of Directors may, in the event of transactions involving the Company’s capital, for example:

  • a change in the par value of the share,
  • a capital increase through the incorporation of reserves followed by the creation and free allocation of shares for stock splits or reverse stock splits,

adjust the aforementioned maximum purchase price to take into account the impact of these transactions on the value of the Company’s share.

Other information

The acquisition, disposal or transfer of these shares may be completed and paid for by any methods authorised by the current regulations, on a regulated market, multilateral trading system, systematic internaliser or over the counter, in particular through the acquisition or disposal of blocks of shares, using options or other derivative financial instruments or warrants or, more generally, securities entitling their bearers to shares of the Company, at the times that the Board of Directors will determine.

Unless it has the prior authorisation of the Shareholders’ Meeting, the Board of Directors may not use this delegation of authority once a third party has filed a public offer for the Company’s shares, and until the end of the offer period.

Duration of the Share Buyback Programme

In accordance with the eighth (8th) resolution proposed and accepted by the Combined Shareholders’ Meeting of May 17, 2022, this Programme will have a maximum duration of eighteen (18) months from the date of the meeting.It may therefore be implemented until November 8, 2023 (inclusive) or until the date of its renewal by a general meeting of shareholders taking place before that date.

This authorisation ends the authorisation granted by the seventeenth (17th) resolution adopted by the Shareholders’ Meeting of May 12, 2021.

Liquidity agreement

The liquidity agreement with Natixis dated July 2, 2014 was transferred as of July 2, 2018 to ODDO BHF (for a term of twelve (12) months, automatically renewable).To implement the agreement, ODDO BHF was provided with the following resources, which were allocated to the liquidity account on the settlement date of June 29, 2018: 76,542 COFACE SA shares – €2,161,049.81.

Under this agreement, in financial year 2022 the Company purchased 3,071,539 treasury shares and sold 3,045,543 treasury shares.At December 31, 2022, the following were recorded in the liquidity account: 110,437 COFACE SA shares and €2,519,131.10.

The table below shows the changes in share purchases and sales in 2022:

Date

Liquidity agreement

Number of shares purchased

Average purchase price

(in €)

Number of
 shares sold

Average sale 
price

(in €)

Total

Jan. 31, 2022

248,433

€11.68

207,643

€11.87

125,231

Feb. 28, 2022

240,281

€12.06

264,169

€12.20

101,343

Mar. 31, 2022

322,652

€10.23

273,096

€10.27

150,899

Apr. 30, 2022

222,681

€11.18

227,678

€11.25

145,902

May 31, 2022

177,174

€11.40

180,203

€11.63

142,873

Jun. 30, 2022

295,662

€10.43

230,863

€10.46

207,672

Jul. 31, 2022

270,787

€9.90

272,091

€9.97

206,368

Aug. 31, 2022

226,221

€10.34

228,676

€10.37

203,913

Sep. 30, 2022

343,085

€10.03

324,028

€10.08

222,970

Oct. 31, 2022

255,384

€10.66

351,646

€10.69

126,708

Nov. 30, 2022

233,061

€11.27

281,702

€11.34

78,067

Dec. 31, 2022

236,118

€11.87

203,748

€11.91

110,437

Total

3,071,539

€10.84

3,045,543

€10.93


Treasury share transactions

In financial year 2022, the Company bought 300,000 treasury shares, corresponding to 0.20% of its share capital.A share purchase mandate for 2022 was entered into with:

  • BNP Paribas Exane, to buy 300,000 shares for allocation under the bonus share allocation plan (Long Term Incentive Plan (LTIP)) – see Section 2.3.1 “Compensation policy”.

In 2022, the total amount of transaction fees for the share buyback was €3,125.21 for BNP Paribas Exane.

The history of bonus share allocations under the LTIPs put in place by the Company is given in Section 2.3.12.

The table below shows the change in treasury share purchase mandates:

Share Buyback Programme

Treasury share purchase mandate

Number of shares purchased

Average purchase price

(in €)

Total

(in €)

Yes/No

Service provider

Date

2018-2019

Yes

Kepler Cheuvreux

i) Feb. 16, 2018 to Oct. 15, 2018

ii) Aug. 6, 2018 to Aug. 15, 2018

iii) May 8, 2019 to Jun. 11, 2019

3,348,971

358,702

400,000

8.96

7.96

8.69

29,999,996.03

2,853,559.17

3,474,280.75


Yes

BNP Paribas Exane

iii) Oct. 26, 2018 to Jan. 8, 2019

1,867,312 (1)

8.03

14,999,994.75

2019-2020

Yes

Kepler Cheuvreux

Feb. 26, 2020 to Mar. 12, 2020

500,000

9.26

4,631,955.03

2020-2021

Yes

Kepler Cheuvreux

Oct. 27, 2020 to Jan. 29, 2021

1,852,157 (2)

8.10

14,999,999.32

2021-2022

No

N/A

N/A

-

-

-

2022-2023

Yes

BNP Paribas Exane

Sep. 13, 2022 to Nov. 15, 2022

300,000

10.42

3,125,178.43

  • 1,708,735 shares had been purchased at €8.04 at December 31, 2018.158,577 additional shares at €7.97 had been purchased when the mandate ended (January 8, 2019).
  • 1,110,677 shares had been purchased at €7.76 at December 31, 2020.741,480 additional shares had been purchased at €8.61 when the mandate ended (January 29, 2021).

The table below shows the change in treasury share distributions:

Plan

LTIP*

2019

2020

2021

2022

Chief Executive Officer

70,000

75,000

75,000

75,000

Executive Committee

151,917

139,612

187,105

147,901

Other beneficiaries

150,351

97,588

146,298

97,948

Total number of free shares awarded

372,268

312,200

408,403

320,849

Performance shares (1)

28,520

28,109

46,700

84,256

Overall available shares

434,055

347,841

467,754

425,966

  • Non-allocated shares

33,267

7,532

12,651

20,861

Authorisation to award free shares


Date of Shareholders’ Meeting

May 16, 2018

May 16, 2018

May 16, 2018

May 12, 2021

Date of Board of Directors’ meeting (authorisation)

Feb. 11, 2019

Feb. 5, 2020

Feb. 10, 2021

Feb. 15, 2022

Award date

Feb. 11, 2019

Feb. 5, 2020

Feb. 10, 2021

Feb. 15, 2022

Share vesting date

Feb. 14, 2022

Feb. 6, 2023

Feb. 12, 2024

Feb. 15, 2025

End date of retention period (availability)

N/A

N/A

N/A

N/A

Shares vested and to be held (Chief Executive Officer)

N/A

N/A

N/A

N/A

Share awards (or performance units) cancelled

N/A

N/A

N/A

N/A

Share Buyback Programme


Date of Shareholders’ Meeting

May 16, 2019

May 14, 2020

May 12, 2021

May 17, 2022

Date of Board of Directors’ meeting (authorisation)

Jul. 25, 2019

Jul. 29, 2020

Jul. 28, 2021

Jul. 28, 2022

Date of purchase mandate

May 8, 2019

Feb. 26, 2020


Jul. 28, 2022

Number of shares

400,000

500,000


300,000

* The amounts indicated do not take into account the shares cancelled individually for plans vesting after December 31, 2022 (LTIP 2020 and following)

  • The Company awards performance units instead of bonus shares if the arrangement of bonus share awards is complex or impossible with regard to the applicable legislation in the beneficiary country.These units are indexed on the share price and subject to the same presence and performance conditions as the bonus shares, but are valued and paid in cash at the end of the vesting period.
Treasury shares – Summary

The Shareholders’ Meeting authorised the 2022-2023 share buyback programme on May 17, 2022.Its implementation was decided by the Board of Directors on July 28, 2022.

Treasury shares represented a total of 0.74% of the Company’s capital, i.e., 1,116,118 shares at December 31, 2022, versus 1,147,510 shares at December 31, 2021.The aggregate nominal value of these shares was €2,232,236 (the share has a par value of €2 – see Section 7.1.8 “History of capital”).

Date

Total Liquidity Agreement

Total LTIP

Buyback (cancellation)

Total treasury shares

Total shares

% of total shares comprising the share capital*

Voting rights

Dec. 31, 2022

110,437

1,005,681

0

1,116,118

0.74%

149,063,674

* Number of shares = 150,179,792.

7.1.4Other instruments giving access to capital

None.

7.1.5Conditions governing any right of acquisition and/or any obligation attached to shares that are subscribed, but not paid up

None.

7.1.6Share capital of any company in the Group that is under option or subject to an agreement to place it under option

None.

7.1.7Pledge, guarantees and sureties granted on the Company’s share capital

To our knowledge, at the date of this Universal Registration Document, the shares comprising the Company’s capital are not subject to any pledges, guarantees or sureties.

7.1.8History of capital

The Company’s share capital has changed as follows over the last five years:

  • in 2018, the share capital was reduced to €307,798,522 divided into 153,899,261 shares with a par value of €2 each.This resulted from the cancellation of 3,348,971 shares purchased under the Share Buyback Programme of February 12, 2018;
  • in 2019, the share capital was reduced to €304,063,898, divided into 152,031,949 shares with a par value of €2 each.This resulted from the cancellation of 1,867,312 shares purchased under the share buyback programme of October 25, 2018;
  • in 2020, the share capital was unchanged;
  • in 2021, the share capital was reduced to €300,359,584 divided into 150,179,792 shares with a par value of €2 each.This resulted from the cancellation of 1,852,157 shares purchased under the Share Buyback Programme of October 26, 2020;
  • in 2022, the share capital was unchanged.

7.1.9Transactions carried out by persons with executive responsibilities in 2022

In accordance with Article 223-26 of the AMF General Regulation, the following transactions referred to in Article L. 621-18-2 of the French Monetary and Financial Code were carried out on COFACE SA’s shares in 2022:

Name

Nature of the transaction

Number of securities

Gross unit
 price

Gross
 amount (1)

Total number of securities (2)

Xavier Durand

Acquisition

7,000

€10.92

€76,445

264,500

LTIP 2019

70,000


Pierre Bévierre

LTIP 2019

9,301


19,839

Cyrille Charbonnel

LTIP 2019

9,301


32,648

Declan Daly

LTIP 2019

12,402


12,402

Nicolas Garcia

LTIP 2019

9,301


32,648

Phalla Gervais

Acquisition

20,700

€11.61

€240,419

20,700

Carole Lytton

LTIP 2019

9,301


32,648

Keyvan Shamsa

LTIP 2019

9,301


7,500

Sale

1,801

€10.99

€19,792

Thibault Surer

Acquisition

2,000

€11.56

€23,120

113,819

LTIP 2019

18,602


2019 LTIP: 2019 bonus share allocation plan – delivery on February 16, 2022.

  • Average purchase price in euros.
  • At December 31, 2022, including purchases and sales in previous financial years.

7.2Distribution of capital and voting rights

7.2.1Distribution of capital

The table below breaks down the change in the Company’s capital and voting rights over the last three years:


Dec. 31, 2022

Dec. 31, 2021

Dec. 31, 2020


Shares

%

Voting rights

%

Shares

Voting rights

Shares

Voting rights

Natixis (1)

0

0%

0

0%

15,078,051

15,078,051

64,153,881

64,153,881

Arch Capital Group

44,849,425

29.86%

44,849,425

30.09%

44,849,425

44,849,425

-

-

Employees

1,223,920

0.81%

1,223,920

0.82%

857,423

857,423

853,199

853,199

Public

102,990,329

68.58%

102,990,329

69.09%

88,247,383

88,247,383

84,682,884

84,682,884

Treasury shares (2)

1,116,118

0.74%

0

0%

1,147,510

0

2,341,985

0

Other

-

-

-

-

-

-

-

-

Total

150,179,792

100%

149,063,674

100%

150,179,792

149,032,282

152,031,949

149,689,964

  • On January 5, 2022, Natixis announced the sale of 15,078,095 Coface S.A. shares, representing 10.04% of the share capital, for €11.55 per share, under an accelerated bookbuild transaction with institutional investors.
  • Own shares: liquidity agreement, treasury share transactions and repurchase for cancellation.

7.2.2Voting rights of the majority shareholder

As at the date of this Universal Registration Document, the Company is not controlled by a majority shareholder. No shareholders had specific voting rights.

7.2.3Declaration relating to the Company’s control by the majority shareholder

As at the date of this Universal Registration Document, the Company is not controlled by a majority shareholder.

In a bid to maintain transparency and inform the public, the Company has established a set of measures guided in particular by the recommendations of the Corporate governance code of listed companies (AFEP-MEDEF code).In particular, the Company has set up:

  • a Risk Committee,
  • an Audit and Accounts Committee, and
  • a Nominations and Compensation Committee
  • consisting mainly of independent directors in order to avoid conflicts of interest (see Section 2.1.8 “Specialised committees, offshoots of the Board of Directors”).

7.2.4Crossing of disclosure thresholds

The Company sets out below the disclosures of changes in shareholdings above or below legal thresholds reported in 2022 and until Februay 28, 2023:

  • crossing of the regulatory threshold, reported to the AMF (Article L.233-7 of the French Commercial Code); and
  • crossing of the statutory threshold, reported by registered letter by major shareholders (Article 10 of the Articles of Association).

The Company is not responsible for checking the completeness of these disclosures.

Year

Date of receipt of report

Date threshold was crossed

Legal or statutory threshold

Up /

Down

Investor

Country

Number of shares

% of capital

2022

Jan. 7

Jan. 6

Statutory

CH07_COA2020_URD_Arrow_up_HD.png

Norges Bank IM

Norway

3,120,786

2.08%

2022

Jan. 7

Jan. 6

Legal (AMF)

CH07_COA2020_URD_Arrow_down_HD.png

Natixis

France

0

0%

2022

Jan. 10

Jan. 6

Statutory

CH07_COA2020_URD_Arrow_up_HD.png

Millennium

United Kingdom

3,703,517

2.47%

2022

Feb. 4

Feb. 1

Legal (AMF)

CH07_COA2020_URD_Arrow_up_HD.png

Bank of America Corporation

United States

8,104,772

5.40%

2022

Feb. 8

Feb. 6

Statutory

CH07_COA2020_URD_Arrow_down_HD.png

Moneta AM

France

2,975,000

1.98%

2022

Mar. 3

Mar. 1

Legal (AMF)

CH07_COA2020_URD_Arrow_down_HD.png

Bank of America Corporation

United States

0

0%

2022

Mar. 3

Mar. 2

Statutory

CH07_COA2020_URD_Arrow_down_HD.png

Millennium

United Kingdom

2,921,069

1.95%

2022

May 12

May 11

Statutory

CH07_COA2020_URD_Arrow_up_HD.png

Norges Bank IM

Norway

2,998,303

2.00%

2022

May 13

May 12

Statutory

CH07_COA2020_URD_Arrow_down_HD.png

Mondrian IP

United Kingdom

2,954,380

1.97%

2022

Oct. 21

Oct. 20

Statutory

CH07_COA2020_URD_Arrow_down_HD.png

Invesco Ltd.

United Kingdom

3,002,035

2.00%

2023

Jan. 10

Jan. 9

Statutory

CH07_COA2020_URD_Arrow_up_HD.png

Invesco Ltd.

United Kingdom

3,006,570

2.00%

2022

Apr. 26

Apr. 25

Statutory

CH07_COA2020_URD_Arrow_up_HD.png

BlackRock Inc. (1)

United Kingdom

3,210,453

2.14%

2023

Jan. 2

Dec. 30

Statutory

CH07_COA2020_URD_Arrow_down_HD.png

BlackRock Inc. (2)

United Kingdom

2,804,163

1.87%

  • between April 25, 2022 and January 2, 2023, BlackRock Inc. informed the Company of threshold crossings 22 times:
    • -upward: April 25, 2022 (2.14%), May 5, 2022 (2.06%), May 12, 2022 (2.08%), July 11, 2022 (2.00%), October 5, 2022 (2.01%), December 9, 2022 (2.01%), December 16, 2022 (2.02%), December 20, 2022 (2.03%), December 23, 2022 (2.09%), Fabruary 14, 2023 (2.04%), February 22, 2023 (2.08%)
    • -downward: May 4, 2022 (1.97%), May 6, 2022 (1.94%), May 13, 2022 (1.76%), July 12, 2022 (1.95%), October 6, 2022 (1.96%), December 12, 2022 (1.92%), December 19, 2022 (1.96%), December 22, 2022 (1.99%), December 30, 2022 (1.87%), February 9, 2023 (1.99%), February 16, 2023 (1.99%)

7.2.5Employee profit-sharing

At December 31, 2022, the Group’s employees held 1,223,920 shares, 442,140 of which were held in France through the Coface Actionnariat mutual fund.In total, employees in France and overseas (including management) hold 0.81% of the Company’s capital.

7.3Stock market information

7.3.1The COFACE share

Market profile


Listing market

Euronext Paris (Compartment A), eligible for deferred settlement service (SRD)

Initial public offering

June 27, 2014 at €10.40 per share

Presence in stock market indices

SBF 120, CAC All Shares, CAC All-Tradable, CAC Financials,

CAC Mid & Small, CAC MID 60, Next 150

Codes

ISIN: FR0010667147;Ticker: COFA;

Reuters: COFA.PA;Bloomberg: COFA:FP

Capital (par value of share €2)

€300,359,584

Number of shares outstanding at December 31, 2022

150,179,792

Number of voting rights exercisable at December 31, 2022

149,063,674

Market capitalisation at December 31, 2022

€1,823,182,6754

Highest/lowest price

€12.92 (on Jan. 3, 2022) / €8.50 (on Mar. 7, 2022)

7.3.2Dividend distribution policy

The Build to Lead strategic plan aims to distribute at least 80% of profits provided the solvency ratio is within the target range of 155% to 175%.


For the financial year

2022

2021

2020

2019

Dividend per share

€1.52 (1)

€1.50

€0.55

€0.00 (2)

  • The dividend proposal is subject to the approval of the Shareholders’ Meeting of May 16, 2023.
  • In view of the scale of the health crisis and following the vote at the Combined General Shareholders’ Meeting of May 14, 2020, it was decided not to pay a dividend for the fiscal year ended December 31, 2019.

7.3.3Trends in the share price and monthly trading volumes

COA2022_URD_EN_G021_HD.png

7.3.4Monthly transactions in 2022


Price (in euros)

Transactions

Month

Number of

trading sessions

Low

High

Average

Closing price

Number of shares traded

Capital

(in millions of euros)

Jan-22

21

11.15

12.92

11.82

10,456,316

122.00

Feb-22

20

11.64

12.65

12.10

7,577,907

92.02

Mar-22

23

8.50

11.35

10.38

12,816,612

129.28

Apr-22

19

10.56

11.88

11.23

6,000,995

67.64

May-22

22

10.52

12.68

11.43

8,186,684

94.82

Jun-22

22

9.93

11.02

10.46

5,199,543

54.25

Jul-22

21

9.31

10.36

9.92

4,973,009

49.36

Aug-22

23

9.79

10.83

10.34

4,223,993

43.52

Sept-22

22

9.82

10.40

10.08

6,353,242

64.00

Oct-22

21

9.87

11.40

10.72

5,053,525

53.93

Nov-22

22

11.00

11.79

11.31

3,990,739

45.18

Dec-22

21

11.51

12.31

11.91

3,131,726

37.18

(Source: Euronext Paris)


7.3.5List of regulated information published in 2022

All regulated information is available on the website: https://www.coface.com/fr/Investisseurs

Financial press releases published in 2022

February 15, 2022

FY-2021 results

February 21, 2022

Launch of a redemption offer limited to €150,000,000 for secured subordinated bonds issued by COFACE SA in 2014 for €380,000,000 bearing interest at a fixed rate of 4.125% and maturing on March 27, 2024

February 28, 2022

Withdrawal of the redemption offer for secured subordinated bonds issued by COFACE SA in 2014 for €380,000,000 bearing interest at a fixed rate of 4.125% and maturing on March 27, 2024

April 6, 2022

Coface announces the publication of its 2021 Universal Registration Document

April 7, 2022

AM Best confirms the A (Excellent) rating with a stable outlook for Coface’s main operating entities

April 11, 2022

The Combined Shareholders’ Meeting will be held on May 17, 2022 at 2:00 p.m.

April 26, 2022

Change in the composition of the Board of Directors proposed to the Combined Shareholders’ Meeting of May 17, 2022

April 28, 2022

Coface records a very good start to the year with a net income of €66.2m

April 29, 2022

Publication of the Group and Solo SFCR at December 31, 2021

May 2, 2022

Coface appoints Hugh Burke to lead its Asia-Pacific region

May 17, 2022

All the proposed resolutions were adopted by the Combined Shareholders’ Meeting of May 17, 2022

July 28, 2022

Coface confirms its excellent start of the year with first-half net income of €144.4m. Annualised return on tangible equity at 15.4%

July 28, 2022

Communication setting out the procedures for the publication of the Financial Report for the first half of 2022

September 12, 2022

Launch of a redemption offer limited to €150,000,000 for secured subordinated bonds issued by COFACE SA in 2014 for €380,000,000 bearing interest at a fixed rate of 4.125% and maturing on March 27, 2024

September 21, 2022

Coface announces the success of its debt management exercise

October 11, 2022

Moody’s affirms Coface’s ratings, changes outlook to positive

October 27, 2022

Coface reports a new record result of €84.0m in Q3-2022.Annualised return on tangible equity at 16.4%

November 23, 2022

Fitch confirms Coface’s AA- rating

(1)
On Euronext Paris

7.4Factors liable to have an effect in the event of a public offering

Pursuant to Article L.22-10-11 of the French Commercial Code, the Company notes the following points, which could have an effect in the event of a public offering:

  • the Company’s capital structure as well as its known direct or indirect interests and all the corresponding information are described in Section 7.1;
  • there is no statutory restriction on the exercise of voting rights, with the exception of the elimination of voting rights in respect of shares which exceed the portion that should have been reported, which may be requested by one or more shareholders holding an interest which is at least equal to 2% of the capital or voting rights, in the event of failure to report that the statutory threshold was exceeded;
  • the Company is not aware of the existence of any shareholders’ agreements;
  • there are no instruments entailing special control rights;
  • the voting rights attached to the shares of the Company held by staff through the Company’s Coface Actionnariat mutual fund are exercised by an authorised representative designated by the fund’s Supervisory Board to represent it at the Shareholders’ Meeting;
  • the rules on appointment and revocation of members of the Board of Directors are the legal and statutory rules described in Section 9.1.5;
  • the Company’s Articles of Association are amended in compliance with legal and regulatory provisions;
  • there is no significant agreement entered into by the Company that would be amended or terminated in the event of a change in the Company’s control.

7.5Material contracts

No contract (other than those entered into in the normal course of business) has been signed by any entity of the Group that contains a significant obligation or commitment for the Group as a whole.

16 may 2023 
COMBINED SHAREHOLDERS' MEETING

€1.52 
DIVIDEND PROPOSAL

REMUNERATION STRUCTURE 
OF THE CEO - FINANCIAL YEAR 2023

(1)
On Euronext Paris

8. GENERAL MEETING

8.1Draft Report of the Board of Directors on the draft resolutions submitted to the Combined General Meeting

The purpose of this report is to present the draft resolutions to be submitted by your Board of Directors to the Combined General Meeting of May 16, 2023.

It is specified that the presentation of Coface’s financial situation, activity and profits during the past financial year, as well as the different information required by the laws and regulations in force, can be found in the 2022 Universal Registration Document to which you are invited to refer (available on the Coface website: www.coface.com).

These resolutions are divided into two groups:

  • the first eleven resolutions (the 1st to the 11th resolutions) fall within the remit of the Ordinary General Meeting;
  • the following five resolutions (the 12th to the 16th resolutions) fall within the remit of the Extraordinary General Meeting.

8.1.1Resolutions within the remit of the Ordinary General Meeting

Approval of the financial statements for the 2022 financial year

(1st and 2nd resolutions) 

In the first two resolutions, it is proposed to the Ordinary General Meeting to approve the corporate financial statements (1st resolution), then the consolidated financial statements (2nd resolution) of COFACE SA for the 2022 financial year.

Comments on the corporate and consolidated financial statements of COFACE SA are detailed in the COFACE SA 2022 Universal Registration Document.

Allocation of profits – Payment of dividends

(3rd resolution)

The purpose of the third resolution is to allocate COFACE SA’s corporate profits and to pay dividends.

At December 31, 2022, the corporate financial statements of COFACE SA showed a net profit of €326,479,873. Given a zero retained earnings at December 31, 2022, and the fact that the legal reserve has a balance beyond legal requirements, the distributable profit amounts to €326,479,873.

It is suggested to distribute an amount of €226,576,784, which represents a dividend of €1.52 per share, which corresponds to a distribution rate of 80% of the consolidated net profits, in line with our capital management policy.

For individuals who are tax residents in France, this dividend will be automatically subject to the single flat-rate deduction provided for in Article 200 A of the French General Tax Code, unless the overall option for the progressive scale is chosen. In the event of an option for the progressive scale, this option would be entitled to the proportional reduction of 40% set out in Article 158(3) (2) of the French General Tax Code. The paying institution shall make the flat-rate levy at source (not effecting full discharge) provided for in Article 117 quater of the French General Tax Code, except for beneficiaries who are tax residents in France who have made a request for exemption under the conditions of Article 242c of the French General Tax Code.

All shareholders – and specially those domiciled or established outside France as regards the regulations applicable in the state of residence or establishment – are invited to contact their usual advisor so that he can determine, by means of a detailed analysis the tax consequences of this distribution.

In accordance with the legal provisions, we hereby inform you that the dividends distributed for the previous three financial years were as follows:

Financial Year

Number of shares paid (1)

Total amount (in €)

Distributed dividend eligible for a 40% reduction mentioned in Article 158-3-2 of the French General Tax Code (in €)

2019

0

0

0

2020

149,047,713

81,976,242

81,976,242

2021

149,352, 439

224,028,659

224,028,659

(1) The number of shares paid excludes treasury shares.

The dividend will be detached on May 22, 2023. The payment will take place on May 24, 2023.

Authorisation to the Board of Directors to trade the Company’s shares

(4th resolution)

By the fourth resolution, the Board of Directors proposes to your General Meeting to authorise it to purchase or procure the purchase of a number of Company shares not exceeding 10% of the total number of shares making up the share capital or 5% of the total number of shares comprising the share capital in the case of shares acquired by the Company for the purpose of their custody and payment or exchange in connection with a merger, demerger or contribution, it being specified that the acquisitions made by the Company may under no circumstances lead the Company to hold at any time whatsoever more than 10% of the shares making up its share capital.

Share purchases could be made in order to: a) ensure liquidity and stimulate the market for the Company’s securities through an investment service provider acting independently under a liquidity agreement in accordance with market practice admitted by the Autorité des marchés financiers on June 22, 2021, b) allocate shares to corporate officers and employees of the Company and other Group entities, in particular in connection with (i) the profit sharing of the Company, (ii) any stock option plan of the Company, pursuant to the provisions of Articles L.225-177 et seq. and L.22-10-56 et seq. of the French Commercial Code, or (iii) any savings plan in accordance with the provisions Articles L.3331-1 et seq. of the French Labour Code or (iv) any free allocation of shares under the provisions of Articles L.225-197-1 et seq. and L. 22-10-59 et seq. of the French Commercial Code, as well as to carry out all hedging transactions relating to these transactions, in accordance with the conditions laid down by the market authorities and at the times that the Board of Directors or the person acting on delegation from the Board of Directors shall deem appropriate, c) deliver Company shares upon the exercise of rights attached to securities giving entitlement, directly or indirectly, by redemption, conversion, exchange, presentation of a voucher or in any other manner for the allocation of Company shares within the framework of the regulations in force, as well as to carry out any hedging transactions relating to these transactions, under the conditions provided by the market authorities and at the times that the Board of Directors or the person acting on delegation of the Board of Directors shall deem appropriate, d) retain the shares of the Company and subsequently deliver them as a payment or exchange in the context of any external growth, merger, demerger or contribution transactions, e) cancel all or part of the shares thus purchased (in the context of the twelfth resolution of this General Meeting authorising the Board of Directors to reduce the share capital accordingly) or f) implement any market practice that may be admitted by the Autorité des marchés financiers and, more generally, carry out any operation in accordance with the regulations in force.

The maximum unit purchase price could not exceed, excluding fees, €16 per share. The Board of Directors may however, in the event of transactions involving the Company’s capital, including changes in the nominal value of the share, capital increase by incorporation of reserves followed by the creation and free allocation of shares, split or consolidation of securities, adjust the aforementioned maximum purchase price in order to take into account the impact of these transactions on the value of the Company’s share.

The acquisition, sale or transfer of such shares may be effected and paid by any means authorised by the regulations in force, on a regulated market, on a multilateral trading facility, with a systematic or over-the-counter internaliser, including through the acquisition or sale of blocks, by the use of options or other derivative financial instruments, or warrants or, more generally, securities granting entitlement to Company shares, at such times as the Board of Directors would deem appropriate.

It is specified that the Board of Directors may not, except with the prior authorisation of your General Meeting, make use of this authorisation as from the filing by a third party of a draft public offering covering the shares of the Company, until the end of the offer period.

In compliance with the legal and regulatory provisions in force, the Board of Directors, if your General Meeting authorises it, will have all powers, with the option of sub-delegation, in order to proceed with the allocations and, where applicable, the permitted reallocations of shares redeemed for one of the objectives of the programme for one or more of its other objectives, or their transfer, on the market or off the market.

The Board of Directors proposes that this authorisation, which would cancel and replace that granted by the eighth resolution of the General Meeting of May 17, 2022, be granted for a period of eighteen (18) months from your General Meeting.

To be noted: Arch Capital Group did not take part in the vote related to this resolution.

Special report of the Statutory Auditors on the regulated agreements and commitments referred to in Articles L.225-38 et seq. of the French Commercial Code

(5th resolution)

The special report of the Company’s Statutory Auditors on related-party agreements, referred to in Articles L.225-38 et seq. of the French Commercial Code, does not mention any new agreement, subject to the provisions of Article L.225-38, which would have been entered into during the financial year ended December 31, 2022. You are asked, under the fifth resolution, to take note of this and to approve the special report of the Statutory Auditors.

Approval of the compensation of corporate officers for the financial year ended December 31, 2022

(6th, 7th and 8th resolutions)

Pursuant to the provisions of Article L.22-10-34 of the French Commercial Code, your meeting is called to vote on the following compensation for the financial year ended December 31, 2022:

  • in the sixth resolution, on the information mentioned in Section I of Article L.22-10-9 of the French Commercial Code on the compensation of non-executive corporate officers, pursuant to Article L.22-10-34 I of the French Commercial Code;
  • in the seventh resolution on the fixed, variable and exceptional items comprising the total compensation and benefits of any kind paid during the financial year ended December 31, 2022, or awarded in respect of the same financial year to Mr Bernardo Sanchez Incera, Chairman of the Board of Directors, pursuant to Article L.22-10-34 Section II of the French Commercial Code;
  • in the eighth resolution, on the fixed, variable and exceptional items comprising the total compensation and benefits of any kind paid during the financial year ended December 31, 2022, or awarded in respect of the same financial year to Mr Xavier Durand, Chief Executive Officer, pursuant to Article L.22-10-34 Section II of the French Commercial Code.

All of these items are detailed in the corporate governance report of COFACE SA attached to the management report and included in Chapter 8 of the Company’s 2022 Universal Registration Document.

Approval of the compensation policy of corporate officers for the 2023 financial year

(9th, 10th and 11th resolutions)

You are requested in the ninth, tenth and eleventh resolutions to approve, pursuant to Article L.22-10-8 of the French Commercial Code, the compensation policy applicable to the members of the Board of Directors (ninth resolution), the Chairman of the Board of Directors (tenth resolution) and the Chief Executive Officer (eleventh resolution) for the 2023 financial year.

Policy details are described in COFACE SA’s corporate governance report attached to the management report and included in Chapter 8 of the Company’s 2022 Universal Registration Document.

8.1.2Resolutions within the remit of the Extraordinary General Meeting

Reduction of the share capital by cancellation of the shares held by the Company

(12th resolution)

The purpose of the twelfth resolution is to authorise the Board of Directors to reduce the share capital by cancelling the treasury shares, up to a limit of 10% of the amount of the share capital existing on the date of cancellation per 24-month period and to charge the difference to the available premiums and reserves of its choice. This resolution is based on the provisions of article L22-10-62 of the French Commercial Code.

To be noted: Arch Capital Group did not take part in the vote related to this resolution.

Capital increases reserved for employee

(13th and 14th resolutions)

By the thirteenth resolution, we propose that you delegate to the Board of Directors, for a period of 26 months, with the option of sub-delegation, your authority to increase the share capital by issuing shares of the Company reserved for members of a company savings plan, up to a maximum nominal amount of three million two hundred thousand euros (€3,200,000), it being specified that the nominal amount of any capital increase carried out pursuant to this delegation would be deducted from the overall nominal ceiling provided for in paragraph 2 of the eighteenth resolution of the General Meeting of May 17, 2022 and that the ceiling of this delegation will be shared with that of the fourteenth resolution of this General Meeting.

This delegation of authority would result in the cancellation of the preferential subscription rights of shareholders in favour of said employees, former employees and corporate officers eligible for the shares thus issued, where applicable allocated free of charge.

The subscription price of the shares issued will be determined under the conditions provided for by the provisions of Article L.3332-19 of the French Labour Code, it being specified that the maximum discount compared to an average of the listed prices of the share during the twenty trading sessions preceding the decision to set the opening date of the subscription may not therefore exceed 30% (or 40% when the unavailability period provided for in the plan pursuant to Articles L.3332-25 and L. 3332-26 of the French Labour Code is greater than or equal to ten years). The Board of Directors may reduce or remove the aforementioned discount, if it deems it appropriate, in particular to take into account the legal, accounting, tax and social security requirements applicable in the country of residence of certain beneficiaries. The Board of Directors may also decide to allocate shares free of charge to the subscribers of new shares, in substitution of the discount and/or in respect of the contribution.

The Board of Directors proposes that this authorisation, which would cancel and replace that granted by the twenty-second resolution of the General Meeting of May 17, 2022, be granted for a period of twenty-six (26) months from your General Meeting.

In line with the thirteenth resolution, we propose to you, in the fourteenth resolution, to delegate to the Board of Directors, for a period of 18 months, with the option of sub-delegation under the conditions provided by law, the power to proceed with one or more capital increases reserved for the benefit of (i) the employees and/or corporate officers of the Company and/or companies related to the Company within the meaning of the provisions of Article L.225-180 of the French Commercial Code and Article L.3344-1 of the French Labour Code and having their registered office outside France; (ii) one or more French or foreign mutual funds or other entity, whether or not having legal personality, subscribing on behalf of persons designated in paragraph (i) above, and (iii) one or more financial institutions mandated by the Company to propose to the persons designated in paragraph (i) above a system of savings or shareholding comparable to those offered to employees of the Company in France.

This delegation would entail the cancellation of the preferential subscription right of the shareholders to the shares issued within the framework of this fourteenth resolution in favour of the category of beneficiaries defined above.

The purpose of such a capital increase would be to allow Group employees, former employees and corporate officers residing in certain countries to benefit, taking into account the regulatory or tax constraints that may exist locally, from formulas as close as possible, in terms of economic profile, to those offered to other Group employees in the context of the application of the thirteenth resolution.

The nominal amount of capital increase likely to be issued within the framework of this delegation would be limited to three million two hundred thousand euros (€3,200,000), it being specified that the nominal amount of any capital increase carried out pursuant to this delegation would be deducted from the overall nominal ceiling provided for the capital increases set out in paragraph 2 of the eighteenth resolution of the May 17, 2022 General Meeting, and that the ceiling of this resolution would be shared with that of the thirteenth resolution.

The subscription price of the securities issued pursuant to this delegation may not be more than 30% or, where applicable, 40% than the average of the listed prices of the share during the twenty trading sessions preceding the date of the decision setting the opening date of the subscription, nor higher than this average and the Board of Directors may reduce or remove the aforementioned discount if it deems it appropriate in order to, in particular, take into account the legal, accounting, tax and social security requirements applicable in the country of residence of certain beneficiaries. Furthermore, in the event of a transaction carried out under this resolution at the same time as a transaction carried out pursuant to the thirteenth resolution, the subscription price of the shares issued under this resolution could be identical to the subscription price of the shares issued on the basis of the thirteenth resolution.

The Board of Directors proposes that this authorisation, which would cancel and replace that granted by the twenty-third resolution of the General Meeting of May 17, 2022, be granted for a period of eighteen (18) months from your General Meeting.

Allocation of free shares to employees and/or corporate officers of the Company or related companies

(15th resolution)

In accordance with the provisions of Articles L.225-197-1 et seq. and L. 22-10-59 et seq. of the French Commercial Code, we propose that you authorise the Board of Directors, for a period of 38 months from the date of your General Meeting, to allocate, free of charge, on one or more occasions, existing or future shares of the Company to certain employees and corporate officers of the Company and of the companies related to it within the meaning of Article L.225-197-2 of the French Commercial Code.

The final award of these shares may be subject, in part or in full, to performance conditions, it being specified that the final award of free shares to the executive corporate officers of the Company will be subject in full to the achievement of the performance conditions set by the Board of Directors.

The total number of shares allocated under this authorisation may not exceed 1% of the number of shares comprising the share capital of the Company on the date of the decision to allocate them by the Board of Directors, and the cumulative nominal amount of the capital increases likely to result therefrom would be deducted from the overall nominal ceiling provided for the capital increases in paragraph 2 of the eighteenth resolution of the General Meeting of May 17, 2022 or, where applicable, the amount of the overall ceiling potentially provided for by a resolution of the same nature which may replace the said resolution during the period of validity of this delegation. In addition, the total number of free shares allocated under this authorisation to the Company’s corporate officers may not represent more than 20% of the free shares allocated under this authorisation.

The allocation of performance shares under this proposed resolution would become final at the end of a vesting period of at least three years, which would not be accompanied by any holding period. The objective of this vesting period for performance shares is to measure performance conditional on the definitive acquisition of the shares over a long period of time.

The Board of Directors proposes that this authorisation, which would cancel and replace that granted by the twenty-eighth resolution of the General Meeting of May 12, 2021, be granted for a period of thirty-eight (38) months from your General Meeting.

Powers

(16th resolution)

This resolution is intended to confer the powers necessary to carry out the formalities following the holding of your General Meeting.

8.1.3Extract of the COFACE SA corporate governance report (appendix relating to the 6th, 7th, 8th, 9th, 10th and 11th resolutions)

Compensation policy for corporate officers

Pursuant to Article L.22-10-8 of the French Commercial Code, the Board of Directors, on the proposal of the Appointments, Compensation and CSR Committee, has established a compensation policy for corporate officers. This policy, the principles of which are described in this document, is consistent with the interests of the Company, helps to ensure its continuity and is in line with its business strategy.

It describes all components of fixed and variable compensation and explains the process by which it is determined, reviewed and implemented.

It is presented in a clear and comprehensible manner in the Company Governance Report and will be the subject of draft resolutions to be submitted for approval at the General Meeting of Shareholders each year and upon any proposed material amendment.

The compensation policy for Company officers defines the principles, structure and governance rules applicable to the compensation of the Chief Executive Officer and the directors.

Compensation of the Chief Executive Officer
Principles applicable to the Chief Executive Officer’s compensation

At the beginning of each financial year, the Board of Directors, on a proposal from the Appointments, Compensation and CSR Committee, determines the various components of the Chief Executive Officer (CEO)’s compensation. The Appointments, Compensation and CSR Committee proposes the principles of the CEO’s compensation policy, in accordance with the rules laid down in the Solvency II Directive and the recommendations of the AFEP-MEDEF Code.

The committee therefore ensures that the principles of balance, external competitiveness, consistency and internal fairness are respected when determining the components of the compensation. It ensures the correlation between the responsibilities performed, the results achieved and the level of compensation over a performance year.

It also ensures that the compensation practices contribute to effective risk management in the Company, including:

  • strict compliance with the legal and regulatory provisions applicable to insurance companies;
  • the prevention of conflicts of interest and the framework for taking risks within the Company’s risk tolerance limits;
  • consistency with the Company’s long-term strategy, interests and results;
  • the taking into account of social and environmental issues.

Each year, a comparative market analysis of the CEO’s compensation is carried out by a compensation consulting company, to ensure that the compensation is competitive in the market and that its fixed, short-term and long-term components have the right balance. The result of this analysis is communicated to the Appointments, Compensation and CSR Committee as part of the CEO’s annual compensation review.

Compensation objectives, practices and governance are clearly defined and communicated. The components of the CEO’s compensation are transparently shown in the Company governance report submitted for approval at the General Meeting of shareholders.

Components of the Chief Executive Officer’s compensation

The compensation of the Chief Executive Officer comprises:

  • fixed compensation: the annual fixed compensation was revalued to €750,000 gross upon the reappointment of the Chief Executive Officer in 2020 in order to take into account the responsibilities exercised, performance and market practices (see detailed explanations in the CEO-to-employee pay ratio section below);
  • annual variable compensation (“bonus”): the bonus is assessed based on performance over a given year. The target is set at 100% of the base salary. Financial objectives account for 60% of the compensation, and strategic and management objectives account for the remaining 40%. The maximum achievement rate for variable compensation is 200% (150% for financial objectives and 50% for strategic and managerial objectives);
  • long-term variable compensation in the form of free shares of the Company. They are subject to attendance and performance conditions and have a vesting period of three years. The shares allocated to the Chief Executive Officer may not represent more than 20% of the budget allocated for the financial year, and the value of the shares is limited to 125% of his basic salary for the 2022 financial year and 150% of his basic salary from 2023 onwards. They are allocated under the same conditions as for all beneficiaries, but the Chief Executive Officer must retain 30% of the allocated shares until the end of his term of office. These Long-Term Incentive Plans (LTIPs) in the form of free shares are in particular intended to ensure that the CEO’s interests are aligned with the shareholders’ interests over the long term;
  • benefits in kind: the CEO has the use of a company car, and 62.5% of the contributions due in respect of the social security regime for Company managers is covered.

He benefits from group health and welfare schemes as maintained for all employees. In 2022, the Board of Directors decided to introduce a supplementary pension scheme for members of the Executive Committee including the Chief Executive Officer. A medical assessment is offered every two years to the Chief Executive Officer and to the members of the Executive Committee.

Please note:

  • the variable compensation package is made up of the annual variable compensation (“bonus”) and the long-term variable compensation (Long-Term Incentive Plan) in the form of free shares;
  • the payment of 30% of the annual variable compensation (“bonus”) is deferred, 50% of which is paid in Y+2 and 50% in Y+3. The deferred portion of compensation is not paid in the event of a loss observed on the date of payment, or of dismissal for serious or gross misconduct;
  • the deferred compensation rate, including the deferred bonus portion and the free shares awarded under the Long-Term Incentive Plan, represents more than 60% of total variable compensation;
  • any risk hedging transaction is prohibited.

The Chief Executive Officer’s compensation may be summarised as follows:

COA2022_URD_EN_G044_HD.png
a. Target total compensation for 2022

For 2022, at the recommendation of the Appointments and Compensation Committee, after a decision by the Board of Directors and on the basis of the fifteenth resolution approved by the General Shareholders’ Meeting on May 17, 2022, Xavier Durand’s target compensation was defined as follows:

Compensation components

Target amount

Comments


Fixed compensation

€750,000

Gross annual compensation set at €750,000 in the context of Xavier Durand’s reappointment in 2020, maintained at the same level for 2022.

Target annual variable compensation (“bonus”)

€750,000


The target variable compensation is maintained at 100% of the fixed compensation, or €750,000.

Its structure remains unchanged. Financial objectives account for 60% of the compensation, and strategic and management objectives account for the remaining 40% for 2022 as defined below:

Financial objectives

Variation limits

Allocation reference

Turnover

-/+10%

15%

Net income

-/+20%

20%

Cost ratio net of reinsurance

+/-3 pts

10%

Gross loss ratio excluding claims management costs

+/-5 pts

10%

TOTAL (A)


60%

Strategic and managerial objectives

Variation limits

Allocation reference

Strategic plan/regularity of dialogue with the Board of Directors

0/125%

15%

Integration of CSR issues into the commercial policy, carbon footprint assessment and definition of the trajectory to reduce our emissions

0/125%

10%

Maintaining employee commitment and customer satisfaction

0/125%

10%

Executive Committee’s succession plan

0/125%

5%

TOTAL (B)


40%

Total (A + B)


100%

The objectives set reflect the Company’s strategy. They respect the Company’s interests, contribute to its commercial strategy and its sustainability.


The maximum achievement rate for variable compensation is 200% broken down as follows:

  • 150% for financial targets (a maximum achievement rate of 250% per target);
  • 50% for strategic and managerial objectives (a maximum achievement rate of 125% per target).

The rate of achievement of financial objectives is defined within the framework of variation limits as follows:

  • the low end of the variation limit corresponds to the trigger level, which is 0% achievement;
  • the target level corresponds to 100% achievement;
  • between the low end of the variation limit and the target, the achievement rate is set in a linear manner between 0% and 100% achieved;
  • between the target and the top end of the variation limit, the achievement rate is set in a linear manner between 100% and 250% achieved.

Thus, if the achievement rate of one of the financial objectives is less than or equal to the low end of the variation limit of said target, no compensation will be paid in this respect.


Note: strategic and managerial objectives are mainly assessed using quantifiable and measurable indicators (achievement of the business development targets included in the strategic plan, monitoring of changes to our CO2 emissions, employee engagement survey, customer satisfaction measured using NPS, etc.).


The payment of 30% of the annual variable compensation (“bonus”) is deferred, with 50% paid in Y+2 and 50% in Y+3. A malus [penalty] system is introduced in the event of termination for serious misconduct or gross negligence or losses observed before the payment date.


Compensation components

Target amount

Comments


Long-term variable compensation (Award of performance free shares) – 2022 LTIP

€880,350 
(value on award date)

75,000 shares are awarded under the 2022 Long-Term Incentive Plan (2022 LTIP), representing a value of €880,350 on the award date based on the average of the last 20 market opening prices preceding the date of the Board of Directors’ meeting.


The number of shares awarded in 2022 is in line with previous financial years (2020 and 2021), with a valuation up 37% due to the rise in the share price over the period.

For the 2022 financial year, the maximum amount of the free share allocation awarded to Xavier Durand under the LTIP is set at 20% of the budget allocated for the financial year and 125% of his fixed compensation. For 2022, Xavier Durand’s award corresponds to 17% of the maximum budget allocated for the fiscal year and 117% of his fixed compensation on the award date.


The bonus shares will vest on February 15, 2025, subject to attendance and performance conditions measured over the duration of the plan until December 31, 2024, as follows:

  • 40% of the shares awarded will vest subject to the relative performance of the COFACE SA share measured by COFACE SA’s Total Shareholder Return (TSR) compared to the TSR of the institutions making up the Euro Stoxx Assurances index over the period from January 1, 2022 to December 31, 2024;
  • 40% of the shares awarded will vest subject to the realisation of the net earnings per share at December 31, 2024;
  • 20% of the shares awarded will vest subject to the achievement of the CSR criterion linked to the increase in the proportion of women in senior management (Top 200) at December 31, 2024.

The trigger threshold shall be set at 80% of the target for each criterion. Thus, if the achievement rate of one of the criteria is less than 80% of the target, the performance under that criterion will not be met. The achievement rate of the criteria may vary between 80% and 120%, and the achievement rates may be offset. However, this offsetting cannot be applied if the achievement rate under one of the criteria is less than 80% of the target and cannot result in the acquisition of more than 100% of the shares in total.

The vesting period for the shares is set at three years from February 15, 2022. The plan does not provide for a lock-up period.

It was decided that the percentage of shares acquired under the 2022 LTIP to be retained by the Chief Executive Officer until the end of their corporate office or any other position they would have to perform within Coface should be set at 30%.

The objective of long-term variable compensation is to have the Chief Executive Officer act with a view to the long term, but also to retain them and to promote the alignment of their interests with the corporate interest of the Company and that of the shareholders.

Other benefits

€165,995

(including the pension plan)

Mr Xavier Durand has the use of a company car, and 62.5% of the contributions due in respect of the social security regime for Company managers is covered.

He benefits from group health and welfare schemes as maintained for all employees.


In order to ensure that the compensation of the members of the Executive Committee meet the requirements of fairness and competitiveness, the Board of Directors decided, at its meeting held on February 15, 2022, to introduce a supplementary pension scheme for members of the Executive Committee who were not members of a specific scheme. This scheme applies to Xavier Durand, provided that he meets the performance criteria applicable to the severance payment, i.e.:

  • he attains at least 75% of his annual targets on average over the last three financial years; and
  • the Company’s combined ratio after reinsurance is no greater than 95% on average over the three financial years preceding the date on which contributions are made to the scheme.


As these two conditions were met for 2019-2022, a contribution will be made to the pension scheme equal to 10% of the Chief Executive Officer’s fixed compensation, together with an amount to offset the additional tax liability of up to a maximum of 10%.

Total compensation target for 2022

€2,546,345


b. Total compensation awarded and paid in 2022
  • The compensation awarded to Mr Durand in respect of 2022, including the valuation of the 2022 bonus, complies with the proposal of the Appointments and Compensation Committee dated January 23, 2023, submitted for approval by the Board of Directors on February 16, 2023 and with the approval of the Ordinary General Meeting following the end of the 2022 financial year.
  • The compensation paid to Mr Durand in 2022 is in accordance with the compensation policy proposal of the Appointments and Compensation Committee dated January 14, 2022, approved by the Board of Directors on February 15, 2022 and by the General Shareholders’ Meeting of May 17, 2022 in its twelfth and fifteenth resolutions.

Compensation components

Amount awarded

Amount paid

Comments


Fixed compensation

€750,000

€750,000

Gross annual compensation set at €750,000 for Xavier Durand’s reappointment and effective since May 2020, the date of the General Meeting of Shareholders to close the 2019 financial year.

Annual variable compensation awarded (“2022 bonus”)

€1,415,555


The rate of achievement of the 2022 objectives proposed by the Appointments and Compensation Committee at its meeting on January 23, 2023, submitted for approval to the Board of Directors at its meeting on February 16, 2023, and to the approval of the General Shareholders’ Meeting convened to decide on the 2022 financial statements, amounts to 188.74%, broken down as follows:

Financial objectives

Variation limits

Allocation reference

Completion rate

Amount of variable compensation

(in €)

Turnover

-/+10%

15%

250.00%

281,250

Net income

-/+20%

20%

250.00%

375,000

Cost ratio net of reinsurance

+/-3 pts

10%

210.00%

157,500

Gross loss ratio excluding claims management costs

+/-5 pts

10%

250.00%

187,500

Revenue from the information activity

-/+20%

5%

104.81%

39,305

TOTAL (A)


60%

138.74%

1,040,555

Strategic and managerial objectives

Variation limits

Allocation reference

Completion rate

Amount of variable compensation

(in €)

Strategic plan (Regularity of dialogue with the Board of Directors on the achievement of the strategic plan)

0/125%

15%

125.00%

€140,625

CSR strategy / Integration of CSR into the commercial policy, carbon footprint assessment and definition of the trajectory to reduce our emissions

0/125%

10%

125.00%

€93,750

Maintaining employee commitment and customer satisfaction

0/125%

10%

125.00%

€93,750

Executive Committee’s succession plan

0/125%

5%

125.00%

€46,875

TOTAL (B)


40%

50.00%

€375,000

Total (A + B)


100%

188.74%

€1,415,555

The bonus due in respect of 2022 therefore amounts to €1,415,555 and will be paid as follows:

  • 70% of the total amount paid in 2023, i.e. €990,889;
  • 15% of the total amount deferred to 2024, i.e. €212,333;
  • 15% of the total amount deferred to 2025, i.e. €212,333.


Compensation components

Amount awarded

Amount 
paid

Comments


Annual variable compensation paid (“2021 bonus”)


€872,278

The achievement rate of the 2021 targets was 166.148%, broken down as follows:

Financial objectives

Variation limits

Allocation reference

Completion rate

Amount of variable compensation

(in €)

Turnover

-/+10%

20%

145.74%

218,610

Net income

-/+20%

20%

250.00%

375,000

Cost ratio net of reinsurance

+/-3 pts

10%

145.00%

108,750

Gross loss ratio excluding claims management costs

+/-5 pts

10%

250.00%

187,500

TOTAL (A)


60%

118.648%

889,860

Strategic and managerial objectives

Variation limits

Allocation reference

Completion rate

Amount of variable compensation

(in €)

Strategic plan

0/125%

15%

125%

140,625

CSR strategy/ESG performance of the investment portfolio calculated by Amundi

0/125%

10%

125%

93,750

Maintaining employee commitment and customer satisfaction

0/125%

10%

100%

75,000

Executive Committee’s succession plan

0/125%

5%

125%

46,875

Total (B)


40%

47.50%

356,250

Total (A + B)


100%

166.148%

1,246,110

The bonus due for the 2021 financial year therefore amounts to €1,246,110, paid as follows:

  • 70% of the total amount in 2022, i.e. €872,278;
  • 15% of the total amount deferred to 2023, i.e. €186,916;
  • 15% of the total amount deferred to 2024, i.e. €186,916.

Deferred variable compensation “2019 bonus”


€130,608

Xavier Durand’s 2019 bonus amounted to €870,723, paid as follows:

  • 70% of the total amount in 2020, i.e. €609,507;
  • 15% of the total amount deferred to 2021, i.e. €130,608;
  • 15% of the total amount deferred to 2022, i.e. €130,608;

Deferred variable compensation “2020 bonus”


€74,810

Xavier Durand’s 2020 bonus amounted to €498,733, paid as follows:

  • 70% of the total amount in 2021, i.e. €349,113;
  • 15% of the total amount deferred to 2022, i.e. €74,810;
  • 15% of the total amount deferred to 2023, i.e. €74,810.

*     Please note: Following the achievement of the performance conditions under the 2019 LTIP Plan, the shares awarded to Mr Durand under that plan, i.e. 70,000 shares (for a value of €564,445 at the date of award and €463,260 at fair value under IFRS) were not delivered in February 2021.

Compensation components

Amount awarded

Amount paid

Comments


Long-term 
variable compensation (Award of performance free shares) – 2022 LTIP

€737,700

(IFRS fair value)


75,000 shares were awarded under the 2022 Long-Term Incentive Plan (2022 LTIP), representing a value of €737,700 at fair value under IFRS (€880,350 at the grant date based on the average of the last 20 market opening prices preceding the date of the Board of Directors’ meeting).

The final vesting is subject to the attendance and performance conditions as detailed above.

Other benefits

€165,995

€15,995

Mr Xavier Durand has the use of a company car, and 62.5% of the contributions due in respect of the social security regime for Company managers is covered.

He benefits from group health and welfare schemes as maintained for all employees.

In order to ensure that the compensation of the members of the Executive Committee meet the requirements of fairness and competitiveness, the Board of Directors decided, at its meeting held on February 15, 2022, to introduce a supplementary pension scheme for members of the Executive Committee who were not members of a specific scheme. This scheme applies to Xavier Durand, provided that he meets the performance criteria applicable to the severance payment, i.e.:

  • he attains at least 75% of his annual targets on average over the last three financial years, and
  • the Company’s combined ratio after reinsurance is no greater than 95% on average over the three financial years preceding the date on which contributions are made to the scheme.

As these two conditions were met for 2019-2022, a contribution will be made to the pension scheme equal to 10% of the Chief Executive Officer’s fixed compensation, together with an amount to offset the additional tax liability of up to a maximum of 10%.

Total compensation*

€3,069,250

€1,843,691*


*     Please note: Following the achievement of the performance conditions under the 2019 LTIP Plan, the shares awarded to Mr Durand under that plan, i.e. 70,000 shares (for a value of €564,445 at the date of award and €463,260 at fair value under IFRS) were not delivered in February 2021.

It is specified that the payment of the “2022 bonus” is subject to the approval of the Ordinary General Meeting which approves the financial statements for the 2022 financial year.

c. CEO-to-employee pay ratio calculated for both the average and median compensation of Company employees

Pursuant to Article L.22-10-9 of the French Commercial Code, the Company hereby presents its CEO-to-employee pay ratio calculated for both the average and median compensation of Company employees on an full-time equivalent basis.

This analysis was carried out taking into account the “guidelines on compensation multiples” provided by AFEP on September 27, 2019 and updated in February 2021. The scope used for the analysis is the France scope (all employees based in France and continuously present over the reporting year) – the reference market for the Chief Executive Officer – which appears to be the most relevant for this study. It takes into account items paid or granted in respect of financial year Y (fixed portion, variable portion paid in year Y in respect of Y-1, deferred variable portion paid during financial year Y in previous fiscal years, performance free shares awarded in respect of financial year Y valued at their IFRS value and benefits in kind).

It only concerns the Chief Executive Officer, as the Chair of the Board of Directors only receives an annual fixed compensation of €180,000 for carrying out his duties.

Financial year

2018

2019

2020

2021

2022

Benchmark

SBF 120*

Ratio to average compensation

23.7

24.1

29.1

24.2

28.0

50

Ratio to median compensation

29.2

29.0

35.2

29.4

34.6

66

* Average ratio; source: Willis Towers Watson.


/Explanation of the change in ratio over the reference period
  • 2018 financial year: first year of full compensation for Xavier Durand, including an outperformance bonus for 2017 (152.01% achievement in meeting the targets set over the period) as well as the first amount of deferred variable compensation paid in respect of the 2016 bonus.
  • 2019 financial year: Xavier Durand’s compensation includes an outperformance bonus for 2018 (157.83% achievement in meeting the targets set for the period), comparable to 2017 as well as the second amount of deferred variable compensation paid in respect of the 2016 bonus and the first in respect of the 2017 bonus; the ratios were relatively stable between 2018 and 2019.
  • 2020 financial year: Xavier Durand’s compensation includes an outperformance bonus for 2019 (151.43% achievement in meeting the targets set over the period), comparable to 2017 and 2018, as well as the second amount of deferred variable compensation paid in respect of the 2017 bonus and the first in respect of the 2018 bonus. Furthermore, Xavier Durand’s fixed compensation was increased from €575,000 to €750,000 in 2020 at the time of his reappointment, in order to take into account:
    • individual performance: Mr Durand surpassed his performance targets over the previous three financial years,
    • market practices: Xavier Durand’s fixed compensation was voluntarily set under the market median when he took office in 2016 (to reach -17% compared to the market median (1) in base salary and -21% overall in 2019) and was not reassessed during the first four years on the job, in accordance with the Company’s policy and in accordance with the recommendations of the AFEP-MEDEF code. This reassessment made it possible to position Xavier Durand’s compensation at a competitive level, slightly above the market median (+7% compared to the median in base salary and +9% overall).
  • The equity ratio therefore changed over the period but remains well below the benchmarks made up of the companies in the SBF 120.
  • 2021 financial year: the compensation paid or awarded to Xavier Durand in 2021 mainly includes:
    • the base annual compensation set at €750,000 upon his reappointment in 2020 and unchanged in 2021,
    • the cash portion of the bonus due in respect of 2020, estimated at 72.11% of achievement in meeting the targets set over the period, which is therefore down significantly compared to previous years,
    • the second amount of deferred variable compensation paid in respect of the 2018 bonus and the first in respect of the 2019 bonus, the amounts of which were stable compared to the previous financial year,
    • the amount allocated under the 2021 LTIP, i.e. 75,000 shares, valued at €533,850 (IFRS value), corresponding to a 25% decrease compared to the 2020 LTIP 2020, estimated at €717,900 (IFRS value).
  • Given these factors, the CEO-to-employee pay ratio was down significantly over the period.

2022 financial year: the compensation paid or awarded to Xavier Durand in 2022 mainly includes:

  • the base annual compensation set at €750,000 upon his reappointment in 2020 and unchanged in 2022,
  • the cash portion of the bonus due in respect of 2021, assessed at 166.148% of achievement in meeting the targets set over the period, which is therefore up from previous financial years, and up significantly in comparison with 2020 results,
  • the second instalment of the deferred variable compensation paid in respect of the 2019 bonus is stable compared with the previous financial year; the first instalment of the deferred compensation in respect of the 2020 bonus is lower than historical payments,
  • the amount awarded under the 2022 LTIP, i.e. 75,000 shares, valued at €737,700 (IFRS value), an increase on the amount awarded under the 2021 LTIP, valued at €533,850 (IFRS value).
/Annual change in compensation, the Company’s performance, the average compensation on a full-time equivalent basis of the Company’s employees and the ratios mentioned above during the five most recent financial years


2018-2017

2019-2018

2020-2019

2021-2020

2022-2021

Evolution of the Chief Executive Officer’s compensation

41%

9%

22%

(17%)

35%

Change in average employee compensation

6%

7%

1%

0%

17%

Change in CEO-to-employee pay ratio based on average employee pay

33%

2%

21%

(17%)

15%

Change in CEO-to-employee pay ratio based on median employee pay

37%

(1%)

21%

(16%)

18%

Change in net income

47%

20%

(44%)

170%

26%

Turnover growth

2%

7%

(2%)

8%

16%

Note: after a fall in the Chief Executive Officer’s compensation in 2021, it increased in 2022, following an increase in the vested portion of the bonus in respect of 2021 and paid in 2022.

With regard to long-term variable compensation in the form of free shares, the same number of shares was granted in 2021 and 2022, but the fair value under IFRS of the shares awarded in 2022 was up sharply compared with 2021.

These changes show the close connection between the Company’s results and the valuation of annual variable compensation (bonuses) and therefore the effectiveness of the Chief Executive Officer’s compensation mechanism.

The structure and principles of the Chief Executive Officer’s compensation mechanism will therefore be maintained in 2023.

d. Structure of the compensation of the Chief Executive Officer for 2023

In respect of 2023, on the proposal of the Appointments, Compensation and CSR Committee, after the decision of the Board of Directors and subject to the approval of the General Shareholders’ Meeting, Xavier Durand’s compensation shall consist of the following elements:

Compensation components

Target amount

Comments


Fixed compensation

€750,000

Gross annual compensation set at €750,000 for Xavier Durand’s reappointment and effective since May 2020, the date of the General Meeting of Shareholders to close the 2019 financial year.

Target annual variable compensation (“bonus”)

€750,000


The target variable compensation is maintained at 100% of the fixed compensation, or €750,000. Its structure remains unchanged. Financial objectives account for 60% of the compensation, and strategic and management objectives account for the remaining 40% for 2023 as defined below:


Financial objectives

Variation limits

Allocation reference


Net income

-/+20%

20%


Turnover

-/+10%

10%


Cost ratio net of reinsurance

+/-3 pts

10%


Gross loss ratio excluding claims management costs

+/-5 pts

10%


Revenue from the information & debt collection activities

-/+20%

10%

Total (A)


60%

Strategic and managerial objectives

Variation limits

Allocation reference

Strategic plan: 
- Review of the 2020-2023 Plan 
- Development of the new Plan

0/125%

15%

CSR strategy (Implementation of the action plan to reduce emissions in accordance with the planned trajectory)

0/125%

10%

Maintaining employee commitment and customer satisfaction

0/125%

10%

Executive Committee’s succession plan

0/125%

5%

Total (B)


40%

Total (A + B)


100%


The objectives set reflect the Company’s strategy. They respect its social role and contribute to its commercial strategy and to its continuity.


The maximum achievement rate of the variable compensation is 200% which includes:

  • 150% of the financial objectives (i.e. a maximum objectives assessment rate of 250%);
  • 50% of the strategic and managerial objectives (i.e. a maximum objectives assessment rate of 125%).


The achievement rate for financial objectives is defined within the variation limits as follows:

  • the lower end of the variation limit corresponds to the trigger level, i.e. 0% achieved;
  • the objective corresponds to 100% achievement;
  • between the lower end of the variation limit and the objective, the achievement rate is calculated on a straight-line basis between 0% and 100% of achievement;
  • between the objective and the upper end of the variation limit, the achievement rate is calculated on a straight-line basis between 100% and 250% of achievement.


Thus, if the achievement rate for one of the financial objectives is at or below the lower end of the variation limit for this objective, no compensation will be paid for it.


NB: Strategic and managerial objectives are essentially evaluated though quantifiable and measurable indicators (constructing a strategic plan, follow-up of CO2 emissions, employee engagement survey, client satisfaction measured through NPS, etc.)


The payment of 30% of the annual variable compensation (“bonus”) is deferred and paid as follows: 50% in N+2 and 50% in N+3. A malus is applicable in the event of dismissal for gross negligence or serious misconduct or losses observed prior to the payment date.

Compensation components

Target amount

Comments


Long-term variable compensation (Award of performance free shares) – 2023 LTIP

€964,838 
(value at attribution)

75,000 free shares are awarded under the 2023 Long-Term Incentive Plan (2023 LTIP), representing a value at attribution of €964,838, based on the average opening share price for the 20 trading days preceding the date of the Board meeting.


The number of shares attributed in 2023 remains in line with the previous performance years (2021 and 2022), with the attribution value increasing by 9.6%, due to share price evolution over the period.


Since 2021, the maximum of LTIP granted to Xavier Durand is set at 20% of the envelope attributed for the exercise. For 2023, the maximum LTIP granted to Xavier Durand as % of his fixed compensation is reviewed from 125% to 150%, to take into account the evolution of the share price. In 2023, the LTIP granted to Xavier Durand represent 17.5% of the total envelope attributed for the exercise, and 129% of his fixed compensation at the date of attribution.


Free shares will be definitively vested on February 16, 2026, subject to presence and performance conditions measured over the term of the plan until December 31, 2025, as follows: 

  • 35% of the shares awarded will be vested subject to the relative performance of COFACE SA’s shares, measured by COFACE SA’s Total Shareholder Return (TSR) compared to the TSR of companies comprising the Euro Stoxx Assurance index over the period from January 1, 2023 to December 31, 2025;
  • 35% of the shares awarded will be vested subject to achievement of net earnings per share at December 31, 2025;
  • 30% of the shares awarded will be vested subject to achievement of two criteria related to CSR:
    • Criterion on increasing the proportion of women in senior management (Top 200) by December 31, 2025,
    • Criterion on reducing CO2 emissions of the investment portfolio by December 31, 2025.


The trigger level is set at 80% of the objective for each criterion. Thus, if the achievement rate for one of the criteria is less than 80% of the objective, the condition in respect of this criterion will be considered not achieved. The achievement rate may vary between 80% and 120%, and the achievement rates can offset each other. However, no offsetting applies if the rate of achievement for one of the criteria is less than 80% of the target, and overachievement of criteria cannot result in acquiring more than 100% of the shares initially attributed.

The share vesting period is set at three years starting from February 16, 2023. The plan does not include a holding period.

The Board decided that 30% of the CEO’s shares vested under the 2023 LTIP should be retained until the end of his term of office or of any other role that he might hold within Coface.

Other benefits

€165,995

Xavier Durand has the use of a company car, and 62.5% of the contributions due in respect of the social security regime for Company managers is covered.


He benefits from the group health and welfare schemes provided to all employees, and a supplementary pension scheme from which the members of the Executive Committee also benefit.

Total compensation target for 2023

€2,630,833

Subject to approval by the General Shareholders’ Meeting

*     Note: The Board of Directors meeting of February 16, 2023 approving the financial statements for 2022 confirmed the achievement of the performance conditions attached to the 2020 Long-Term Incentive Plan (2020 LTIP); the shares allocated to Mr Xavier Durand under this plan were delivered on February 17, 2023, or 75,000 shares for a value of €717,900 at IFRS fair value (€996,000 in capital gain on acquisition).

Severance pay

Mr Xavier Durand benefits, in the event that his term of office ends, from severance in the amount of two years’ salary (fixed plus variable). The reference used for the fixed portion is the salary for the current financial year on the date his duties end. The reference amount for the variable portion will be the average of the variable portions received for the three financial years preceding the date his duties end.

This severance pay shall be due if the following performance criteria have been met:

  • achievement of at least 75% of the average annual objectives during the three financial years preceding the departure date; and
  • the Company’s combined ratio after reinsurance is at most 95% on average over the three financial years preceding the departure date.

If just one of the above two conditions has been fulfilled, 50% of the indemnity will be due. If none of the above conditions have been met, no indemnity will be due. No indemnity shall be paid by the Company if the term of office is ended at Mr Xavier Durand’s initiative or in the event of termination for serious misconduct or gross negligence. The components of compensation and employee benefits covered by the regulated agreements procedure in accordance with the provisions of the French Commercial Code will be subject to the approval of the Company’s General Meeting.

Xavier Durand does not have an employment contract.

As of his reappointment in 2020, given his responsibilities as Chief Executive Officer and in order to preserve the Company’s interests, the Board of Directors decided to implement a non-compete agreement.

It is understood that the maximum total amount paid to Xavier Durand in respect of the application of the severance payment and the non-compete agreement may under no circumstances exceed two years’ salary (fixed plus variable).

Directors’ compensation
Principles of directors’ compensation

The Group’s policy is not to award compensation to management representatives who perform the duties of directors in Group companies.

The compensation policy for corporate officers has been adapted to the usual practices of listed companies and guarantees the independence of directors.

Components of directors’ compensation

Total compensation of directors in 2022 was €450,000 (excluding the compensation of the Chairman of the Board of Directors), which was divided among the Board of Directors, the Audit and Accounts Committee, the Risk Committee and the Appointments, Compensation and CSR Committee. 

The rules for allocating directors’ fees are as follows:


Fixed portion

(per year prorata to the term of office)

Variable portion

(per meeting and capped*)

Board of Directors

Members

€8,000

€3,000

Audit and Accounts Committee

Chairman

€17,000

€3,000


Members

€5,000

€2,000

Risk Committee

Chairman

€17,000

€3,000


Members

€5,000

€2,000

Appointments, Compensation and CSR Committee

Chairman

€8,000

€3,000


Members

€3,000

€2,000

*    Capped:

     - at six meetings for the Board of Directors, the Audit and Accounts Committee and the Risk Committee;

     - at five meetings for the Appointments, Compensation and CSR Committee.

N.B.: The Chairman of the Board of Directors receives compensation of €180,000 for his corporate office within COFACE SA.

a. Compensation payable to directors for 2022

On the basis of six Board meetings per year;

Six Audit and Accounts Committee meetings; six Risk Committee meetings; five Nominations and Compensation Committee meetings

Financial year 2021 – maximum gross compensation amounts

Amount of compensation

Fixed portion

(in %)

Variable portion

(in %)

Member of the Board of Directors

€26,000

31

69

Member of the Board of Directors

+ Chairman of the Audit and Accounts Committee

€61,000

41

59

Member of the Board of Directors

+ Member of the Audit and Accounts Committee

€43,000

30

70

Member of the Board of Directors

+ Chairman of the Risk Committee

€61,000

41

59

Member of the Board of Directors

+ Member of the Risk Committee

€43,000

30

70

Member of the Board of Directors

+ Chairman of the Appointments, Compensation and CSR Committee

€49,000

33

67

Member of the Board of Directors

+ Member of the Appointments, Compensation and CSR Committee

€39,000

28

72

The table below presents the compensation owed to the members of the Company’s Board of Directors in 2021 and 2022.


Compensation of 
directors (in €)

other compensation and benefits (in €)

Total

(in €)

2022 (1)

2021 (2)

2022 (1)

2021 (2)

2022 (1)

2021 (2)

Jean Arondel (3)

-

4,000

-

-

-

4,000

Nathalie Bricker (3)

-

(5)

-

-

-

(5)

Janice Englesbe

41,000

37,375

-

-

41,000

37,375

David Gansberg (4)

41,000

27,417

-

-

41,000

27,417

Éric Hémar

21,375

55,000

-

-

21,375

55,000

Chris Hovey

26,000

25,000

-

-

26,000

25,000

Daniel Karyotis (3)

-

4,000

-

-

-

4,000

Isabelle Laforgue

56,000

53,375

-

-

56,000

53,375

Benoit Lapointe de Vaudreuil (4)

-

19,667

-

-

-

19,667

Laetitia Léonard-Reuter (6)

41,208

-

-

-

41,208

-

Nathalie Lomon

58,000

58,000

-

-

58,000

58,000

Sharon MacBeath

42,708

33,000

-

-

42,708

33,000

Laurent Musy (6)

31,708

-

-

-

31,708

-

Nicolas Papadopoulo

39,000

36,000

-

-

39,000

36,000

Marie Pic-Pâris (3)

-

6,625

-

-

-

6,625

Isabelle Rodney (3)

-

6,625

-

-

-

6,625

Anne Sallé-Mongauze (3)

-

(5)

-

-

-

(5)

Olivier Zarrouati

27,000

40,000

-

-

27,000

40,000

Total

425,000

406,084

-

-

425,000

406,084

  • Amount allocated for 2022, in euros, on a gross basis (before social security contributions and taxes).
  • Amount allocated for 2021, in euros, on a gross basis (before social security contributions and taxes).
  • Directors representing Natixis who resigned following the announcement of February 10, 2021 on the sale of 29.5% of the capital by Natixis to the Arch Capital Group.
  • Resignation of Benoît Lapointe de Vaudreuil on July 28, 2021 and cooptation of David Gansberg.
  • Nathalie Bricker, Chief Financial Officer of Natixis, waives her right to receive compensation for her participation in the Board of Directors of COFACE SA in accordance with Natixis policy. The same goes for Anne Sallé-Mongauze, Chief Executive Officer of a subsidiary wholly-owned by Natixis.
  • Following the Combined General Meeting held on May 17, 2022, Laetitia Léonard-Reuter and Laurent Musy were appointed as directors. These appointments follow the expiry of the terms of office of Olivier Zarrouati and Éric Hémar, respectively.
b. Principles and components of directors’ compensation for 2023

In accordance with the provisions of the PACTE Act, which entered into force in November 2019, the policy on attendance fees was replaced by the compensation policy for directors in January 2020.

The terms of directors’ compensation remain unchanged for 2023. They may nevertheless be adjusted at a later date. In this case, the terms of this report will be amended accordingly.

(1)
Benchmark for Willis Towers Watson on a panel of 30 companies in the SBF 80 comparable to COFACE in terms of headcount, turnover and/or geographic scope

8.2Resolutions submitted to the vote of the Combined Shareholders’ Meeting of May 16, 2023

8.2.1Draft agenda

For details of this draft, please refer to Section 8.1 “Draft report of the Board of Directors on the draft resolutions submitted to the Combined Shareholders’ Meeting” of this Universal Registration Document.

Within the authority of the Ordinary Shareholders’ Meeting
  • Reports of the Board of Directors and of the Statutory Auditors on the Company’s operations during the financial year ended December 31, 2022.
  • Approval of the financial statements for the financial year ended December 31, 2022.
  • Approval of the consolidated financial statements for the financial year ended December 31, 2022.
  • Allocation of profit or loss for the financial year ended December 31, 2022.
  • Authorisation of the Board of Directors to trade in the shares of the Company.
  • Approval of the special report of the Statutory Auditors on the regulated agreements and commitments referred to in Articles L.225-38 et seq. of the French Commercial Code.
  • Approval of the information mentioned in Section I of Article L.22-10-9 of the French Commercial Code on the compensation of corporate officers, non-directors pursuant to Article L.22-10-34 Section I of the French Commercial Code.
  • Approval of fixed, variable and exceptional items comprising the total compensation and benefits of any kind paid during the financial year ended December 31, 2022, or awarded in respect of the same financial year to Bernardo Sanchez Incera, Chairman of the Board of Directors, pursuant to Article L.22-10-34 Section II of the French Commercial Code.
  • Approval of fixed, variable and exceptional items comprising the total compensation and benefits of any kind paid during the financial year ended December 31, 2022, or awarded in respect of the same financial year to Xavier Durand, Chief Executive Officer, pursuant to Article L.22-10-34 Section II of the French Commercial Code.
  • Approval of the compensation policy applicable to the members of the Board of Directors, pursuant to Article L.22-10-8 of the French Commercial Code.
  • Approval of the compensation policy applicable to the Chairman of the Board of Directors, pursuant to Article L.22-10-8 of the French Commercial Code.
  • Approval of the compensation policy applicable to the Chief Executive Officer, pursuant to Article L.22-10-8 of the French Commercial Code.
Within the authority of the Extraordinary Shareholders’ Meeting
  • Authorisation to the Board of Directors to reduce the share capital of the Company by cancellation of shares held in its own right.
  • Delegation of authority to the Board of Directors to increase the share capital with cancellation of the preferential subscription right by issuing Company shares reserved for members of a company savings plan.
  • Delegation of authority to the Board of Directors to increase the share capital by issuing shares with cancellation of the preferential subscription right in favour of a specific category of beneficiaries.
  • Authorisation to the Board of Directors to allocate free of charge existing or to be issued shares to certain employees and corporate officers of the Company and related companies.
  • Powers for formalities.

8.2.2Draft resolutions to be submitted to the Combined General Meeting

Within the remit of the Ordinary General Meeting
First resolution (Approval of the financial statements for the financial year ended December 31, 2022)

The General Meeting, acting with the quorum and majority required for Ordinary General Meetings, having read the reports of the Board of Directors and the Statutory Auditors relating to the financial statements for the financial year ended December 31, 2022, approves the financial statements for the said financial year as presented, as well as the transactions reflected in these financial statements and summarised in these reports.

Second resolution (Approval of the consolidated financial statements for the financial year ended December 31, 2022)

The General Meeting, acting with the quorum and majority required for Ordinary General Meetings, having read the reports of the Board of Directors and the Statutory Auditors relating to the consolidated financial statements for the financial year ended December 31, 2022, approves the consolidated financial statements for the said financial year as presented, as well as the transactions reflected in these financial statements and summarised in these reports.

Third resolution (Allocation of profit or loss for the financial year ended December 31, 2022)

The General Meeting, acting with the quorum and majority required for Ordinary General Meetings:

  • notes that the financial statements as at December 31, 2022 showed a net profit for the financial year of €326,479,873;
  • notes that the legal reserve, amounting to €31,449,646 as at December 31, 2022, exceeded the legal requirements;
  • notes that retained earnings as at December 31, 2022 is null;
  • notes that the distributable profit came to €326,479,873;
  • resolves to allocate a total amount of €226,576,784 to shareholders, representing a payment of €1.52 per share.

It is specified that, after distribution, retained earnings will be equal to €99,903,089.

For individuals who were tax residents in France, this dividend would be automatically subject to the single flat-rate deduction set out in Article 200 A of the French General Tax Code, unless the overall option for the progressive scale was chosen. In the event of an option for the progressive scale, this option would be entitled to the proportional reduction of 40% set out in Article 158(3) (2) of the French General Tax Code. The paying institution would make the flat-rate levy at source (not effecting full discharge) set out in Article 117 quater of the French General Tax Code, except for beneficiaries who were tax residents in France who had made a request for exemption under the conditions of Article 242 quater of the French General Tax Code.

All shareholders – and specially those domiciled or established outside France as regards the regulation applicable in the State of residence or establishment – are invited to contact their usual advisor so that he can determine, by means of a detailed analysis, the tax consequences of this distribution.

The General Meeting recalls, in accordance with the legal provisions, that the dividends distributed for the previous three financial years were as follows:

Financial year

Number of shares paid *

Total amount (in €)

Distributed dividend eligible for a 40% reduction mentioned in Article 158(3)(2) of the French General Tax Code (in €)

2019

0

0

0

2020

149,047,713

81,976,242

81,976,242

2021

149,352,439

224,028,659

224,028,659

* The number of shares paid excludes treasury shares.

The dividend will be detached from the share on May 22, 2023 and paid as of May 24, 2023. The treasury shares held by the Company on May 22, 2023 will not give rise to the right to distribution.

The General Meeting confers full powers on the Board of Directors to determine the final overall amount of the sums distributed according to the number of shares held by the Company on May 22, 2023 and make the necessary adjustments, based on the amount of dividends actually paid, and more generally do whatever is necessary to ensure the proper completion of the transactions covered by this resolution.

Fourth resolution (Authorisation of the Board of Directors to trade in the shares of the Company)

The General Meeting, acting with the quorum and majority required for Ordinary General Meetings, having read the report of the Board of Directors:

  • authorises the Board of Directors, with the option of subdelegation under the legislative and regulatory conditions, in accordance with the provisions of Articles L.22-10-62 et seq. and L.225-210 et seq. of the French Commercial Code, to purchase or cause to be purchased, on one or more occasions and at the times set by it, a number of the Company’s shares not exceeding: 
    • 10% of the total number of shares making up the share capital at any time, or
    • 5% of the total number of shares making up the share capital in the case of shares acquired by the Company in view of their conservation and subsequent delivery in payment or in exchange in the context of a merger, demerger or contribution transaction.
    • These percentages apply to a number of adjusted shares, as the case may be, depending on the transactions that may affect the share capital after this General Meeting. 
    • The acquisitions made by the Company may under no circumstances lead the Company to hold at any time whatsoever more than 10% of the shares comprising its share capital;
  • decides that this authorisation may be used to:
    • ensure liquidity and stimulate the securities market of the Company through an investment service provider acting independently under a liquidity agreement in line with market practice accepted by the Autorité des marchés financiers on June 22, 2021,
    • grant shares to corporate officers and employees of the Company and other Group entities, including (i) Company profit sharing, (ii) any stock option plan of the Company, pursuant to the provisions of Articles L.225-177 et seq. and L.22-10-56 et seq. of the French Commercial Code, or (iii) any savings plan pursuant to the provisions of Articles L.3331-1 et seq. of the French Labour Code or (iv) any free allocation of shares within the framework of the provisions of Articles L.225-197-1 et seq. and L.22-10-59 et seq. of the French Commercial Code, as well as to carry out any hedging transactions relating to these transactions, in accordance with the conditions laid down by the market authorities and at such times as the Board of Directors or the person acting on the delegation of the Board of Directors will assess,
    • deliver Company shares upon exercise of rights attached to securities giving entitlement, directly or indirectly, by redemption, conversion, exchange, presentation of a warrant or in any other manner to the allocation of Company shares within the framework of the regulations in force, as well as to carry out any hedging transactions relating to these transactions, according to the conditions laid down by the market authorities and at such times as the Board of Directors or the person acting on the delegation of the Board of Directors will assess,
    • retain the Company shares and subsequently deliver them as a payment or exchange in the context of any external growth, merger, demerger or contribution operations,
    • cancel all or part of the securities thus purchased,
    • implement any market practice that may be accepted by the Autorité des marchés financiers and, more generally, carry out any transaction in accordance with the regulations in force;
  • decides that the maximum unit purchase price will not exceed €16 per share, excluding charges. The Board of Directors may however, in the event of transactions concerning the Company’s capital, in particular changes in the nominal value of the share, increase in capital by incorporation of reserves followed by the creation and free allocation of shares, division or consolidation of securities, adjust the aforementioned maximum purchase price in order to take into account the impact of these transactions on the value of the Company’s share;
  • decides that the acquisition, sale or transfer of such shares may be effected and paid by any means authorised by the regulations in force, on a regulated market, on a multilateral trading facility, with a systematic or over-the-counter internaliser, including by way of acquisition or sale of blocks, by means of options or other derivative financial instruments, or warrants or, more generally, securities giving entitlement to Company shares, at such times as the Board of Directors will assess;
  • decides that the Board of Directors may not, except with the prior authorisation of the General Meeting, make use of this authorisation as from the filing by a third party of a draft public offer covering the securities of the Company, until the end of the offer period;
  • decides that the Board of Directors will have all powers, with the option of subdelegation under the legislative and regulatory conditions, in order, in accordance with the relevant legislative and regulatory provisions, to make the allocations and, where applicable, the permitted reallocations of shares redeemed for one or more of the objectives of the programme to one or more of its other objectives, or to their transfer, on the market or off the market.
  • All powers are therefore conferred on the Board of Directors, with the option of subdelegation under the legislative and regulatory conditions, to implement this authorisation, specify, if necessary, the terms and determine the terms and conditions under the legal conditions and of this resolution, and in particular to place all stock market orders, to enter into all agreements, in particular to keep the registers of purchases and sales of shares, make all declarations to the Autorité des marchés financiers or any other competent authority, prepare any information document, complete all formalities, and in general, do whatever is necessary.
  • The Board of Directors must inform, under the legal conditions, the General Meeting of the operations carried out under this authorisation;
  • decides that this authorisation, which cancels and replaces that granted by resolution eight of the General Meeting of May 17, 2022, is granted for a term of eighteen (18) months from the date of this General Meeting.
Fifth resolution (Approval of the special report of the Statutory Auditors on the regulated agreements and commitments referred to in Articles L.225-38 et seq. of the French Commercial Code)

The General Meeting ruling under the quorum and majority conditions required for Ordinary General Meetings, having read the Board’s report and the special report of the external auditors mentioned in Article L.225-40 referred to under the provision of Articles L.225-38 and following of the French Commercial Code, approves the report and acknowledges that no new convention in the scope of Article L.225-38 of the French Commercial Code has been signed in 2022.

Sixth resolution (Approval of the information mentioned in Section I of Article L.22-10-9 of the French Commercial Code on the compensation of corporate officers, non-directors pursuant to Article L.22-10-34 Section I of the French Commercial Code)

The General Meeting, acting with the quorum and majority required for Ordinary General Meetings, having read the corporate governance report referred to in Article L.225-37 of the French Commercial Code and appearing in section 8.1.3 of Chapter 8 of the Company’s 2022 Universal Registration Document, approves, pursuant to Article L.22-10-34 Section I of the French Commercial Code, the information mentioned in Article L.22-10-9 of the French Commercial Code on the compensation of non-executive corporate officers for the financial year ended December 31, 2022, as presented in the aforementioned report.

Seventh resolution (Approval of fixed, variable and exceptional items comprising the total compensation and benefits of any kind paid during the financial year ended December 31, 2022, or awarded in respect of the same financial year to Bernardo Sanchez Incera, Chairman of the Board of Directors, pursuant to Article L.22-10-34 Section II of the French Commercial Code)

The General Meeting, acting with the quorum and majority required for Ordinary General Meetings, having read the report on corporate governance referred to in Article L.225-37 of the French Commercial Code and appearing in section 8.1.3 of Chapter 8 of the Company’s 2022 Universal Registration Document, approves, pursuant to Article L.22-10-34 II of the French Commercial Code, the fixed, variable and exceptional items comprising the total compensation and benefits of any kind paid during the financial year ended December 31, 2022, or allocated for the same financial year to Bernardo Sanchez Incera, Chairman of the Board of Directors, as presented in the aforementioned report.

Eighth resolution (Approval of fixed, variable and exceptional items comprising the total compensation and benefits of any kind paid during the financial year ended December 31, 2022, or awarded in respect of the same financial year to Xavier Durand, Chief Executive Officer, pursuant to Article L.22-10-34 Section II of the French Commercial Code)

The General Meeting, acting with the quorum and majority conditions required for Ordinary General Meetings, having read the report on corporate governance referred to in Article L.225-37 of the French Commercial Code and appearing in Section 8.1.3 of Chapter 8 of the Company’s 2022 Universal Registration Document, approves, pursuant to Article L.22-10-34 Section II of the French Commercial Code, fixed, variable and exceptional items comprising the total compensation and benefits of any kind paid during the financial year ended December 31, 2022, or allocated for the same financial year to Xavier Durand, Chief Executive Officer of the Company, as presented in the aforementioned report.

Ninth resolution (Approval of the compensation policy applicable to the members of the Board of Directors, pursuant to Article L.22-10-8 of the French Commercial Code)

The General Meeting, acting with the quorum and majority conditions required for Ordinary General Meetings, having read the corporate governance report referred to in Article L.225-37 of the French Commercial Code and appearing in Section 8.1.3 of Chapter 8 of the Company’s 2022 Universal Registration Document, approves, pursuant to Article L.22-10-8 of the French Commercial Code, the compensation policy applicable to the members of the Board of Directors as determined by the Board of Directors of the Company on the proposal of the Appointments and Compensation Committee and presented in the aforementioned report.

Tenth resolution (Approval of the compensation policy applicable to the Chairman of the Board of Directors, pursuant to Article L.22-10-8 of the French Commercial Code)

The General Meeting, acting with the quorum and majority required for Ordinary General Meetings, having read the report on corporate governance, referred to in Article L.225-37 of the French Commercial Code and appearing in Section 8.1.3 of Chapter 8 of the Company’s 2022 Universal Registration Document, approves, pursuant to Article L.22-10-8 of the French Commercial Code, the compensation policy applicable to the Chairman of the Board of Directors of the Company, as determined by the Board of Directors of the Company on the proposal of the Appointments and Compensation Committee and presented in the aforementioned report.

Eleventh resolution (Approval of the compensation policy applicable to the Chief Executive Officer, pursuant to Article L.22-10-8 of the French Commercial Code)

The General Meeting, acting with the quorum and majority required for ordinary General Meetings, having read the report on corporate governance, referred to in Article L.225-37 of the French Commercial Code and appearing in Section 8.1.3 of Chapter 8 of the Company’s 2022 Universal Registration Document, approves, pursuant to Article L.22-10-8 of the French Commercial Code, the compensation policy applicable to the Chief Executive Officer of the Company, as determined by the Board of Directors of the Company on the proposal of the Appointments and Compensation Committee and presented in the aforementioned report.

Within the remit of the Extraordinary General Meeting
Twelfth resolution (Authorisation to the Board of Directors to reduce the share capital of the Company by cancellation of shares held in its own right)

The General Meeting, acting with the quorum and majority required for extraordinary general meetings, having read the report of the Board of Directors and the special report of the statutory auditors, and in accordance with the provisions of article L22-10-62 of the French Commercial Code:

  • authorises the Board of Directors, with the option of subdelegation under the legislative and regulatory conditions, to:
    • cancel, on its own decisions, on one or more occasions, up to a limit of 10% of the amount of the share capital existing on the date of cancellation (that is to say adjusted according to the transactions on the share capital since the adoption of this resolution), in a period of twenty-four months, all or part of the shares acquired by the Company under a share buyback programme authorised by the shareholders;
    • reduce the share capital accordingly and allocate the difference between the redemption price of the cancelled shares and their nominal value against the available premiums and reserves of its choosing.
  • confers all powers on the Board of Directors, with the option of subdelegation under the legislative and regulatory conditions, for the purpose of determining the final amount of capital reductions within the limits laid down by law and this resolution, fixing the terms thereof, recording their completion, carrying out all acts, formalities or declarations with a view to making final any reductions of capital that may be made pursuant to this authorisation and for the purpose of amending the articles of association accordingly;
  • decides that this authorisation, which cancels and replaces that granted by resolution sixteen of the General Meeting of 17 May 2022, is granted for a period of twenty-six (26) months from the date of this General Meeting.
Thirteenth resolution (Delegation of authority to the Board of Directors to increase the share capital with cancellation of the preferential subscription right by issuing Company shares reserved for members of a company savings plan)

The General Meeting, acting with the quorum and majority required for Extraordinary General Meetings, having read the report of the Board of Directors and the special report of the Statutory Auditors and pursuant to the provisions of Articles L.225-129-2, L.225-129-6, L.225-138 and L.225-138-1 of the French Commercial Code and those of Articles L.3332-18 et seq. of the French Labour Code:

  • delegates to the Board of Directors, with the option of subdelegation under the legislative and regulatory conditions, its authority, to proceed on one or more occasions, on its decisions alone, in the proportions and at the times it will assess, both in France and abroad, with the issuance of new shares, with this issue being reserved for employees, to eligible former employees and corporate officers of the Company and/or companies related to the Company within the meaning of the provisions of Article L.225-180 of the French Commercial Code and Article L.3344-1 of the French Labour Code, belonging to a company savings plan;
  • cancels, in favour of such members, the preferential subscription right of the shareholders to the shares which may be issued pursuant to this authorisation and waives all rights to the shares that may be granted free of charge on the basis of this resolution under the discount and/or contribution;
  • decides that the nominal amount of the capital increase which may be carried out, pursuant to this delegation of authority, may not exceed three million two hundred thousand euros (€3,200,000) or the equivalent in any other currency, on the specification that the nominal amount of any capital increase carried out pursuant to this delegation will be set off against the overall nominal ceiling for the capital increases in paragraph 2 of resolution eighteen of the General Meeting of May 17, 2022 and that the ceiling of this delegation will be common with that of resolution fourteen of this General Meeting. This ceiling will be increased, where applicable, by the nominal value of the shares to be issued in order to preserve in accordance with the laws and regulations and, as the case may be, the applicable contractual provisions the rights of holders of securities or other rights giving access to the Company’s capital;
  • decides that the subscription price of the securities issued pursuant to this delegation will be determined under the conditions laid down by the provisions of Article L.3332-19 of the French Labour Code, on the specification that the maximum discount compared to an average of the quoted prices of the share during the twenty trading sessions preceding the decision setting the opening date of the subscription may therefore not exceed 30% (or 40% when the unavailability period provided for in the plan pursuant to Articles L.3332-25 and L.3332-26 of the French Labour Code is greater than or equal to ten years). However, when implementing this delegation, the Board of Directors may reduce the amount of the discount on a case-by-case basis, in particular due to tax, social security or accounting constraints applicable in the countries where the Group entities involved in the capital increase operations are located. The Board of Directors may also decide to allocate shares free of charge to the subscribers of new shares, in substitution of the discount and/or in respect of the contribution;
  • decides that the Board of Directors will have all powers, with the option of subdelegation under the legislative and regulatory conditions, to implement this delegation, within the limits and under the conditions specified above for the purpose, in particular, to:
    • decide on the issuance of new shares of the Company,
    • establish the list of companies whose employees, former employees and eligible corporate officers may benefit from the issue, set the conditions that the beneficiaries must fulfil in order to be able to subscribe, directly or through a mutual investment fund, to the shares that will be issued under this delegation of authority,
    • set the amounts of these issues and determine the subscription prices of the securities and the subscription dates, terms and conditions of each issue and conditions of subscription, payment and delivery of the shares issued under this delegation of authority, as well as the date, even retroactive, from which the new shares will be exercised,
    • decide, pursuant to Article L.3332-21 of the French Labour Code, on the allocation, free of charge, of shares to be issued or already issued, in respect of the contribution and/or, where applicable, the discount, provided that taking into account their financial equivalent, valued at the subscription price, has the effect of exceeding the limits provided for in Article L.3332-11 of the French Labour Code and, in the event of the issuance of new shares in respect of the discount and/or the contribution, to incorporate into the capital the reserves, profits or share premiums necessary for the payment of such shares,
    • set the time limit for subscribers to pay up their shares,
    • record or have recorded the completion of the capital increase up to the amount of the shares actually subscribed,
    • at its sole initiative, charge the costs of the share capital increase(s) against the premiums relating to these increases and deduct from this amount the sums necessary to raise the legal reserve to one tenth of the new capital after each increase,
    • in general, take all measures and carry out all formalities necessary for the issue and listing of the shares issued and further to the capital increases and the corresponding amendments to the Articles of Association pursuant to this delegation;
  • decides that the Board of Directors may not, except with the prior authorisation of the General Meeting, make use of this delegation of authority as from the filing by a third party of a draft public offer covering the securities of the Company, until the end of the offer period;
  • decides that this delegation, which cancels and replaces that granted by resolution twenty-two of the General Meeting of May 17, 2022, is granted for a period of twenty-six (26) months from the date of this General Meeting.
Fourteenth resolution (Delegation of authority to the Board of Directors to increase the share capital by issuing shares with cancellation of the preferential subscription right in favour of a specific category of beneficiaries)

The General Meeting, acting with the quorum and majority required for Extraordinary General Meetings, having read the report of the Board of Directors and the special report of the Statutory Auditors and in accordance with the provisions of Articles L.225-129 et seq. and L.225-138 of the French Commercial Code:

  • delegates, with the option of subdelegation under the legislative and regulatory conditions, its authority to proceed, on one or more occasions, on its decisions alone, in such proportions and at such times as it will assess, both in France and abroad, with the issue new shares, the issue being reserved for one or more of the categories of beneficiaries meeting the following characteristics: (i) employees and/or corporate officers of the Company and/or companies related to the Company within the meaning of the provisions of Article L.225-180 of the French Commercial Code and Article L.3344-1 of the French Labour Code and having their registered office outside France; (ii) one or more mutual funds or other entity governed by French or foreign law, with or without legal personality, subscribing on behalf of persons designated in paragraph (i) above, and (iii) one or more financial institutions mandated by the Company to propose to the persons designated in paragraph (i) above a system of savings or shareholding comparable to those offered to the employees of the Company in France;
  • cancels, in favour of such beneficiaries, the preferential subscription right of the shareholders to the shares that may be issued under this delegation;
  • acknowledges that this delegation entails the waiver, by the shareholders, of their preferential subscription rights, of the capital securities of the Company to which the securities issued on the basis of this delegation may give right;
  • decides that the nominal amount of the capital increase which may be carried out, pursuant to this delegation of authority, may not exceed three million two hundred thousand euros (€3,200,000) or the equivalent in any other currency or currency unit established by reference to several currencies, on the specification that the nominal amount of any capital increase carried out pursuant to this resolution will be set off against the overall nominal ceiling for the capital increases in paragraph 2 of resolution eighteen of the General Meeting of May 17, 2022 and that the ceiling of this delegation will be common with that of resolution thirteen of this General Meeting. This ceiling will be increased, where applicable, by the nominal value of the shares to be issued in order to preserve in accordance with the laws and regulations and, as the case may be, the applicable contractual provisions the rights of holders of securities or other rights giving access to the Company’s capital;
  • decides that the subscription price of the securities issued pursuant to this delegation may not be more than 30% or, where applicable, 40% of the average of the quoted prices of the share during the twenty trading days preceding the date of the decision setting the opening date of the subscription, nor higher than this average. However, when implementing this delegation, the Board of Directors may reduce the amount of the discount on a case-by-case basis, in particular due to tax, social security or accounting constraints applicable in the countries where the Group entities involved in the capital increase operations are located. Furthermore, in the event of a transaction carried out under this resolution at the same time as a transaction carried out pursuant to resolution thirteen of this General Meeting, the subscription price of the shares issued under this resolution may be identical to the subscription price of the shares issued on the basis of resolution thirteen of this General Meeting;
  • decides that the Board of Directors will have all powers, with the option of subdelegation under the legislative and regulatory conditions, to implement this delegation, within the limits and under the conditions specified above for the purpose, in particular, to:
    • determine the list of beneficiaries, within the categories of beneficiaries defined above, of each issue and the number of shares to be subscribed by each of them, under this delegation of authority,
    • set the amounts of these issues and determine the prices and the subscription dates, terms and conditions of each issue and conditions of subscription, payment and delivery of the shares issued under this delegation of authority, as well as the date, even retroactive, from which the new shares will be exercised,
    • set the time limit for subscribers to pay up their shares,
    • record or have recorded the completion of the capital increase up to the amount of the shares actually subscribed,
    • at its sole initiative, charge the costs of the share capital increase(s) against the premiums relating to these increases and deduct from this amount the sums necessary to raise the legal reserve to one tenth of the new capital after each increase,
    • in general, take all measures and carry out all formalities necessary for the issue and listing of the shares issued and further to the capital increases and the corresponding amendments to the Articles of Association pursuant to this delegation;
  • decides that the Board of Directors may not, except with the prior authorisation of the General Meeting, make use of this delegation of authority as from the filing by a third party of a draft public offer covering the securities of the Company, until the end of the offer period;
  • decides that this delegation, which cancels and replaces the delegation granted by resolution twenty-three of the General Meeting of May 17, 2022, is granted for a period of eighteen (18) months from the date of this General Meeting.
Fifteenth resolution (Authorisation to the Board of Directors to allocate free of charge existing or to be issued shares to certain employees and corporate officers of the Company and related companies)

The General Meeting, acting with the quorum and majority required for Extraordinary General Meetings, having read the report of the Board of Directors and the special report of the Statutory Auditors:

  • authorises the Board of Directors, within the framework of the provisions of Articles L.225-197-1 et seq. and L.22-10-59 et seq. of the French Commercial Code, to allocate, free of charge, on one or more occasions, existing or to be issued shares of the Company, for the benefit of certain salaried employees as well as corporate officers of the Company or companies related to it under the conditions defined in Article L.225-197-2 of the French Commercial Code;
  • decides that the total number of free shares allocated under this authorisation may not exceed 1% of the number of shares comprising the share capital of the Company on the date of the decision to allocate them by the Board of Directors, and that the cumulative nominal amount of the capital increases likely to result therefrom shall be deducted from the overall nominal ceiling provided for the capital increases in paragraph 2 of the resolution eighteen of the General Meeting of May 17, 2022 or, where applicable, the amount of the overall ceiling potentially provided for by a resolution of the same nature which may replace the said resolution during the period of validity of this delegation;
  • decides that the total number of free shares allocated under this authorisation to the Company’s corporate officers may not represent more than 20% of the free shares allocated under this authorisation;
  • decides that the final award of these shares may be subject, in part or in full, to the achievement of performance conditions set by the Board of Directors, it being specified that the final award of free shares to the executive corporate officers of the Company will be subject in full to the achievement of the performance conditions set by the Board of Directors;
  • decides that the allocation of shares to their beneficiaries shall become final at the end of a minimum vesting period of three years and that these shares shall not be subject to any retention obligation. The final allocation of the shares and the right to freely transfer them shall nevertheless be acquired by the beneficiary if the latter were to be affected by one of the cases of invalidity referred to in Article L.225-197-1 of the French Commercial Code;
  • takes note that this authorisation automatically entails, in favour of the beneficiaries of the allocated free shares, express waiver by the shareholders (i) of their preferential subscription right to the free shares to be issued, (ii) to the portion of the reserves, profits or premiums that will be incorporated into the capital in the event of a free allocation of new shares and (iii) any right to existing free shares. The corresponding capital increase will be definitively carried out solely due to the definitive allocation of the shares to the beneficiaries;
  • confers on the Board of Directors, with the option of sub-delegation to the extent authorised by law, all powers to implement, within the limits set out above, this resolution and in particular to:
    • determine whether the free shares are new shares and/or existing shares; determine the identity of the beneficiaries of the allocation of shares and the number of shares allocated to each of them,
    • set the dates and terms of allocation of the shares, in particular the period at the end of which these allocations will be final as well as, where applicable, the retention period required for each beneficiary under the conditions set out above,
    • determine, where applicable, the conditions particularly related to the performance of the Company or its Group as well as the allocation criteria according to which the shares will be allocated,
    • proceed during the vesting period, where applicable, with any adjustments to the number of free shares allocated based on any transactions on the capital of the Company, so as to preserve the rights of the beneficiaries, it being specified that the shares allocated pursuant to these adjustments shall be deemed allocated on the same day as the shares initially allocated,
    • more generally, record the final allocation dates and the dates from which the shares may be freely transferred taking into account the legal restrictions, enter into all agreements, draw up all documents, carry out all formalities and make all declarations to all bodies and do everything otherwise necessary;
  • decides that the Board of Directors shall also have, with the option of sub-delegation provided for in the legal conditions, all powers to allocate, where applicable, in the event of the issue of new shares, against reserves, profits or issue premiums, the sums necessary for the payment of the said shares, record the completion of the capital increases carried out pursuant to this authorisation, proceed with the corresponding amendments to the Articles of Association and generally carry out all necessary acts and formalities;
  • decides that the Board of Directors may not, except with the prior authorisation of the General Meeting, make use of this delegation of authority as from the filing by a third party of a draft public offer covering the securities of the Company, until the end of the offer period;
  • decides that this authorisation, which cancels and replaces the authorisation granted by resolution twenty-eight of the General Meeting of May 12, 2021, is granted for a period of eighteen (38) months from the date of this General Meeting.
Sixteenth resolution (Powers for formalities)

The General Meeting, acting with the quorum and majority required for ordinary and Extraordinary General Meetings, gives all powers to the bearer of copies or extracts of these minutes to fulfil all legal formalities.

8.3 Statutory auditors’ special report on regulated agreements

This is a translation into English of the Statutory auditors’ special report on regulated agreements. This statutory auditors’ report includes information required by European regulation and French law, such as information about the appointment of the statutory auditors or verification of the management report and other documents provided to shareholders. This report should be read in conjunction with, and construed in accordance with, French law and professional auditing standards applicable in France.

To the Annual General Meeting of COFACE SA,

In our capacity as statutory auditors of your company, we hereby present to you our report on regulated agreements.

It is our responsibility to report to you, on the basis of the information provided to us, the characteristics, the main terms and conditions and the reasons justifying the interest for the Company, of the agreements brought to our attention or which we may have identified in the course of our audit. We are not required to comment as to whether they are beneficial or appropriate or to ascertain the existence of other agreements. It is your responsibility, in accordance with Article R.225-31 of the French Commercial Code (code de commerce), to evaluate the advantages of entering into these agreements prior to their approval.

It is moreover our responsibility to report to you, where applicable, the information required by Article R.225-31 of the French Commercial Code (code de commerce) relating to the performance, during the past financial year, of the agreements already approved by the Shareholders’ Meeting.

We performed those procedures that we considered necessary to comply with the professional guidance issued by the French National Auditing Body (Compagnie nationale des commissaires aux comptes) relating to this mission. These procedures consisted in verifying that the information provided to us was consistent with the reference documents it came from.

Agreements to be approved by the annual general meeting
Agreements authorised and entered into during the last financial year

We hereby inform you that we have not been advised of any agreements authorized and entered into during the last financial year that should be submitted to the approval of the General Shareholders’ Meeting in accordance with Articles R.322-7 of the French Code of Insurance (code des assurances) and L. 225-38 of the French Commercial Code (code de commerce). 

Agreements already approved by the annual general meeting
Agreements approved during prior years and that continued to be implemented during the year under review

In accordance with Articles R-322-7 of the French Code of Insurance and R.225-30 of the French Commercial Code (code de commerce), we have been informed that the following agreements, already approved by the Annual General Meeting in previous years, continued to be implemented during the past year.

A guarantee of the Compagnie française d’assurance pour le commerce extérieur to COFACE SA for payment of the subordinated debt
Nature and purpose:

On March 27, 2014, COFACE SA issued a subordinated debt in the form of bonds for a nominal amount of €380 million (380,000,000). On September 23rd, 2022, COFACE SA partly repaid the subordinated debt which nominal amount is €226,600,600 euros as of today.

In order to improve the rating of COFACE SA’s subordinated debt issuance and thus its price, Compagnie Française d’Assurance pour le Commerce Extérieur issued a guarantee that improved the rating of the issuance by 2 notches (as a reminder, the issuance was rated Baa1 / A by Moody’s and Fitch, while without this guarantee the rating would have been Baa3 / BBB).

Terms and conditions:

This guarantee was approved by the Board of Directors of COFACE SA on 14 February 2014.

Remuneration conditions for this guarantee: the price of the guarantee was thus set at 0.2% based on the total amount, representing a financial expense of four hundred fifty-three thousand and two hundred euros (€453,200) euros in respect of the 2022 financial year for COFACE SA.

Parties involved:

COFACE SA holds 99.99% of the capital of Compagnie Française d’Assurance pour le Commerce Extérieur at December 31, 2022.

COFACE SA and Compagnie Française d’Assurance pour le Commerce Extérieur have a joint representative, Xavier Durand (Chief Executive Officer of COFACE SA and Chairman and Chief Executive Officer of Compagnie Française d’Assurance pour le Commerce Extérieur).

Paris La Défense, on April 5th, 2023

The Statutory Auditors

French original signed by

Mazars

Jean-Claude PAULY

Partner

Deloitte & Associés

Jérôme LEMIERRE

Partner

8.4 Statutory auditors’ report on the reduction of capital

This is a translation into English of the statutory auditors’ report on the financial statements of the Company issued in French and it is provided solely for the convenience of English speaking users. This statutory auditors’ report includes information required by European regulation and French law, such as information about the appointment of the statutory auditors or verification of the management report and other documents provided to shareholders. This report should be read in conjunction with, and construed in accordance with, French law and professional auditing standards applicable in France.

Annual General Shareholders’ Meeting of May 16th, 2023 Resolution 12th

To the Annual General Meeting of COFACE SA,

In our capacity as Statutory Auditors of your company and in execution of the mission provided for in Article L. 22-10-62 of the French Commercial Code in the event of a reduction in capital by cancelling shares purchased, we have prepared this report intended to inform you of our assessment of the terms and conditions for the proposed capital reduction. 

Your Board of Directors proposes that you delegate to it, for a period of 26 months from the date of this Meeting, all powers to cancel, within the limit of 10% of the share capital per 24-month period, the shares purchased for the implementation of an authorisation to purchase its own shares by your company in accordance with the provisions of the aforementioned article.

We performed those procedures that we considered necessary to comply with the professional guidance issued by the French National Auditing Body (Compagnie nationale des commissaires aux comptes) relating to this mission. These procedures are designed to examine whether the terms and conditions for the proposed capital reduction, which is not likely to undermine the equality of shareholders, are legitimate. 

We have no matters to report regarding the terms and conditions for the proposed capital reduction.

Paris La Défense, on April 5th, 2023

The Statutory Auditors

French original signed by

Mazars

Jean-Claude PAULY

Partner

Deloitte & Associés

Jérôme LEMIERRE

Partner

8.5 Statutory auditors’ report on the capital increase with cancellation of preferential subscription rights reserved for employees enrolled in a company savings plan

This is a translation into English of the Statutory auditors’ report on the capital increase with cancellation of preferential subscription rights reserved for employees enrolled in a company savings plan issued in French and it is provided solely for the convenience of English speaking users. This statutory auditors’ report includes information required by European regulation and French law, such as information about the appointment of the statutory auditors or verification of the management report and other documents provided to shareholders. This report should be read in conjunction with, and construed in accordance with, French law and professional auditing standards applicable in France.

Annual General Shareholders’ Meeting of May 16th, 2023 – resolution 13th

To the Annual General Meeting of COFACE SA,

In our capacity as Statutory Auditors of your company and in execution of the mission provided for in Articles L.225-135 et seq. of the French Commercial Code, we hereby present our report on the proposal to delegate the Board of Directors the authority to approve a capital increase by issuing ordinary shares without preferential subscription rights, reserved for current employees, former employees and eligible corporate officers, of the Company and/or companies related to the Company within the meaning of the provisions of Article L.225-180 of the French Commercial Code and Article L.3344-1 of the French Labour Code, members of a company savings plan, for a maximum amount of €3,200,000, an operation on which you are called upon to vote. 

Your Board of Directors hereby informs you that this nominal amount will be charged against the maximum limit set for capital increases in the 2nd paragraph of the 18th resolution (€115,000,000) of the General Shareholders’ Meeting of May, 17th 2022 and that the maximum limit for this delegation will be the same as that of the 14th resolution of this General Meeting. 

This capital increase is subject to your approval in accordance with the provisions of Articles L.225-129-6 of the French Commercial Code and L.3332-18 et seq. of the French Labour Code. 

On the basis of its report, your Board of Directors proposes that you delegate it the authority, for a period of twenty-six months from this General Meeting, to approve a capital increase and to waive your preferential subscription rights to the ordinary shares to be issued. Where appropriate, the Board will be responsible for setting the final terms and conditions of this transaction. 

The Board of Directors is responsible for preparing a report in accordance with Articles R.225-113 and R.225-114 of the French Commercial Code. Our role is to express an opinion on the fairness of the quantified information taken from the financial statements, on the proposal to cancel the preferential subscription right and on certain other information concerning the issue that is provided in this report.

We performed those procedures that we considered necessary to comply with the professional guidance issued by the French National Auditing Body (Compagnie nationale des commissaires aux comptes) relating to this mission. These procedures consisted in verifying the content of the Board of Directors’ report on this transaction and the methods for determining the price of shares to be issued.

Subject to the subsequent review of the terms and conditions of the capital increase decided, we have no matters to report on the methods for determining the issue price of the ordinary shares to be issued as outlined in the Board of Directors’ report.

As the final terms and conditions under which the capital increase would be carried out are not yet determined, we express no opinion on these nor, consequently, on the proposal to waive the preferential subscription right made to you.

In accordance with Article R.225-116 of the French Commercial Code, we will prepare an additional report, where applicable, when this delegation is used by your Board of Directors.

Paris La Défense, on April 5th, 2023

The Statutory Auditors

French original signed by

Mazars

Jean-Claude PAULY

Partner

Deloitte & Associés

Jérôme LEMIERRE

Partner

8.6 Statutory auditors’ report on the capital increase with cancellation of preferential subscription rights reserved for a specified category of beneficiaries

This is a translation into English of the Statutory auditors’ report on the capital increase with cancellation of preferential subscription rights issued in French and it is provided solely for the convenience of English speaking users. This statutory auditors’ report includes information required by European regulation and French law, such as information about the appointment of the statutory auditors or verification of the management report and other documents provided to shareholders. This report should be read in conjunction with, and construed in accordance with, French law and professional auditing standards applicable in France.

Annual General Shareholders’ Meeting of May 16th, 2023 – resolution 14th

To the Annual General Meeting of COFACE SA, 

In our capacity as Statutory Auditors of your company and in execution of the mission provided for in Articles L.225-135 et seq.of the French Commercial Code, we hereby present our report on the proposal to delegate to the Board of Directors the authority to approve a capital increase by issuing ordinary shares without preferential subscription rights, for a maximum amount of €3,200,000, an operation on which you are called upon to vote.

Your Board of Directors hereby informs you that this nominal amount will be charged against the maximum limit set for capital increases in the 2nd paragraph of the 18th resolution (€115,000,000) of the General Shareholders’ Meeting of May, 17th 2022 and that the maximum limit for this delegation will be the same as  the 13th resolution of this General meeting.

This issue shall be reserved for:

  • employees and/or corporate officers of the Company and/or companies related to the Company within the meaning of the provisions of Article L.225-180 of the French Commercial Code and Article L.3344-1 of the French Labour Code and having their registered office outside France;
  • one or more mutual funds or other entity under French or foreign law, regardless of whether or not they have legal personality, subscribing on behalf of persons referred to in paragraph (i) above;
  • one or more financial establishments mandated by the Company to propose to those persons referred to in paragraph (i) above, a savings or shareholding scheme comparable to those proposed to the Company’s employees in France.

On the basis of its report, your Board of Directors proposes that you delegate it the authority, for a period of eighteen months, to approve a capital increase and to waive your preferential subscription rights to the ordinary shares to be issued. Where appropriate, the Board will be responsible for setting the final terms and conditions of this transaction. 

The Board of Directors is responsible for preparing a report in accordance with Articles R.225-113 and R.225-114 of the French Commercial Code. Our role is to express an opinion on the fairness of the quantified information taken from the financial statements, on the proposal to cancel the preferential subscription right and on certain other information concerning the issue that is provided in this report.

We performed those procedures that we considered necessary to comply with the professional guidance issued by the French National Auditing Body (Compagnie nationale des commissaires aux comptes) relating to this mission. These procedures consisted in verifying the content of the Board of Directors’ report on this transaction and the methods for determining the price of shares to be issued.

Subject to the subsequent review of the terms and conditions of the capital increase decided, we have no matters to report on the methods for determining the issue price of the ordinary shares to be issued as outlined in the Board of Directors’ report.

As the final terms and conditions under which the capital increase would be carried out are not yet determined, we express no opinion on these nor, consequently, on the proposal to waive the preferential subscription right made to you.

In accordance with Article R.225-116 of the French Commercial Code, we will prepare an additional report, where applicable, when this delegation is used by your Board of Directors.

Paris La Défense, on April 5th, 2023

The Statutory Auditors

French original signed by

Mazars

Jean-Claude PAULY

Partner

Deloitte & Associés

Jérôme LEMIERRE

Partner

8.7 Statutory auditors’ report on the authorisation to award bonus shares, whether existing or to be issued

This is a translation into English of the Statutory auditors’ report on the authorisation to award bonus shares, whether existing or to be issued issued in French and it is provided solely for the convenience of English speaking users. This statutory auditors’ report includes information required by European regulation and French law, such as information about the appointment of the statutory auditors or verification of the management report and other documents provided to shareholders. This report should be read in conjunction with, and construed in accordance with, French law and professional auditing standards applicable in France.

Annual General Shareholders’ Meeting of May 16th, 2023 – resolution 15th

To the Annual General Meeting of COFACE SA,

In our capacity as statutory auditors of your company and in execution of the mission provided for in Article L.225-197-1 of the French Commercial Code (code de commerce), we hereby present to you our report on the plan to authorise the award of bonus shares, whether existing or to be issued, to employees and corporate officers of the Company and companies related to the Company as defined in Article L.225-197-2 of the French Commercial Code (code de commerce), an operation on which you are called upon to vote.

The total number of bonus shares awarded under this authorisation may not exceed 1% of the number of shares comprising the Company’s share capital at the date of the Board of Directors’ decision to grant them, and the cumulative nominal amount of any capital increases that may result from this authorisation will be deducted from the overall maximum limit provided for in paragraph 2 of the eighteenth resolution of the Shareholders’ Meeting of May 17, 2022 or, where applicable, on the amount of any overall limit provided for by a similar resolution that may replace said resolution during the period during which this authorisation applies. The total number of bonus shares awarded by virtue of this authorisation to the Company’s Executive Directors may not represent more than 20% of the bonus shares awarded under this authorisation.

The final award of the shares may be subject, in part or in whole, to the achievement of performance conditions set by the Board of Directors, being specified that the final allocation of bonus shares awarded to the Company’s Executive Directors will be subject to the achievement of performance conditions set by the Board of Directors.

On the basis of its report, your Board of Directors proposes that you authorise it, for a period of thirty-eight months from this General Meeting to award bonus shares, whether existing or to be issued.

The Board of Directors is responsible for preparing a report on this transaction that it wishes to carry out. Our role is to report, if applicable, our observations on the information provided to you with regard to the intended transaction. 

We performed those procedures that we considered necessary to comply with the professional guidance issued by the French National Auditing Body (Compagnie nationale des commissaires aux comptes) relating to this mission. The procedures consisted in particular in verifying that the terms and conditions of the transaction and information in the Board of Directors’ report comply with the provisions of the law.

We have no matters to report on the information provided in the Board of Directors’ report on the intended transaction to authorise the award of bonus shares.

Paris La Défense, on April 5th, 2023

The Statutory Auditors

French original signed by

Mazars

Jean-Claude PAULY

Partner

Deloitte & Associés

Jérôme LEMIERRE

Partner

COFACE SA 
CORPORATE NAME

MEMORANDUM 
& ARTICLES OF ASSOCIATION

SELECTED FINANCIAL INFORMATION 
OVER 3 YEARS

FITch - moody's - am best 
GROUP RATINGS

(1)
Benchmark for Willis Towers Watson on a panel of 30 companies in the SBF 80 comparable to COFACE in terms of headcount, turnover and/or geographic scope

9. ADDITIONAL INFORMATION

COFACE SA’s Articles of Association and Internal Rules are available on the website: https://www.coface.com/fr/Le-groupe/Notre-organisation.

9.1Memorandum and Articles of Association

9.1.1Legal corporate name

The legal corporate name of the Company is “COFACE SA”.

9.1.2Location and registration number

The Company is registered in the Nanterre Trade and Companies Register under number 432 413 599.

The Legal Entity Identifier (LEI) is 96950025N07LTJYFSN57.

9.1.3Date of formation and term

Date of incorporation

The Company was incorporated on August 7, 2000.

Term of the Company

The Company was formed for a term of 99 years as of the date of its registration in the Trade and Companies Register, save for early dissolution or extension.

9.1.4Head office, legal form and applicable laws

Head office: 1, place Costes et Bellonte, 92270 Bois-Colombes, France.

Telephone number of head office: + 33 (0)1 49 02 20 00.

Legal form and applicable laws: limited company (société anonyme) under French law with a Board of Directors.

9.1.5Articles of Association

The Company’s Articles of Association were prepared in compliance with the legal and regulatory provisions applicable to limited companies with a Board of Directors.

Corporate purpose (Article 2 of the Articles of Association)

The Company’s purpose is to perform any civil or commercial operations involving moveable and real estate property and financial operations, to take all direct or indirect shareholdings and, in general, to perform any operations directly or indirectly relating to its corporate purpose.

Articles of Association relating to the management and administrative bodies – Internal Rules of the Board of Directors
(a) Articles of Association
Board of Directors (see also Section 2.1 “Composition and operation of the Board of Directors and its specialised committees”)
Composition of the Board of Directors (Article 12 of the Articles of Association)

The Company is administered by a Board of Directors consisting of at least three (3) and at most eighteen (18) members.

Term of office – Age limit – Replacement (Article 12 of the Articles of Association)

Board members serve for a term of four years.In case of a vacancy owing to the death or resignation of one or more directors representing the shareholders, the Board of Directors may temporarily replace these members between two Shareholders’ Meetings, in compliance with the terms of Article L.225-24 of the French Commercial Code.The Board must make temporary appointments within three months following the date of the vacancy if the number of directors falls below the minimum required by the Articles of Association, without however being lower than the legal minimum.

The number of directors who are aged 70 or over cannot exceed one third of the total number of serving directors.Should this proportion be exceeded, the oldest director shall be deemed to have resigned as of the end of the next Ordinary Shareholders’ Meeting.

The term of office of a director expires at the end of the Ordinary Shareholders’ Meeting called to approve the accounts for the previous financial year and is held in the year during which the director’s term of office is due to expire.

If a director is appointed to replace another director during that director’s term, they shall only serve for the remaining duration of their predecessor’s term.

Directors may be re-elected without limitation, subject to legal and statutory provisions, in particular with regards to their age.

Directors are personally liable for fulfilling their mandate, in accordance with commercial laws.

Directors’ shares (Article 12 of the Articles of Association)

Each director must hold at least 500 of the Company’s shares.

Chairman of the Board of Directors (Article 13 of the Articles of Association)

The Board appoints a Chairman from among the individuals serving as members for a period which cannot exceed their term of office as director.

The Chairman can be re-elected.

The age limit for performing the duties of Chairman is 70.When a serving Chairman reaches this age, they are considered to have resigned at the Ordinary Shareholders’ Meeting called to approve the financial statements for the financial year during the Chairman reaches this age.

The Chairman of the Board of Directors organises and directs the work of the Board of Directors and reports on it to the Shareholders’ Meeting.They oversee the effective operation of the Company’s corporate bodies and, in particular, ensures that the directors are in a position to fulfil their duties.

Should the Chairman be temporarily indisposed or in the event of their death, the statutory and regulatory provisions are applicable.

Should the Board consider it necessary, it may appoint one or more Vice-Chairmen from the directors, who will, in the order of their own appointment, chair Board meetings in the event that the Chairman is absent or indisposed.

In the event that the Chairman or Vice-Chairmen are absent or indisposed, the Board appoints, for each meeting, one of the members present to chair the proceedings.

The amount and procedures for the compensation of the Chairman and Vice-Chairmen are set by the Board of Directors.

Exercise of general management (see also Section 2.2 “Chief Executive Officer and Group general management specialised committees”)
General management (Article 14 of the Articles of Association)

The general management of the Company is handled either by the Chairman of the Board of Directors, or by another individual appointed by the Board of Directors and bearing the title of Chief Executive Officer (CEO).

The Board appoints its Chairman and decides by a simple majority whether to grant them the powers of Chief Executive Officer or whether to grant these powers to another person.This decision on whether the offices of Chairman and Chief Executive Officer should be held by the same person or by two separate persons, as well as any subsequent change to this arrangement, shall remain in force until a decision is taken to the contrary by the Board of Directors, which may then decide, by a simple majority, to opt for the other arrangement for the exercise of general management.The Board of Directors of the Company keeps the shareholders and third parties informed about this change in accordance with applicable law.

Where general management is handled by the Chairman, the legal and statutory provisions of the Company’s Articles of Association related to the Chief Executive Officer apply to them.

Chief Executive Officer (Article 15 of the Articles of Association)

The Board of Directors determines the duration of the Chief Executive Officer’s term and their compensation.

The age limit for performing the duties of Chief Executive Officer is 65.Should a Chief Executive Officer exceed this age limit, they are considered to have resigned at the Shareholders’ Meeting called to approve the accounts for the financial year during which that CEO turned 65.

The Chief Executive Officer is invested with the broadest powers to act under all circumstances on behalf of the Company.They exercise these powers within the limits of the corporate purpose and subject to those powers that the law expressly grants to Shareholders’ Meetings and to the Board of Directors.

They represent the Company in its dealings with third parties.Provisions of the Articles of Association or decisions of the Board of Directors limiting the powers of the Chief Executive Officer are unenforceable against third parties.

If the Chief Executive Officer does not assume the duties of the Chairman of the Board of Directors and is not a director, they attend Board meetings in a consultative capacity.

Deputy Chief Executive Officer (Article 16 of the Articles of Association)

At the request of the Chief Executive Officer, the Board of Directors can appoint an individual to assist the CEO, with the title of Deputy Chief Executive Officer.

The Board of Directors determines the compensation of the Deputy CEO.

The age limit for performing the duties of Deputy CEO is 65.If a serving Deputy CEO attains this age, they are considered to have resigned at the Ordinary Shareholders’ Meeting called to approve the accounts for the financial year in which they turned 65.

In collaboration with the CEO, the Board determines the scope and duration of the powers conferred upon the Deputy CEO.The Deputy CEO has the same powers vis-à-vis third parties as the CEO.

If the Deputy CEO is not a director, they attend Board meetings in a consultative capacity.

Operation of the Board of Directors (Article 18 of the Articles of Association)

The Board of Directors meets as often as required in the interests of the Company, and at least once per quarter.

Board meetings are convened by the Chairman.However, directors representing at least one third of the Board members may convene a meeting of the Board, detailing the agenda, if there has been no meeting for more than two months.Where the duties of CEO are not performed by the Chairman, the Chief Executive Officer may also ask the Chairman to convene a Board meeting to consider a fixed agenda.Board meetings are held either at the registered office or any other location indicated in the convening notice.The convening notice to attend is in the form of a simple letter or e-mail addressed to the Board members.If there is a degree of urgency, the convening notice may be given by any other appropriate means, including verbally.

Meetings of the Board of Directors are chaired by the Chairman of the Board of Directors or, should they be absent, by the oldest director present, or by one of the Vice-Chairmen, if there are any.

A director may appoint another director, by means of a letter, to represent them at a meeting of the Board of Directors.

Each director may have only one proxy vote during a given meeting by virtue of the foregoing paragraph.

The meeting can only pass resolutions if at least half of the serving directors are present.

Decisions are taken by means of majority voting by those directors present or represented.

In the event of a split vote, the director chairing the meeting has the casting vote.

In compliance with applicable statutory and regulatory provisions, the Board’s Internal Rules may provide that directors who take part in a meeting via video conferencing or other means of telecommunication that meet the technical requirements set by the prevailing statutory and regulatory provisions are deemed to be present for the purposes of the calculation of quorum and majority.

Certain decisions of the Board of Directors may, under the conditions provided for by the laws and regulations in force, and in particular Article L.225-37 of the French Commercial Code, be made by consulting the directors in writing.

The Board may appoint a secretary who may be, but need not be, one of its members.

At the suggestion of its Chairman, the Board may decide to form among its members, or with the involvement of persons who are not directors, committees or commissions in charge of looking into matters that it or its Chairman shall refer to them for assessment; these committees or commissions exercise their powers under its responsibility.

The minutes of each meeting shall state the names of the directors who are present or represented and the names of the directors who are absent, to act as evidence towards third parties.

Powers of the Board of Directors (Article 21 of the Articles of Association)

The Board of Directors determines the Company’s business strategy and oversees its implementation.Subject to powers expressly assigned to the Shareholders’ Meetings and within the limitations of the corporate purpose, the Board deliberates on all matters relating to the effective operation of the Company and decides on all matters that affect it.The Board of Directors carries out the inspections and verifications it considers necessary.The Chairman or the Chief Executive Officer must send each director all the documents and information needed to fulfil their duties.

The Rules of Procedure of the Board of Directors determine which decisions are to be submitted to the prior authorisation of the Board of Directors, in addition to those which must be submitted to it in accordance with the law.

Attendance fees (Article 19 of the Articles of Association)

Independently of all reimbursement of costs or allowances for particular services which may be granted, directors may receive remuneration recorded as overheads, in the form of directors’ fees. The total amount of these fees is set by the Shareholders’ Meeting.The Board of Directors divides the aforementioned remuneration among its members as it sees fit.

(b) Internal Rules of the Board of Directors

The Internal Rules of the Board of Directors specify, on the one hand, how the Board is organised and operates, its powers, rights and prerogatives and those of the committees it has established (see Article 4 “Creation of committees – Joint provisions” and Article 1.2 “Operations subject to the prior authorisation of the Board of Directors” for a description of the various committees established and the limits on the powers of general management) and, on the other hand, the terms of control and evaluation of its operations.

The Internal Rules of the Board of Directors may be consulted online in the “Investors/Governance” section of the corporate website at www.coface.com.

(c) Control and evaluation of the Board of Directors’ operations

Article 2 of the Board of Directors’ Internal Rules requires at least one third of members to be independent, pursuant to the Corporate Governance Code of Listed Companies (AFEP-MEDEF code), within the Board of Directors.

Pursuant to Article 2.3.2 of the Board of Directors’ Internal Rules, a director is considered to be independent if they do not maintain a relationship of any kind whatsoever with the Company, management or the Coface Group, which could compromise the exercise of their free judgement or be of a nature to place them in conflict with the interests of management, the Company or the Coface Group.

The qualification of an independent member of the Board of Directors is discussed by the Nominations and Compensation Committee, which drafts a report on the matter for the Board.Each year, prior to publication of the Universal Registration Document, the Board of Directors examines the status of each director with respect to the independence criteria defined in Article 2.3.2 of the Board of Directors’ Internal Rules, using the Nominations and Compensation Committee’s report as a reference.The Board of Directors must provide the shareholders with the findings of its examination in the annual report and at the Shareholders’ Meeting at which the directors are appointed.

In addition, in compliance with Article 3.5 of the Board of Directors’ Internal Rules, at least once a year, an agenda item is devoted to evaluating the Board’s operations, which is reported in the Company’s annual report.

The Board of Directors is formally evaluated every three years. The evaluation is conducted by the Nominations and Compensation Committee, potentially with the assistance of an outside consultant (see Section 2.1.6 “Evaluation of the work of the Board of Directors”).

Rights, privileges and restrictions attached to the shares
Form of shares (Article 8 of the Articles of Association)

The Company’s shares shall either be registered or bearer shares, at the discretion of each shareholder.

Ownership of the Company’s shares shall result from their registration in an account in the name of their holder in the registers kept by the Company or by a duly authorised intermediary.

Voting rights (Article 11 of the Articles of Association)

Each share grants its holder the right to vote and be represented at Shareholders’ Meetings, in accordance with the law and the Articles of Association.

As an exception to the allocation of a double voting right for any share that has been fully paid up, as proven by registration in the name of the bearer for two years, pursuant to Article L.225-123, paragraph 3 of the French Commercial Code, each shareholder is entitled to the same number of votes as the number of shares that they own or represent.

Right to dividends and profits (Article 11 of the Articles of Association)

Each Company share grants its holder the right to a proportional share in any distribution of the Company’s earnings, assets and liquidation profits.

The rights and obligations attached to the shares follow them when they change hands.

Ownership of a share automatically implies acceptance of the Articles of Association of the Company and the decisions duly taken by Shareholders’ Meetings.

Shareholders shall only bear liability to the extent of the nominal value of each share they hold.

Whenever it is necessary to hold several shares in order to exercise a particular right, in the event of an exchange, grouping or allocation of shares, or as a result of an increase in or a reduction of the share capital, a merger or other corporate operation, the owners of single shares or of an insufficient number of shares may only exercise this right provided that they arrange to group together and to buy or sell any shares as may be required.

The joint owners of shares shall be represented at Shareholders’ Meetings by one of their number or by a single representative.Should the parties involved fail to agree on the appointment of their representative, the latter shall be appointed by a court order issued pursuant to a petition filed by the first joint owner to do so.

Unless otherwise agreed and notified to the Company, in the event of the division of ownership of a share, the voting right belongs to the beneficial owner at Ordinary Shareholders’ Meetings and to the bare owner at Extraordinary or Special Shareholders’ Meetings.However, in any event, the bare owner has the right to take part in all Shareholders’ Meetings.

Payment of the dividend in shares (Article 24 of the Articles of Association)

The Shareholders’ Meeting called to approve the accounts for the financial year has the authority to offer each shareholder the option to receive all or part of the dividend payout in the form of shares, in accordance with the legal conditions, or in cash.This option may also be granted in the case of interim dividends.

The procedures for dividend payments in cash are fixed by the Shareholders’ Meeting or, alternatively, by the Board of Directors.

Preferential subscription rights

The Company’s shares benefit from a preferential subscription right to capital increases under the terms provided for by the French Commercial Code.

Limitation on voting rights

No statutory clause restricts the voting right attached to the shares.

Amendment of shareholders’ rights (Article 23 of the Articles of Association)

The Extraordinary Shareholders’ Meeting deliberates on all proposals emanating from the Board of Directors which entail modification to the Company’s share capital or Articles of Association.

Shareholders’ Meetings (Article 23 of the Articles of Association)
Powers

The shareholders take their decisions in Shareholders’ Meetings which are designated as ordinary or extraordinary.

The Ordinary Shareholders’ Meeting takes all decisions which do not entail modification to the Company’s share capital or Articles of Association.In particular, it appoints, replaces, re-elects and dismisses directors. It also approves, rejects or corrects the accounts and decides on the breakdown and allocation of profits.

The Extraordinary Shareholders’ Meeting deliberates on all proposals emanating from the Board of Directors which entail modification to the Company’s share capital or Articles of Association.

Convening notice and meeting location

Shareholders’ Meetings are convened as per the terms and conditions set forth in the law.

Meetings take place at the registered office or any other location indicated in the convening notice.

Access to and conduct of the meetings

All shareholders may take part in the Shareholders’ Meetings in person or through a representative, in accordance with the prevailing regulations, upon presentation of suitable evidence of their identity and of their ownership of shares, in accordance with the applicable laws and regulations.

Shareholders who take part in a Shareholders’ Meeting by video conferencing or other means of telecommunication or by remote transmission, including over the Internet, which enable them to be identified in accordance with the prevailing regulations, are deemed to be present for the purposes of calculating the quorum and the majority, subject to a decision by the Board of Directors to make use of such means of telecommunication and said decision being mentioned in the announcement or convening notice to attend the Shareholders’ Meeting.

Any shareholder may vote remotely or appoint a proxy in accordance with the prevailing regulations, using a form drawn up by and sent to the Company, including by electronic means or remote transmission, if this is permitted by the Board of Directors.This form must be received by the Company in accordance with the regulatory requirements in order for it to be taken into consideration.

Chairmanship, committee, attendance sheet

Each Shareholders’ Meeting is chaired by the Chairman of the Board of Directors or, in their absence, by a director appointed for that purpose by the Board.

Where the meeting is called by the Statutory Auditors or a legal officer, the meeting is chaired by the person or individuals issuing the notice to attend.

The duties of deputy returning officer are performed by the two members present at the meeting who hold the largest number of shares and are willing to act in that capacity.The committee appoints the secretary, who is not necessarily a shareholder.

An attendance sheet is kept in accordance with statutory requirements.

Deliberations, minutes

Shareholders’ Meetings deliberate subject to the quorum and majority requirements prescribed by law.Voting is on a one-share, one-vote basis.

Deliberations are recorded in minutes entered in a special register and signed by members of the committee.

Copies or extracts of the minutes are duly certified by the Chairman of the Board of Directors, the Chief Executive Officer, if they are a director, or the secretary of the meeting.

Shareholders’ right to information

Each shareholder has the right to receive disclosure of the documents required to enable them to make an informed decision and to develop an informed opinion on the Company’s management and operations.The Company has the obligation to make these documents available to or send them to shareholders.

The nature of these documents and the terms under which they must be sent or made available are set by law.

Statutory clauses likely to have an impact on a change in control

None.

Crossing of thresholds and identification of shareholders (Article 10 of the Articles of Association) (see also Section 7.3.4)

In compliance with prevailing laws and regulations, the Company may ask any duly empowered body or intermediary for any information about the identity of the holders of any securities that confer an immediate or deferred right to vote in its Shareholders’ Meetings, as well as the number of securities they hold.

Any individual or legal entity that directly or indirectly holds, alone or in conjunction with others, 2% of the share capital or voting rights (calculated in accordance with the provisions of Articles L.233-7 and L.233-9 of the French Commercial Code and the provisions of the general rules of the Autorité des Marchés Financiers [French Financial Markets Authority, AMF]), or any multiple of this percentage, must notify the Company of the total number (i) of the shares and voting rights held directly or indirectly, alone or in conjunction with others, (ii) of the securities that provide deferred access to the share capital of the Company, held directly or indirectly, alone or in conjunction with others, and the voting rights potentially attached thereto, and (iii) of shares already issued that this party may acquire under an agreement or a financial instrument mentioned in Article L.211-1 of the French Monetary and Financial Code.This notification must take place by means of a letter sent by registered post with acknowledgement of receipt within four stock market days after the relevant threshold has been exceeded.

The obligation to inform the Company shall also apply, within the same timescales and on the same terms, whenever the shareholder’s shareholding or voting rights fall to a level below any of the above-mentioned thresholds.

Should a shareholder fail to comply with the obligation to report the crossing of the above-mentioned thresholds, then at the request of one or more shareholders who account for at least 2% of the share capital or voting rights of the Company, recorded in the minutes of the Shareholders’ Meeting, the shares which exceed the fraction that should have been declared are deprived of their voting rights for a period of two years from the date on which notification is effectively sent.

The Company is entitled to inform the public and bring to the attention of the shareholders either the information it has been notified of, or any failure to comply with the above-mentioned obligation by the relevant party.

Specific clauses governing modifications to share capital

There is no specific stipulation in the Company’s Articles of Association governing modifications to its capital.

Such capital may thus be increased, reduced or amortised in any manner authorised by law.

9.2Persons responsible

9.2.1Names and positions

9.2.1.1Person responsible for the Universal Registration Document

Xavier Durand, Chief Executive Officer of COFACE SA

9.2.1.2Person responsible for financial information

Phalla Gervais, Chief Financial & Risk Officer

9.2.1.3Person responsible for financial communication

Thomas Jacquet, Head of Investor Relations and Rating Agencies

9.2.2Statement by the person responsible for the Universal Registration Document

I hereby declare that the information contained in this Universal Registration Document, to my knowledge, is true to fact and that no material aspects of such information have been omitted.

I hereby declare that, to the best of my knowledge, the financial statements have been prepared in accordance with applicable accounting standards and are an accurate reflection of the assets, financial position and results of the Company and all consolidated companies, and that the management report in this Universal Registration Document presents an accurate picture of events, results and the financial position of the Company and all consolidated companies, and describes the principal risks and uncertainties that they face.

I have received a work completion letter from the Statutory Auditors indicating that they have verified the information about the financial position and the financial statements provided in this Universal Registration Document and have read the full document.

Paris, April 5, 2023

Xavier Durand

Chief Executive Officer

9.3Documents accessible to the public

All COFACE SA Group publications (press releases, annual reports, annual and half-yearly presentations, etc.) and regulated information are available on request or on the website: www.coface.com/fr/Investisseurs.They may also be consulted at its head office, preferably by appointment.

This Universal Registration Document is available in the “Investors” section of the company website and on the AMF website (www.amf-france.org).Copies are available free of charge at the Company’s head office.

In addition, under Solvency II, the Solvency and Financial Condition report (SFCR) for financial year 2021 which is aimed at the public, was filed with the ACPR on April 29, 2022.It is published in the “Investors” section of the company website www.coface.com.The next SFCR report on financial year 2022 will be published at the end of April 2023.

Any person wishing to obtain additional information on the Group may request the documents without appointment and free of charge:

  • by post:

Coface

Financial Communications – Investor Relations

1, place Costes et Bellonte, 92270 Bois-Colombes, France

  • by e-mail:

investors@coface.com

Thomas Jacquet, Head of Investor Relations and Rating Agencies

Benoît Chastel / Investor Relations Officer

9.4Statutory Auditors

9.4.1Principal Statutory Auditors

DELOITTE & ASSOCIÉS

6, place de la Pyramide

92908 Paris-La Défense Cedex

Represented by Jérôme Lemierre

Deloitte & Associés was appointed by the Company’s Annual Shareholders’ Meeting of May 16, 2019 for a period of six financial years until the close of the Annual Shareholders’ Meeting to approve the accounts for the financial year ended December 31, 2024.

Deloitte & Associés is a member of Compagnie régionale des commissaires aux comptes de Versailles.

MAZARS SA

Tour Exaltis

61, rue Henri Regnault

92400 Courbevoie

Represented by Jean-Claude Pauly

Mazars SA was appointed by the Company’s Shareholders’ Meeting of May 14, 2020 for a period of six financial years until the close of the Annual Shareholders’ Meeting to approve the accounts for the financial year ended December 31, 2025.

Mazars SA is a member of Compagnie régionale des commissaires aux comptes de Versailles.

9.5Selected financial information over three years

The tables below present extracts of income statements and consolidated financial statements for the 2020, 2021 and 2022 financial years.

This selected financial information must be read in conjunction with chapters 3 and 4 of this Universal Registration Document.

/Consolidated income statement

(in thousands of euros)

2022

2021

2020

Gross written premiums

1,698,270

1,462,424

1,273,767

Premium refunds

(142,109)

(121,336)

(78,111)

Net change in unearned premiums

(28,697)

(28,451)

8,678

Gross earned premiums

1,527,464

1,312,637

1,204,334

Fee and commission income

158,582

140,691

143,985

Net income from banking activities

70,414

64,400

58,450

Income from services activities

55,510

50,130

44,094

Other turnover

284,506

255,221

246,530

Turnover

1,811,970

1,567,858

1,450,864

Claims expenses

(476,779)

(280,456)

(623,653)

Contract acquisition costs

(304,747)

(259,317)

(238,453)

Administration costs

(314,460)

(270,990)

(261,807)

Other expenses from insurance activities

(69,824)

(66,243)

(60,971)

Expenses from banking activities, excluding cost of risk

(14,331)

(13,103)

(12,833)

Expenses from services activities

(102,998)

(89,674)

(81,608)

Operating expenses

(806,361)

(699,327)

(655,672)

Cost of risk

308

76

(100)

Underwriting income before reinsurance

529,138

588,150

171,439

Income and expenses from ceded reinsurance

(146,610)

(314,288)

(44,116)

Underwriting income after reinsurance

382,529

273,862

127,322

Investment income, net of management expenses (excluding finance costs)

40,105

42,177

26,903

Current operating income

422,634

316,039

154,225

Other operating income and expenses

(9,116)

(3,177)

(13,787)

Operating income

413,518

312,862

140,438

Finance costs

(29,605)

(21,477)

(21,740)

Share in net income of associates

0

0

0

Badwill

0

0

8,910

Income tax expense

(100,561)

(67,511)

(44,704)

Consolidated net income before non-controlling interests

283,352

223,874

82,904

Non-controlling interests

(244)

(57)

(4)

Net income (Group share)

283,107

223,817

82,900

Earnings per share (in €)

1.90

1.50

0.55

Diluted earnings per share (in €)

1.90

1.50

0.55

/Simplified consolidated balance sheet

(in thousands of euros)

2022

2021

2020

Assets


Intangible assets

238,835

229,951

230,852

Insurance business investments

3,021,805

3,219,430

2,982,945

Receivables arising from banking activities

2,906,639

2,690,125

2,326,941

Assignees’ and reinsurers’ share of liabilities related to insurance and financial contracts

508,881

512,187

603,453

Other assets

1,220,666

1,024,871

1,007,645

Cash and cash equivalents

553,786

362,441

400,969

Total assets

8,450,613

8,039,006

7,552,804

(in thousands of euros)

2022

2021

2020

Liabilities


Group equity

1,960,465

2,141,041

1,998,308

Non-controlling interests

1,746

309

267

Total equity

1,962,211

2,141,351

1,998,575

Provisions for risks and charges

68,662

85,748

96,307

Financing liabilities

534,280

390,553

389,810

Lease liabilities

74,622

81,930

88,124

Liabilities relating to insurance contracts

2,056,267

1,859,059

1,804,092

Payables arising from banking sector activities

2,927,389

2,698,525

2,318,392

Other liabilities

827,180

781,841

857,504

Total liabilities

8,450,613

8,039,006

7,552,804

/Turnover by business line as at December 31, 2022

Consolidated turnover by business line

(in thousands of euros and as a % of the Group total)

See also Section

Dec. 31, 2022

Dec. 31, 2021

Dec. 31, 2020

(in €k)

(in €k)

(in €k)

Gross earned premiums – Credit


1,444,175

1,242,767

1,132,876

Gross earned premiums – Single Risk


24,480

15,839

21,141

Gross earned premiums – Credit insurance


1,468,655

1,258,606

1,154,017

Fee and commission income (1)


158,582

140,691

143,985

Other related benefits and services (2)


39

156

102

Turnover from credit insurance activity

1.3.1

1,627,276

1,399,453

1,298,104

Gross earned premiums – Bonding

1.3.3

58,809

54,031

50,317

Financing fees


32,888

26,409

26,995

Factoring fees


41,126

39,712

32,758

Other


(3,601)

(1,720)

(1,302)

Net income from banking activities (factoring)

1.3.2

70,414

64,400

58,450

Business information and other services


49,269

42,266

34,523

Receivables management


6,202

7,708

9,469

Turnover from business information and other services

1.3.4

55,471

49,974

43,992

Consolidated turnover

Note 22

1,811,970

1,567,858

1,450,864

In order to ensure greater consistency between the financial statements and the aggregates published and commented on in financial reporting, the Group is changing the presentation structure of its consolidated income statement.A detailed explanation is provided in the notes to the consolidated financial statements.

  • Policy management costs.
  • IPP commission – International policies commission; business contributors’ commission.
/Turnover by region as of December 31, 2022 (1)

(in thousands of euros)

2022

2021

2020

Northern Europe

372,337

331,529

297,721

Western Europe

359,644

316,684

291,848

Central and Eastern Europe

178,533

156,263

143,081

Mediterranean and Africa

480,576

429,399

394,890

North America

168,011

137,481

136,518

Latin America

101,595

73,330

67,328

Asia-Pacific

151,274

123,171

119,478

Total

1,811,970

1,567,858

1,450,864

Performance indicators

These operating ratios and the methodology for calculating them are defined in Section 3.7 “Key financial performance indicators”.

/Combined ratio before reinsurance

(as a %)

COA2022_URD_EN_G014_HD.png
/Combined ratio after reinsurance

(as a %)

COA2022_URD_EN_G015_HD.png
/RoATE

(as a %)

COA2022_URD_EN_G013_HD.png

Return on average tangible equity (RoATE) is computed as net income (Group share)/average book equity (Group share) net of intangible assets – see Section 3.4.3.“Return on equity”.

/Solvency ratio

(as a %)

COA2022_URD_EN_G043_HD.png
(1)
See details in Note 22.

9.6Main ratings of the Coface Group at February 28, 2023

The Company and some of its subsidiaries are assessed by well-known financial ratings agencies.The Company rating can vary from agency to agency.

At February 28, 2023, the main ratings for the Company and its principal operational subsidiary are as follows:

Insurer financial strength rating

Agency

Rating

Outlook

Compagnie française d’assurance pour le commerce extérieur and its branches

Fitch

Moody’s

AM Best

AA-

A2

A

Stable

Positive

Stable

Rating for COFACE SA debt


Long-term counterparty risk rating

Fitch

Moody’s

A+

Baa1

Stable

Positive

Short-term counterparty risk rating (commercial paper)

Fitch

Moody’s

F1

P-2

Stable

Positive

ISIN: FR0011805803


Subordinated bonds - due March 27, 2024

Fitch

Moody’s

A-

Baa1

Stable

Positive

ISIN: FR001400CSY7


Tier 2 subordinated notes - due September 22, 2032

Fitch

Moody’s

BBB+

Baa2

Stable

Positive

The ratings shown above may be subject to revision or withdrawal at any time by the ratings agencies awarding them.None of these ratings represent an indication of past or future performance of Coface shares or debt issued by the Company and should not be used as part of an investment decision.The Company is not responsible for the accuracy and reliability of these ratings.The information is available and updated on the Company’s website: http://www.coface.com/Investors/Ratings.

9.7Cross-reference table

9.7.1Universal Registration Document

This cross-reference table contains the items provided for in Annex I and II of Commission Delegated Regulation (EU) 2019/980 of March 14, 2019 and refers to the pages of this Universal Registration Document on which the information relating to each of these items is provided.

Information

Page

1.

Persons responsible, third party information, experts’ reports and competent authority approval

343

2.

Statutory Auditors

344

3.

Risk factors

218-237

4.

Information about the issuer

338

5.

Business overview


5.1. Principal activities

25-26


5.2. Principal markets

24-25; 36-40


5.3. Important events in the development of the business

22-24


5.4. Strategy and objectives

41-43


5.5. Dependence on patents or licences, industrial, commercial or financial contracts or new manufacturing processes

N/A


5.6. Competitive positioning

25; 36-40


5.7. Investments

36-40; 125; 158-162; 166-168

6.

Organisational structure


6.1. Summary of the Group

5


6.2. List of significant subsidiaries

5; 138-141; 206

7.

Assessment of the financial position and income


7.1. Financial position

96-125


7.2. Operating income

103-105

8.

Cash and capital


8.1. Information concerning capital resources

109-113


8.2. Sources and amounts of cash flows

109; 136


8.3. Information on borrowing requirements and funding structure

109-111


8.4. Restriction on use of capital

110-111; 225-226


8.5. Expected financing sources

N/A

9.

Regulatory environment

49-50

10.

Information on trends

96-100; 114-116

11.

Profit forecasts or estimates

N/A

12.

Administrative, management, supervisory bodies and general management


12.1. Board of Directors and general management

54-60; 73-76


12.2. Administrative, management, supervisory bodies and general management conflicts of interests

72

13.

Compensation and benefits


13.1. Compensation and benefits in kind

77-93


13.2. Amounts placed in reserve or otherwise recorded by the Company or its subsidiaries for the purposes of paying pensions, retirement or other benefits

93

14.

Practices of administrative and management bodies


14.1. Date of expiration of current terms of office

54


14.2. Service contracts

71-72


14.3. Information on the Audit Committee and the Compensation Committee

64-71


14.4. Declaration of compliance with the applicable corporate governance regimes

72


14.5. Potential material impacts on corporate governance

72-73

15.

Employees


15.1. Number of employees and breakdown of headcount

254-265


15.2. Shareholdings and stock options of directors

77-91


15.3. Agreements providing for employee share ownership in the capital

N/A

16.

Major shareholders


16.1. Crossing of thresholds

299


16.2. Existence of different voting rights

N/A


16.3. Control of the issuer

299


16.4. Agreement known to the issuer, implementation of which could lead to a change in its control

298-299

17.

Related party transactions

199-200; 295; 298

18.

Financial information on assets and liabilities, financial position and results


18.1. Historical financial information

128-207; 345-348; 355


18.2. Interim and other financial information

N/A


18.3. Auditing of historical annual financial information

208-215


18.4. Pro forma financial information

N/A


18.5. Dividend policy

43; 306; 323-324


18.6. Legal and risk underwriting proceedings

N/A


18.7. Significant change in the financial position

99-100

19.

Additional information


19.1. Share capital


19.1.1 Subscribed capital

292-297


19.1.2 Other shares

297


19.1.3 Treasury shares

293-297


19.1.4 Transferable securities

N/A


19.1.5 Vesting conditions

N/A


19.1.6 Options or agreements

297


19.1.7 History of capital

297


19.2. Memorandum and Articles of Association


19.2.1. Corporate purpose

338


19.2.2 Share rights and privileges

341-342


19.2.3 Change of control elements

299

20.

Material contracts

303

21.

Documents available

343

9.7.2Annual financial report

This Universal Registration Document contains all the elements of the financial report as mentioned in Article L.451-1-2 of the French Monetary and Financial Code and Article 222-3 of the AMF General Regulation.

Information

Page

Parent company financial statements

193-207

Consolidated financial statements

128-192

Management report

see details in Section 9.7.4

Corporate governance report

see details in Section 9.7.4

Statement of the person responsible for the annual financial report

343

Statutory Auditors’ report on the parent company financial statements

212-215

Statutory Auditors’ report on the consolidated financial statements

208-212

Statutory Auditors’ report on the corporate governance report

213

9.7.3AMF tables on the compensation of corporate officers

The following table has been drawn up to put the information on compensation into perspective with the presentation in the form of 11 tables recommended by the AMF in its guide to preparing universal registration documents published on January 5, 2022 (see also the AFEP-MEDEF Code).

Compensation tables as per AMF recommendations

Page

Table 1. Summary of compensation, stock options and shares granted to each executive corporate officer

83

Table 2. Summary of the compensation of each executive corporate officer

84

Table 3. Compensation awarded for directorship and other compensation received by non-executive corporate officers

90

Table 4. Stock options or warrants awarded during the financial year to each executive corporate officer by the Company or any Group company

N/A

Table 5. Stock options or warrants exercised during the financial year by each executive corporate officer

N/A

Table 6. Performance shares awarded to each corporate officer

91

Table 7. Performance shares that have vested for each corporate officer

91

Table 8. History of awards of stock options or warrants

N/A

Table 9. History of free share awards

92

Table 10. Stock options or warrants granted to the top ten employees who are not corporate officers and options exercised by these employees

N/A

Table 11. Commitments related to the termination of the functions of executive corporate officers

93

9.7.4Assessment of the Board’s work

To make it easier to understand this document, the cross-reference table below identifies the information to be included in the management report, in accordance with the provisions of the French Commercial Code applicable to public limited companies with a board of directors.

Information required


Legal document

Chapters

Page

1. Group situation and activity


Situation of the company during the year and an objective and exhaustive analysis of the development of the business, results and financial position of the company and the Group, in particular its debt situation, with respect to business volume and complexity


Articles L. 225-100-1, I. (1), L. 232-1, II, L. 233-6 and L. 233-26 of the French Commercial Code

3; 4

101-113; 
128-207

Key performance indicators of a financial nature


Article L. 225-100-1, I (2)

0; 3

4, 14-15; 
101-108

Key performance indicators of a non-financial nature relating to the specific activity of the company and the group, in particular information relating to environmental and employee issues


Article L. 225-100-1, I (2)

0; 6

4; 241-242

Significant events occurring between the balance sheet date and the date on which the Management Report was prepared


Articles L. 232-1, II. and L. 233-26 of the French Commercial Code

3

114

Identity of the main shareholders and holders of voting rights at general shareholders’ meetings, and changes during the financial year


Article L. 233-13 of the French Commercial Code

7

298-299

Branches


Article L. 232-1, II of the French Commercial Code

4

137-140

Significant equity investments in companies having their registered office in France


Article L. 233-6 para.1 of the French Commercial Code

N/A

N/A

Disposals of cross-shareholdings


Articles L. 233-29, L. 233-30 and R. 233-19 of the French Commercial Code

N/A

N/A

Expected changes in the situation of the company and the group and outlook for the future


Articles L. 232-1, II and L. 233-26 of the French Commercial Code

3

114-116

Research and development activities


Articles L. 232-1, II and L. 233-26 of the French Commercial Code

N/A

N/A

Table showing the company’s results in each of the last five financial years


Article R. 225-102 of the French Commercial Code

4

207

Information on supplier and customer payment terms


Article D.441-4 of the French Commercial Code

4

208

Amount of inter-company loans granted and statement by the statutory auditor


Articles L. 511-6 and R. 511-2-1-3 of the French Monetary and Financial Code

N/A

N/A

2. Internal control and risk management


Description of the main risks and uncertainties with which the company is faced


Article L. 225-100-1, I (3) of the French Commercial Code

5

218-237

Information about financial risks linked to the effects of climate change and presentation of the measures taken by the company to mitigate these risks by adopting a low-carbon strategy in all aspects of its business


Article L. 22-10-35 (1) of the French Commercial Code

5; 6

231; 241-242

Main characteristics of internal control and risk management procedures set up by the company and the group relating to the preparation and processing of financial and accounting information


Article L. 22-10-35 (2) of the French Commercial Code

5

233-237

Guidance on the hedging objectives and policy for each main category of transactions and exposure to price, credit, liquidity and treasury risks, including the use of financial instruments


Article L. 225-100-1 (4) of the French Commercial Code

5

218-229

Anti-corruption system


Law no. 2016-1691 of 9 December 2016 known as “Sapin II”

6

241, 251-253

Vigilance plan and report on its effective implementation


Article L. 225-102-4 of the French Commercial Code

6

252-253

3. Corporate governance report


Information on compensation


Compensation policy for corporate officers


Article L. 22-10-8, I., paragraph 2 and Article R. 22-10-14 of the French Commercial Code

2

79-82

Compensation and benefits of any kind paid to each corporate officer during the financial year or awarded in respect of the financial year


Article L. 22-10-9, I (1) and Article R. 22-10-15 of the French Commercial Code

2

83-84

Relative proportion of fixed and variable compensation


Article L. 22-10-9, I (2) of the French Commercial Code

2

85

Use of the possibility of requesting the return of variable remuneration


Article L. 22-10-9, I (3) of the French Commercial Code

N/A

N/A

Commitments of any kind made by the Company to its corporate officers, corresponding to components of compensation, indemnities or benefits due or likely to be due as a result of the assumption, termination or change of their duties or subsequent to the exercise of said duties


Article L. 22-10-9, I (4) of the French Commercial Code

2

93

Compensation paid or awarded by a company included in the scope of consolidation within the meaning of Article L. 233-16 of the French Commercial Code


Article L. 22-10-9, I (5) of the French Commercial Code

2

N/A

Ratio between the level of compensation of each executive officer and the average and median compensation of the company’s employees


Article L. 22-10-9, I (6) of the French Commercial Code

2

87

Annual changes in compensation, the company’s performance, average compensation for the company’s employees and the ratios indicated above during the five most recent financial years


Article L. 22-10-9, I (7) of the French Commercial Code

2

89

Explanation of how total compensation complies with the compensation policy adopted, including how it contributes to the company’s long-term performance and how the performance criteria were applied


Article L. 22-10-9, I (8) of the French Commercial Code

2

88

Manner in which the vote at the last Ordinary Shareholders’ Meeting provided for Article L. 22-10-34, I. of the French Commercial Code was taken into account


Article L. 22-10-9, I (9) of the French Commercial Code

2

85-89

Deviation from and any exceptions to the procedure for implementing the compensation policy


Article L. 22-10-9, I (10) of the French Commercial Code

N/A

N/A

Application of the provisions of the second paragraph of Article L. 225-45 of the French Commercial Code (suspension of the payment of directors’ compensation in the event of non-compliance with diversity rules applicable to the Board of Directors)


Article L. 22-10-9, I (11) of the French Commercial Code

N/A

N/A

Award of stock options to corporate officers and retention thereof


Articles L. 225-185 and L. 22-10-57 of the French Commercial Code

2

83-84, 90-93

Award of free shares to executive corporate officers and retention thereof


Articles L.225-197-1 and L. 22-10-59 of the French Commercial Code

2

83-84; 90-93

Information on governance


List of all offices and positions held in any company by each of the officers during the financial year


Article L.225-37-4 (1) of the French Commercial Code

2

54-60

Agreements entered into between a senior manager or a significant shareholder and a subsidiary


Article L.225-37-4 (2) of the French Commercial Code

N/A

N/A

Summary table of valid authorisations granted by the General Shareholders’ Meeting in respect of capital increases


Article L.225-37-4 (3) of the French Commercial Code

7

292

General management procedures


Article L.225-37-4 (4) of the French Commercial Code

2

73-77

Composition, conditions of preparation and organisation of the Board’s work


Article L. 22-10-10 (1) of the French Commercial Code

0; 2

16; 60-71

Application of the principle of balanced representation of women and men on the board


Article L. 22-10-10 (2) of the French Commercial Code

2

62-63

Any limitations of the powers of the Chief Executive Officer by the Board


Article L. 22-10-10 (3) of the French Commercial Code

2

73

Reference to a corporate governance code and application of the “comply or explain” principle


Article L. 22-10-10 (4) of the French Commercial Code

2

72

Specific means of shareholder participation in the Annual Shareholders’ Meeting


Article L. 22-10-10 (5) of the French Commercial Code

9

341-342

Procedure for evaluating current agreements - Implementation


Article L. 22-10-10 (6) of the French Commercial Code

2

62

Information that may have an impact in the event of a public offer


Article L. 22-10-11 of the French Commercial Code

2; 7

73; 302

4. Shareholding and capital


Structure, change in the Company’s share capital and crossing of thresholds


Article L. 233-13 of the French Commercial Code

0; 7

5; 297-299

Acquisition and sale by the Company of its own shares


Articles L. 225-211 and R. 225-160 of the French Commercial Code

7

293-296

Statement of employee holdings in the share capital on the last day of the financial year (proportion of capital held)


Article L. 225-102, paragraph 1 of the French Commercial Code

0; 7

5; 298, 300

Indication of any adjustments for securities giving access to capital in the event of share buybacks or financial transactions


Articles R. 228-90 and R. 228-91 of the French Commercial Code

7

297

Information on transactions on the Company’s shares by officers and related persons


Article L. 621-18-2 of the French Monetary and Financial Code

7

298

Amounts of dividends paid in respect of the three previous financial years


Article 243 bis of the French General Tax Code

8

306

5. Statement on non-financial performance


Business model


Articles L.225-102-1 and R. 225-105, I of the French Commercial Code

0; 6

14-15; 240

Description of the main risks associated with the business of the company or group, including, where relevant and material, the risks created by business relationships, products or services


Articles L. 225-102-1 and R. 225-105, I(1) of the French Commercial Code

6

241-242

Information on the effects of the activity in terms of respect for human rights and the fight against corruption and tax evasion, and how the company or group takes into account the social and environmental consequences of its business (description of the policies applied and due diligence procedures implemented to prevent, identify and mitigate the main risks related to the company’s or group’s activity)


Articles L. 225-102-1, III, L. 22-10-36 and R. 22-10-29, R. 225-104 and R. 225-105, I(2) of the French Commercial Code

6

240-288

Results of policies applied by the company or group, including key performance indicators


Articles L. 225-102-1 and R. 225-105, I(3) of the French Commercial Code

6

241-242

Employee-related information (employment, work organisation, health and safety, social relations, training, equal treatment)


Articles L. 225-102-1 and R. 225-105, IIA.(1) of the French Commercial Code

6

254-265

Environmental information (general environmental policy, pollution, circular economy, climate change)


Articles L. 225-102-1 and R. 225-105, IIA.(2) of the French Commercial Code

6

266-275

Societal information (commitments to sustainable development, subcontracting and suppliers, fair practices)


Articles L. 225-102-1 and R. 225-105, IIA.(3) of the French Commercial Code

6

244-253

Information on the fight against corruption and tax evasion


Articles L. 225-102-1, L. 22-10-36 and R. 22-10-29 and R. 225-105, IIB(1) of the French Commercial Code

6

241; 252-253

Information related to human rights initiatives


Articles L. 225-102-1, L. 22-10-36 and R. 22-10-29 and R. 225-105, IIB(2) of the French Commercial Code

6

250

Specific information: - policy for preventing the risk of a technological accident implemented by the company;- the company’s ability to cover its civil liability with respect to property and persons as a result of the operation of such facilities;- means provided by the company to manage the compensation of victims in the event of a technological accident for which it is liable.


Article L. 225-102-2 of the French Commercial Code

N/A

N/A

Collective agreements entered into by the company and their impact on the company’s economic performance as well as on employees’ working conditions


Articles L.225-102-1, III and R. 225-105 of the French Commercial Code

N/A

N/A

Certification by the independent third party on the information contained in the statement on non-financial performance


Articles L.225-102-1, III and R. 225-105-2 of the French Commercial Code

6

286-288

6. Other information


Additional tax information


Articles 223 quater and 223 quinquies of the French General Tax Code

4

195; 202

Injunctions or financial penalties for anti-competitive practices


Article L. 464-2 of the French Commercial Code

N/A

N/A

9.7.5Shareholders’ Meeting

(Article L.225-100 et seq of the French Commercial Code)

Summary of the Company’s position during the past financial year

Page

Parent company financial statements

193-207

Consolidated financial statements

128-192

Group management report

see details in Section 9.7.4

Corporate governance report

see details in Section 9.7.4

Usual first names and surnames of directors and executive officers, as well as the details of the other companies in which these persons exercise management, leadership, administration or supervisory roles (Articles L.225-115 and R.225-83 of the French Commercial Code)

54-60

The draft resolutions and the explanations of the reasons, as well as information concerning candidates for the Board of Directors, if applicable (Articles L.225-115 and R.225-83 of the French Commercial Code)

306-322; 323-330

A table showing the appropriation of income, specifying in particular the origin of the sums proposed for distribution (Article R.225-83 of the French Commercial Code)

306

Board of Directors’ report on the draft resolutions proposed

323-330

Report of the Statutory Auditors on the parent company financial statements (Article L.823-9 of the French Commercial Code)

212-215

Report of the Statutory Auditors on the consolidated financial statements (Article L.823-9 of the French Commercial Code)

208-212

Report of the Statutory Auditors on the corporate governance report (Article L.823-10 of the French Commercial Code) included in the Statutory Auditors’ report on the parent company financial statements

213

Report of the Statutory Auditors on regulated agreements and commitments (Articles L.225-40 and R.225-83 of the French Commercial Code)

331-334

Report of one of the Statutory Auditors, a designated independent third party, on the consolidated corporate, environmental and societal information presented in the management report (Articles L.225-102-1 and R.225-105 of the French Commercial Code)

286-288

9.8Incorporation by reference

Pursuant to Article 19 of European Regulation No. 2017/1129, the following information is included by reference in this Universal Registration Document:

  • For the year ended December 31, 2021:
  • The Management Report (as set out in the cross-reference table), the consolidated financial statements, the parent company financial statements and the related Statutory Auditors’ Reports, appearing in the Universal Registration Document for the 2021 financial year filed with the AMF on April 6, 2022, under number D.22-0244, respectively on pages 347-349, 130-195, 196-209, 210-213 and 214-216;
  • For the year ended December 31, 2020:
  • The Management Report (as set out in the cross-reference table), the consolidated financial statements, the parent company financial statements and the related Statutory Auditors’ Reports, appearing in the Universal Registration Document for the 2020 financial year filed with the AMF on March 31, 2021, under number D.21-0233, respectively on pages 354, 132-199, 200-213, 214-217 and 218-221.

The information included in these two Universal Registration Documents other than that referred to above is, as applicable, replaced or updated by the information included in this Universal Registration Document.These two Universal Registration Documents are available at the Company’s registered office and on the website https://www.coface.com/Investors/financial-results-and-reports under the Annual Reports tab.

9.9Glossary

This glossary is a sample of terms used in the credit insurance sector and is therefore not exhaustive.It does not contain all the terms used in this Universal Registration Document or all terms used in the credit insurance industry.

Fee and commission income: fees ancillary to the insurance policy corresponding to the remuneration of services related to credit insurance, such as the costs of monitoring the credit limits issued to the policyholder on its clients.

Factoring: all the services a factor provides to companies, enabling them to outsource the management of their trade receivables: management of invoices, including debt collection, protection against insolvency, financing, etc.

Credit insurance: a technique whereby a company protects itself against the risks of non-payment of its trade receivables.

Earnings per share: ratio calculated by dividing net income for the year attributable to shareholders by the weighted average number of shares outstanding.

Gains/losses on premiums: liquidation of provisions on premiums from years prior to the financial year with a positive or negative impact on premiums earned in the current financial year.

Gains/losses on claims: liquidation of provisions for claims and recoveries from years prior to the financial year with a positive or negative impact on claims expenses for insurance contracts for the current financial year.

Stock market capitalisation: a company’s market value,calculated by multiplying the share price by the number of shares comprising share capital.

Bonding: a credit transaction and not an insurance transaction, a bond is a written undertaking given to a creditor by a guarantor to fulfil a debtor’s obligation in the event of default.

Turnover: sum of earned premiums and service revenues.

Ceding commission: the commission paid by the reinsurer to the ceding company on reinsurance agreements as compensation for placing the business with the reinsurer and to cover the ceding company’s business acquisition expenses.

Broker: an independent intermediary who canvasses companies in order to offer them a credit insurance policy.Brokers advise policyholders during the implementation of the policy or agreement and in its day-to-day management.

Dividend: the portion of a company’s profit attributable to the shareholder.A distinction is made between the net dividend, the sum actually paid by the company to its shareholder, and the gross dividend, which also includes the tax credit.

Price effect: indicator of trends in policy pricing.

Indemnities paid: amount of claims paid by the insurer during the accounting year.

Insolvency: legally recognised incapacity of the debtor to meet its commitments and as such to pay its debts.

Limit: the maximum amount up to which the insurer accepts the trade credit risk (risk of default) on the debtor.

Partial internal model: used to quantify the risks incurred by Coface.In particular, it is used to calculate the Solvency Capital Requirement.

Premium: amount paid by the policyholder in exchange for the insurer’s commitment to cover the risks provided for in the policy.

Earned premium: sum of gross written premiums and reserves for premiums: the portion of the premium issued during the accounting year or earlier, corresponding to the coverage of the risks covered during the accounting year in question.

Issued premium: amount of premium invoiced during the financial year to cover the risks provided for in the contract.

Provision for premiums payable: premiums related to an accounting period that could not be invoiced during this period.

Unearned premium provisions: portion of premiums written during the accounting period relating to the coverage of risks covered for the period between the closing date of the accounting period and the expiry date of the contracts.

Provisions for incurred but not yet reported (IBNR) claims: provision relating to claims not yet known but deemed probable.

Combined ratio: represents total expenses, including service margin, and total claims, divided by total earned premiums.It is therefore the sum of the cost ratio and the claims ratio.

Cost ratio: contract acquisition expenses, administrative expenses and the service margin as a proportion of earned premiums.The service margin corresponds to service revenues less other ordinary operating income and expenses.It can be expressed in gross terms, i.e. before reinsurance, or net terms, which includes the ceding commission.

Loss ratio: claims costs from all related years as a proportion of earned premiums.It can be expressed in gross terms, i.e. before reinsurance, or net terms, which includes the portion ceded to reinsurers.

Solvency II ratio: a regulatory indicator that reflects the company’s ability to meet its commitments to its clients, investors and other counterparties.It corresponds eligible own funds divided by the amount of own funds required by the company according to the risks to which it is exposed (SCR: Solvency Capital Requirement).

Reinsurance: a transaction whereby an insurance company transfers some of the risk it covers to a third party (the reinsurer) in exchange for the payment of a premium.

Debt collection: an amicable and/or legal procedure undertaken by the Group to obtain payment by the debtor of it debt.

Recovery: amounts recovered by the insurer from the debtor (buyer in default of payment) after the insured party has been compensated for the claim.

Underwriting income: sum of turnover, claims expenses, operating expenses (contract acquisition costs, administrative costs and service costs) and reinsurance income.

Credit risk: the risk of a loss resulting from a deterioration in a counterparty’s credit quality or default by a counterparty.

Market risk: the risk of loss arising from to changes in prices on the financial markets or changes in the parameters that may influence these prices.

RoATE – Return on average tangible equity: net income (Group share) over average tangible equity (average equity (Group share) for the period restated for intangible assets).

Loss: a situation in which a risk occurs, giving the right to compensation for the policyholder that makes a claim under the cover provided for in the credit insurance policy.

Ceded claims/total claims (rate of ceded claims): ratio of ceded claims to total claims.Ceded claims correspond to the share of Coface claims ceded to its reinsurers under reinsurance treaties signed with them.

Claims paid: indemnities paid net of recoveries received, plus expenses incurred to manage them (claims handling expenses).

Net production: a business performance indicatorequal to the sum of annualised premiums relating to credit insurance policies newly written during the financial year and annualised premiums relating to policies cancelled during the same financial year.

Solvency II: European regulatory reform of the insurance sector aimed at better adapting the capital requirements of insurance and reinsurance companies to the risks they incur in their business.

Premium ceding rate (ceded premiums/gross earned premiums): ratio of premiums ceded to earned premiums.Ceded premiums correspond to the share of earned premiums that Coface cedes to its reinsurers under reinsurance treaties signed with them.Earned premiums correspond to the sum of written premiums and provisions on earned premiums not written.

Accounting rate of return of financial assets: investment income before income from equity securities, foreign exchange income and financial expenses compared with the balance sheet total of financial assets excluding equity securities.

Accounting rate of return of financial assets excluding income from disposals: investment income before income from equity securities, foreign exchange income and financial expense excluding capital gains or losses on disposals compared with the balance sheet total of financial assets excluding equity securities.

Economic rate of return on financial assets: the economic performance of the asset portfolio.This measures the change in revaluation reserves for the year over the balance sheet total of financial assets plus the accounting rate of return.

Retention rate: ratio between the total value of policies actually renewed and the total value of policies to be renewed.This indicator is expressed as a percentage.

Business volume: reported value of customer turnover relative to the amount of the annualised premiums of the corresponding policies.